


INTRODUCTION
Syntactic complexity has been an important measure of proficiency and development in second language acquisition (SLA) research in general and second language writing (SLW) in particular over the past 45 years (Crymes, Reference Crymes1971; Larsen-Freeman, Reference Larsen-Freeman1978; Lu, Reference Lu2011; Ortega, Reference Ortega2003; Wolfe-Quintero et al., Reference Wolfe-Quintero, Inagaki and Kim1998). Although a variety of indices have been used, syntactic complexity has predominantly been operationalized as the mean length of T-unit (MLT), mean length of clause (MLC), or the proportion of clauses in a text that are dependent clauses (DC/C) (Lu, Reference Lu2011; Ortega, Reference Ortega2003). The default hypothesis has been that proficient learners will produce more linguistically complex structures (e.g., more dependent clauses and/or longer T-units) as a function of language proficiency (broadly construed). Recently, however, a number of researchers have commented on some of the limitations of complexity indices such as MLT, MLC, and DC/C for the purpose of modeling differences across proficiency levels and/or developmental trends (Biber et al., Reference Biber, Gray and Poonpon2011; Kyle & Crossley, Reference Kyle and Crossley2017; Norris & Ortega, Reference Norris and Ortega2009). One limitation is that traditional syntactic complexity measures are based solely on the number of elements in a syntactic form and do not take into account the relative frequency of the syntactic forms or the relationship between the syntactic forms and the lexical items with which they are used.
A usage-based perspective, however, considers syntactic forms and lexical items to be inseparable: Language consists of form-meaning pairs, called constructions, that may differ in the level of specificity and schematicity and may range from morphemes to words, phraseological units, and verb argument constructions (VACs). Furthermore, because the main learning mechanism in both L1 and L2 is association, learning of constructions is sensitive to frequency, saliency, and contingency effects (e.g., Ellis, Reference Ellis2002). In English, for example, VACs such as make—direct object and subject—have—direct object are particularly frequent and are likely to be learned earlier than less frequent VACs.
In response to some of the limitations mentioned in the preceding text, Kyle and Crossley (Reference Kyle and Crossley2017) introduced a number of usage-based VAC indices related to frequency and contingency, which we will refer to as indices of VAC sophistication.Footnote 1 Kyle and Crossley (Reference Kyle and Crossley2017) compared the relationships between indices of VAC sophistication and syntactic complexity (e.g., MLT, MLC, and DC/C) and holistic scores of writing quality. Their findings indicated that indices of VAC sophistication were better predictors of holistic writing quality scores than indices of syntactic complexity. In the current study, we build on Kyle and Crossley (Reference Kyle and Crossley2017) by investigating whether the trends observed in their earlier cross-sectional study are also representative of developmental trends over time. This is particularly important given that studies have repeatedly found different trends for cross-sectional and longitudinal data (Bestgen & Granger, Reference Bestgen and Granger2014; Bulté & Housen, Reference Bulté and Housen2014, Reference Bulté and Housen2018; Crossley & McNamara, Reference Crossley and McNamara2014; Murakami & Alexopoulou, Reference Murakami, Alexopoulou, Papafragou, Grodner, Mirman and Trueswell2016). The mismatch between some cross-sectional and longitudinal studies suggests that although linguistic features evident at particular proficiency benchmarks may be relatively stable, the paths that individual learners take to reach those benchmarks may be diverse (e.g., de Bot et al., Reference Bot, Lowie, Thorne, Verspoor, Mayo, Mangado and Adrián2013; Larsen-Freeman & Cameron, Reference Larsen-Freeman and Cameron2008). Moreover, Lowie and Verspoor (Reference Lowie and Verspoor2019) have made a strong case for complementing cross-sectional studies with individual longitudinal case studies because of the ergodicity problem (i.e., group means may not represent individual trajectories). In other words, to be sure developmental indices are useful, they need to be tested in both cross-sectional and longitudinal studies.
SYNTACTIC COMPLEXITY
For much of the time that SLA has been a field of study, one measure of productive language proficiency and/or development has been the complexity of the syntactic structures used in second language writing or speaking samples. Commonly, measures such as the MLT have been used as broad measures of complexity (e.g., Norris & Ortega, Reference Norris and Ortega2009; Ortega, Reference Ortega2003). Hunt (Reference Hunt1965) introduced the T-unit (an independent clause and all associated clauses) and the associated index MLT to measure writing development in first language (L1) school age children. Hunt found a positive relationship between average T-unit length and grade level, suggesting that more advanced students tended to write longer T-units. Following Hunt’s study, MLT also gained traction as an index of L2 development (Crymes, Reference Crymes1971; Larsen-Freeman, Reference Larsen-Freeman1978; Larsen-Freeman & Strom, Reference Larsen-Freeman and Strom1977; Thornhill, Reference Thornhill1969). Other indices of syntactic complexity such as clauses per T-unit (C/T), MLC, and DC/C were also soon added to researchers’ repertoire (Lu, Reference Lu2011; Ortega, Reference Ortega2003; Wolfe-Quintero et al., Reference Wolfe-Quintero, Inagaki and Kim1998), though MLT has been the most popular (e.g., Ortega, Reference Ortega2003).
Although results have been mixed, a number of cross-sectional L2 writing studies have indicated a positive relationship between MLT and writing proficiency and/or grade level. Wolfe-Quintero et al. (Reference Wolfe-Quintero, Inagaki and Kim1998), for example, report that 23 studies between 1970 and the mid-1990s found significant differences in MLT between proficiency levels (though 17 studies also found nonsignificant differences). More recently, Cumming (Reference Cumming, Kantor, Baba, Erdosy, Eouanzoui and James2005) found that more proficient writers (as assigned by holistic scores of writing quality) tended to write longer T-units. In an investigation of writing differences across university levels, Lu (Reference Lu2011) found that MLT increased after the first year of studying English in an EFL university context. Longitudinal studies have also indicated a generally positive relationship between indices of syntactic complexity and time spent studying a second language. Byrnes (Reference Byrnes2009), for example, found that L2 German writers used more words per T-unit as a function of time spent studying German. Vyatkina (Reference Vyatkina2012) found similar results in mean length of sentence (MLS) scores both cross-sectionally and with two focal participants who were studied longitudinally. Bulté and Housen (Reference Bulté and Housen2014) also found longitudinal growth in MLT scores during a semester-long English for academic purposes (EAP) L2 writing course. However, these gains are not always large (or statistically significant), even over longer periods (e.g., Knoch et al., Reference Knoch, Rouhshad and Storch2014).
Although large-grained indices of syntactic complexity such as MLT have been (and continue to be) used in a number of L2 studies, a number of limitations have been noted in the literature regarding their use (Biber et al., Reference Biber, Gray and Poonpon2011; Kyle & Crossley, Reference Kyle and Crossley2017; Norris & Ortega, Reference Norris and Ortega2009). First, such measures may obscure the particular linguistic features that account for longer T-units (Norris & Ortega, Reference Norris and Ortega2009). Second, Biber et al. (Reference Biber, Gray and Poonpon2011) indicated that clausal subordination (which tends to be strongly correlated with MLT [Lu, Reference Lu2011]) is characteristic of spoken texts, while a characteristic feature of academic writing is the use of elaborated noun phrases, suggesting that different measures may be needed for different modes and at different stages in L2 development. Subsequent cross-sectional and longitudinal research (Biber et al., Reference Biber, Gray and Staples2014; Kyle & Crossley, Reference Kyle and Crossley2018; Penris & Verspoor, Reference Penris, Verspoor, Pfenniger and Navracsics2017) has indicated that more proficient L2 writers will produce a higher proportion of elaborated phrases, and that phrasal complexity is a better predictor of writing proficiency scores than clausal subordination. A third issue with indices of syntactic complexity (and particularly with large-grained indices such as MLT) is that it is difficult to motivate or interpret these indices from a theoretical perspective (Biber et al., Reference Biber, Gray and Poonpon2011; Kyle & Crossley, Reference Kyle and Crossley2017; Norris & Ortega, Reference Norris and Ortega2009). While research findings seem to indicate a fairly clear model of a positive relationship between syntactic elaboration and L2 proficiency, this model is based on syntactic structure only and is difficult to link to the frequency of occurrence of form-meaning mappings found in usage-based perspectives on language learning.
VAC SOPHISTICATION
Usage-based theories of language learning posit that learning occurs as a function of language use (Ellis, Reference Ellis2002; Tomasello, Reference Tomasello2003; Verspoor, Reference Verspoor, Ortega and Han2017). Language items that are heard and/or used more frequently are more strongly associated and are more salient, and will be learned earlier and/or more easily than those that are encountered less frequently (Ellis & Ferreira-Junior, Reference Ellis and Ferreira-Junior2009), regardless of their structural complexity. From a usage-based perspective then, language development can be modeled using the frequency, strength of association, and saliency of linguistic constructions in an individual’s input. The roles of frequency and saliency in language learning are widely accepted (regardless of theoretical orientation) when dealing with lexis (e.g., O’Grady, Reference O’Grady2008). Lexical sophistication studies have demonstrated, for example, that more proficient L2 users tend to use a higher proportion of low-frequency words than less proficient L2 users (e.g., Crossley et al., Reference Crossley, Salsbury and McNamara2010; Kyle & Crossley, Reference Kyle and Crossley2015; Laufer & Nation, Reference Laufer and Nation1995). Further, indices such as concreteness have been increasingly used to measure lexical salience and have shown that L2 users use words that are less concrete as a function of time spent studying an L2 (e.g., Crossley et al., Reference Crossley, Kyle and Salsbury2016).
In a similar vein, there are a growing number of studies that have investigated the relationship between the frequency and strength of association of multiword utterances and proficiency (e.g., Bestgen & Granger, Reference Bestgen and Granger2014; Garner et al., Reference Garner, Crossley and Kyle2019; Verspoor & Smiskova, Reference Verspoor, Smiskova and Manchón2012). These studies of phrasal sophisticationFootnote 2 have primarily investigated two-word combinations (either contiguous or with intervening words). In contrast to lexical studies, these studies have found that more proficient L2 users tend to use more frequent and more strongly associated (i.e., more targetlike) multiword utterances (c.f. Durrant & Schmitt, Reference Durrant and Schmitt2009). The fact that beginners do not use these word combinations to begin with may be explained through the principle of overgeneralization (e.g., Ninio, Reference Ninio1999; Verspoor & Behrens, Reference Verspoor and Behrens2011). In usage-based theories, overgeneralization refers to phenomena wherein learners discover that a particular construction has schematicity (i.e., that a seemingly fixed construction includes a variable slot) and subsequently use a wide range of items in this variable slot. This results in the production of a wide range of constructions (e.g., multiword utterances) that are not (necessarily) as strongly associated as in the target language yet. Through additional language exposure, however, the items learners use in a particular construction tend to represent their input more closely (and therefore are more strongly associated).
Studies of lexical and phrasal sophistication have indicated that more proficient L2 users are more likely to use less frequent words, but are more likely to use those words in more targetlike multiword constructions. Usage-based perspectives also extend to the levels of linguistic abstraction that have been traditionally regarded as syntaxFootnote 3 (e.g., Ellis, Reference Ellis2002; Goldberg, Reference Goldberg2006; Tomasello, Reference Tomasello2003). Recent work related to L2 development from a usage-based perspective has focused on the characteristics of VACs used by learners over time and/or at varying proficiency levels (Ellis & Ferreira-Junior, Reference Ellis and Ferreira-Junior2009; Eskildsen, Reference Eskildsen2009; Kyle & Crossley, Reference Kyle and Crossley2017). Due to the difficulties involved with manually annotating VACs and in obtaining large samples of direct language input, most studies (e.g., Ellis & Ferreira-Junior, Reference Ellis and Ferreira-Junior2009; Eskildsen, Reference Eskildsen2009) have only examined a small subset of particularly frequent VACs and have only used small snippets of interlocutor data to represent a learner’s linguistic input. However, recent computational advances have allowed researchers to automatically extract frequency and strength of association data from large corpora such as the British National Corpus (BNC; BNC Consortium, 2007; O’Donnell & Ellis, Reference O’Donnell and Ellis2010) and the Corpus of Contemporary American English (COCA; Davies, Reference Davies2009; Kyle & Crossley, Reference Kyle and Crossley2017). Much like work in lexical and phraseological development, reference corpus norms for VACs can be used to represent language input. Research by Römer and colleagues, for example, show that corpus frequencies closely model the verb choices made by L1 (Römer et al., Reference Römer, O’Donnell, Ellis, Groom, Charles and Suganthi2015) and advanced L2 (Römer et al., Reference Römer, Roberson, O’Donnell and Ellis2014) users for a variety of VACs.
Recently, Kyle and Crossley (Reference Kyle and Crossley2017) introduced a number of indices related to VAC frequency and strength of association, which we will refer to as indices of VAC sophistication (owing to similarities with frequency and strength of association-based indices of lexical sophistication and phraseology). They then compared the relationship between indices of VAC sophistication and syntactic complexity (e.g., MLT, MLC) and holistic scores of writing quality in TOEFL essays. They found that a model consisting of indices of VAC sophistication explained significantly greater variance in writing quality scores (R2 = .140) than a model consisting of indices of syntactic complexity (R 2 = .058). The results indicated that more proficient writers (as measured by holistic writing quality scores) tended to use verb-VAC combinations that were on average less frequent but more strongly associated, suggesting that more proficient L2 users had learned more verb-VAC combinations and also used verb-VAC combinations that are more targetlike. With regard to syntactic complexity, only two indices were found to have a meaningful relationship with holistic writing score, and only one (MLC) was included in the final regression model. The findings of Kyle and Crossley (Reference Kyle and Crossley2017) provide some cross-sectional evidence that indices of VAC sophistication may be better indicators of writing proficiency at advanced levels than indices of syntactic complexity. However, it is unclear whether these cross-sectional models also represent developmental trends (Bestgen & Granger, Reference Bestgen and Granger2014; Bulté & Housen, Reference Bulté and Housen2014; Crossley & McNamara, Reference Crossley and McNamara2014; Lowie & Verspoor, Reference Lowie and Verspoor2019). Another open question is the degree to which indices of syntactic complexity provide unique predictive power when used in conjunction with VAC sophistication indices to predict proficiency levels and/or points along a developmental trajectory. Kyle and Crossley (Reference Kyle and Crossley2017) found differences in the predictive power of indices of syntactic complexity and VAC sophistication (using separate models), but did not directly examine the relationship between the two types of indices to determine the degree to which changes in VAC sophistication and changes in syntactic complexity are distinct.
CURRENT STUDY
In the current study, we investigate longitudinal development in L2 learners using syntactic indices related to complexity and VAC sophistication. First, we use the commonly used indices of syntactic complexity (e.g., MLT, MLC, and DC/C) available in Lu’s (Reference Lu2011) second language syntactic complexity analyzer (L2SCA) as a baseline and to allow comparisons with previous studies that have depended on large-grained indices. We then use indices of VAC sophistication that have previously been found to be important predictors of proficiency including three VAC sophistication indices related to VAC frequency (frequency of VAC + verb, frequency of VAC irrespective of verb, and frequency of verb irrespective of VAC) and three indices of verb-VAC strength of association (each of which uses a different method of calculating strength of association). Finally, we construct a model that uses both indices of syntactic complexity and VAC sophistication to predict the time at which a particular essay was written (e.g., near the beginning or end of the study). The goal of the final model is to determine the degree to which indices of syntactic complexity and VAC sophistication provide unique information about developmental trajectories.
This study is guided by the following research questions:
-
1. What is the relationship between indices of syntactic complexity and time spent studying English?
-
2. What is the relationship between VAC sophistication and time spent studying English?
-
3. To what extent do indices of syntactic complexity and VAC sophistication uniquely predict the time at which a particular essay was produced?
METHOD
LEARNER CORPUS
The longitudinal EFL essay corpus used in this study is derived from a larger corpus of essays ( n = 20) collected from Dutch students at a competitive secondary school in the Netherlands over two academic years (Verspoor & Smiskova, Reference Verspoor, Smiskova and Manchón2012) and includes essays from the students (n = 9) who completed all assignments. Part of this corpus was also used for the cross-sectional study reported on by Verspoor et al. (Reference Verspoor, Schmid and Xu2012). These students aged 12–13 had a high scholastic aptitude as determined by the Dutch CITO test, which most children take around age 11 or 12 (cf. Verspoor et al., Reference Verspoor, Bot and Xu2015). The students had studied some English during elementary school. In addition, because of the high media exposure to English in the Netherlands, they were low intermediate learners at the beginning of the study. In terms of the Common European Framework of Reference (CEFR), the learners were at an A2 level based on scores assigned to their essays by certified CEFR raters.
Essays were collected three times per year, in October, February, and June of the academic year, for a total of six essays per student. The subset of the corpus used for this study includes essays from the nine participants who wrote essays at each collection point. Essays were completed at school using a computer and were untimed but limited to 1,000 characters. No dictionaries or other external resources were allowed. All participants wrote on the same prompt at a particular collection point. The prompts were relevant to the students at time of writing (i.e., they had ecological validity) and were designed in a manner that avoided the need for specialized language. Table 1 contains a list of the topics used.
TABLE 1. Essay topics in the longitudinal learner corpus

As reported in Verspoor et al. (Reference Verspoor, Schmid and Xu2012), each essay was scored by four raters using a holistic proficiency rubric, which ranged from 0 to 7. The rubric emerged from lengthy discussions between a group of experienced ESL teachers. The final rubric descriptors referred to a range of features including text length, sentence length, sentence complexity, syntactic variation, use of tense, aspect, mood, range of vocabulary, use of L1, use of idiomatic language, and accuracy (see the Appendix for the full rubric). Raters included eight experienced ESL teachers, who were split into two groups. If three of four raters agreed on a score, the score was kept. If fewer than three raters agreed on an essay score, the score was then adjudicated by the raters until sufficient agreement was reached (Verspoor et al., Reference Verspoor, Schmid and Xu2012, Reference Verspoor, Bot and Xu2015). Table 2 includes an overview of the nine participants’ writing from the longitudinal learner corpus included in this analysis.
TABLE 2. Overview of the longitudinal learner corpus data

LINGUISTIC INDICES
All texts were analyzed using the Tool for the Automatic Analysis of Syntactic Sophistication and Complexity (TAASSC; Kyle, Reference Kyle2016). Each of the selected indices is described in the following text.
Indices of Syntactic Complexity
To compute syntactic complexity measures, we used Lu’s (Reference Lu2011) L2 complexity analyzer (L2SCA) indices, which have been shown to be highly reliable with L2 data.Footnote 4 We use the version of L2SCA that is included as part of TAASSC. L2SCA includes 14 indices of syntactic complexity drawn from Ortega (Reference Ortega2003) and Wolfe-Quintero et al. (Reference Wolfe-Quintero, Inagaki and Kim1998). For this study, five indices of syntactic complexity outlined in Lu (Reference Lu2011) were considered. Two large-grained indices, MLT and MLC, were selected based on comparability with the bulk of previous studies (Ortega, Reference Ortega2003). Three more fine-grained indices were also selected to cover the use of a range of particular structures including complex nominals per clause (CN/C), coordinate phrases per clause (CP/C), and DC/C. Table 3 includes a description of the structures counted by L2SCA to calculate the variables used in this study, and Table 4 comprises a list of the five L2SCA indices used including a short description of each. For further information, refer to Lu (Reference Lu2011).
TABLE 3. A description of syntactic structures counted by L2SCA for variables used in this study
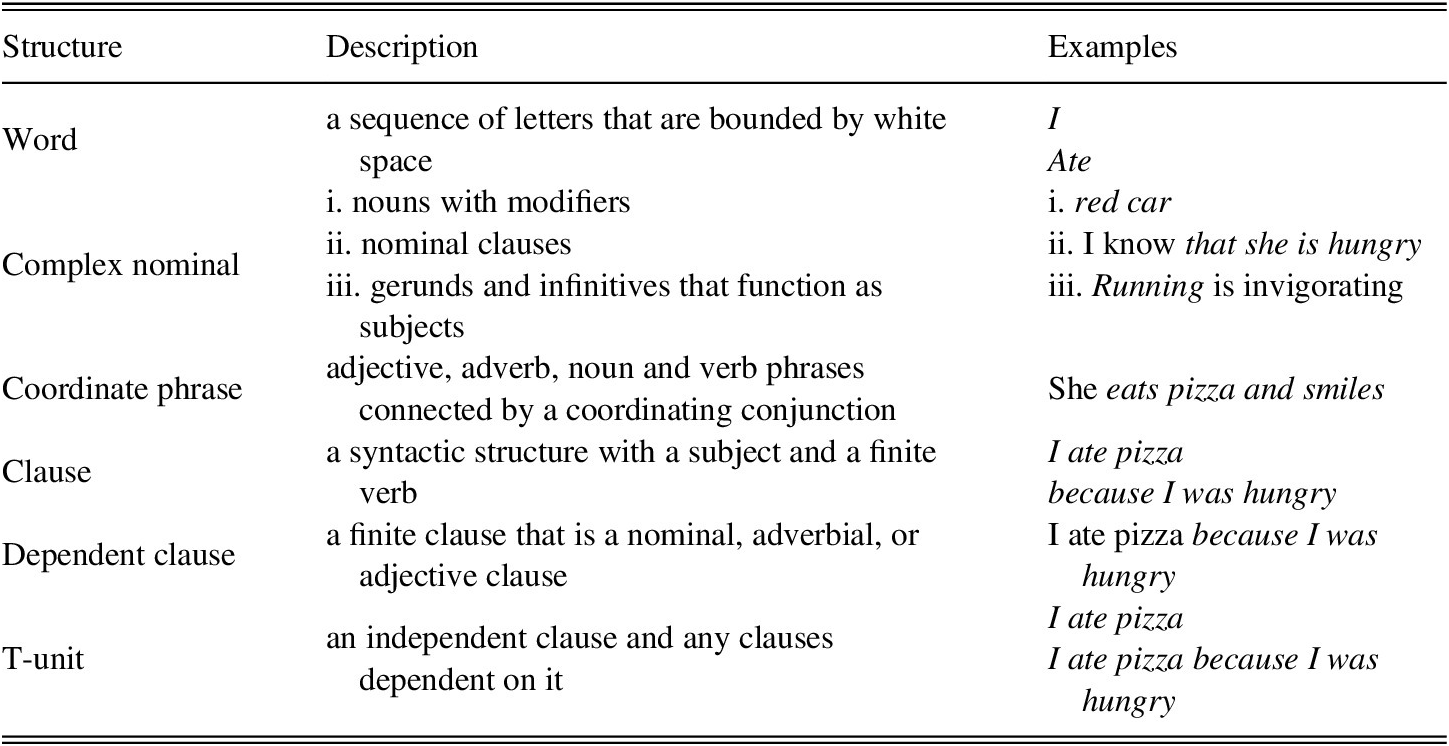
Note: As reported in Kyle and Crossley (Reference Kyle and Crossley2017, p. 521).
TABLE 4. A description of L2SCA variables considered

Note: As reported in Kyle and Crossley (Reference Kyle and Crossley2017, p. 521).
VAC Sophistication Indices
TAASSC calculates a number of indices related to VAC frequency and strength of association derived from the corpus of contemporary American English (COCA; Davies, Reference Davies2009). Identification of VAC features in TAASSC is based on the Stanford Neural Network Dependency Parser (Chen & Manning, Reference Chen and Manning2014), a state-of-the-art dependency parser.Footnote 5 For this study, six indices related to frequency and strength of association were calculated using the ~360-million-word written sections of COCA (academic, fiction, magazine, and newspaper). The calculation of frequency scores and three strength of association scores (delta P VAC to verb, delta P verb to VAC, and a bidirectional measure) are described in the following text.
Frequency
Frequency indices related to main verb lemmas, unfilled VAC frames (e.g., nominal subject—verb slot—direct object), and VAC frames with particular main verb lemmas (e.g., nominal subject—have—direct object) were used. See Tables 5–7 for examples of the most frequent main verb lemmas (Table 5), VACs (Table 6), and verb-VAC combinations (Table 7) in COCA. Mean frequency scores for main verbs, VACs and verb-VAC combinations were calculated for each target text. If a particular target structure (e.g., a VAC) that occurs in a text does not occur in the reference corpus, it is not counted toward the index score.
TABLE 5. Main verb lemma frequencies in the written sections of COCA

Note: As reported in Kyle and Crossley (Reference Kyle and Crossley2017, p. 522).
TABLE 6. Verb argument construction frequencies in the written sections of COCA

Note: As reported in Kyle and Crossley (Reference Kyle and Crossley2017, p. 523).
TABLE 7. Most common verb argument construction-main verb lemma combinations in the written sections of COCA

Note: As reported in Kyle and Crossley (Reference Kyle and Crossley2017, p. 523).
Delta P
Delta P calculates the probability of an outcome (e.g., a VAC) given a cue (e.g., a particular verb) minus the probability of the outcome without the cue (e.g., with any other verb). Delta P is calculated with both VACs as cues and with verbs as cues. To calculate delta P with a VAC as the outcome and a verb as the cue we use the following formula (see Table 8):
 $ delta\ p=\left(\frac{\mathrm{a}}{\mathrm{a}+\mathrm{b}}\right)\hbox{--} \left(\frac{\mathrm{c}}{\mathrm{c}+\mathrm{d}}\right) $
. The delta P value for the outcome of the SVO given the cue have (see Table 8) is calculated as:
$ delta\ p=\left(\frac{\mathrm{a}}{\mathrm{a}+\mathrm{b}}\right)\hbox{--} \left(\frac{\mathrm{c}}{\mathrm{c}+\mathrm{d}}\right) $
. The delta P value for the outcome of the SVO given the cue have (see Table 8) is calculated as:
 $ delta\ p=\left(\left(\frac{\mathrm{212,970}}{\mathrm{212,970}+\mathrm{991,685}}\right)=.177\right)\hbox{--} \left(\left(\frac{\mathrm{1,733,964}}{\mathrm{1,733,964}+\mathrm{30,909,494}}\right)=.053\right)=.124 $
. The probability of the outcome SVO given the cue have (.177) is larger than the probability that the SVO will be the outcome given another verb cue (.053), resulting in a positive delta P value (.124). In the current study, we use two indices based on the mean delta P score for tokens in the target text, one using the verb as the cue, and the other using the construction as the cue. Mean delta P scores are calculated for each target text (separate indices are included for verb-cued and VAC-cued scores) based on the written sections of COCA.
$ delta\ p=\left(\left(\frac{\mathrm{212,970}}{\mathrm{212,970}+\mathrm{991,685}}\right)=.177\right)\hbox{--} \left(\left(\frac{\mathrm{1,733,964}}{\mathrm{1,733,964}+\mathrm{30,909,494}}\right)=.053\right)=.124 $
. The probability of the outcome SVO given the cue have (.177) is larger than the probability that the SVO will be the outcome given another verb cue (.053), resulting in a positive delta P value (.124). In the current study, we use two indices based on the mean delta P score for tokens in the target text, one using the verb as the cue, and the other using the construction as the cue. Mean delta P scores are calculated for each target text (separate indices are included for verb-cued and VAC-cued scores) based on the written sections of COCA.
TABLE 8. Contingency table used to calculate various indices of association strength

Note: Adapted from Gries et al. (Reference Gries, Hampe and Schönefeld2005, p. 644) and Kyle and Crossley (Reference Kyle and Crossley2017, p. 524).
Bidirectional Association Strength
In studies that measure the strength of association between VACs and the verbs that fill them, both unidirectional measures (such as delta p) and bidirectional measures have been used. The bidirectional association strength measure of choice has been a transformation of the Fisher–Yates exact testFootnote
6 (Fisher, Reference Fisher1934; Yates, Reference Yates1934), which refers to the joint probability that a VAC and a verb will co-occur (Gries et al., Reference Gries, Hampe and Schönefeld2005). One issue in calculating the Fisher–Yates exact test with large corpora is that the resulting probability values are so small that most programs round them to p = 0 (−log10(0) = infinity; for strongly associated verb-VAC combinations such as have + SVO) or p = 1 (−log10(1) = 0; for less strongly associated verb-VAC combinations such as impute + SVO). This can result in issues related to precision, where a large percentage of observed verb-VAC combinations are assigned the same association score due to rounding. One solution to this issue is to calculate a related measure that correlates almost perfectly with the original method (S. T. Gries, personal communication, 2014), but is much easier to compute with large frequency values (such as those found in COCA). This method is calculated as follows:
 $ bidirectional\ association\ strength=\left(\left(\frac{a}{a+b}\right)\hbox{--} \left(\frac{c}{c+d}\right)\right)\ast \left(a+b\right). $
Mean bidirectional association strength scores are calculated for each target text based on the written sections of COCA.
$ bidirectional\ association\ strength=\left(\left(\frac{a}{a+b}\right)\hbox{--} \left(\frac{c}{c+d}\right)\right)\ast \left(a+b\right). $
Mean bidirectional association strength scores are calculated for each target text based on the written sections of COCA.
ANALYSES
To determine whether a systematic relationship existed between indices of syntactic complexity and VAC sophistication and time spent studying English, a series of linear mixed-effects (LME) models were developed. LME models can examine development over time while controlling for individual participant behaviors (Gries, Reference Gries2015). The R (R Core Team, 2016) package lme4 (Bates, Reference Bates2010) was used to perform LME analyses. In each analysis, the linguistic variable (e.g., MLT or verb frequency) was set as the dependent variable, Time (which refers to collection points 1–6) was set as a fixed effect, and Participant was set as a random effect (with random intercepts). The LME analysis presumed that while participants may have different starting points (e.g., initial MLT values), their development would follow similar trends. Thus, the following equation was used for all analyses: lmer(Syntactic_Index ~ Time + (1|Participant)). The R package lmerTest (Kuznetsova et al., Reference Kuznetsova, Brockhoff and Christensen2015) was used to estimate p values with the default Satterthwaite method (Satterthwaite, Reference Satterthwaite1941). In cases in which the Satterthwaite method failed to converge, the Kenward–Roger method (Kenward & Roger, Reference Kenward and Roger1997) was used. The R package MuMIn (Barton, Reference Barton2013) was used to generate effect sizes and to estimate the relative importance of fixed factors. We report both the marginal R2 values (R2m), which indicates the amount of variance explained by only the fixed effects, and the conditional R2 values (R2c), which indicate the amount of variance explained by the fixed effects and the random effects. In cases in which the model was not able to fit the random effects, only the R2m values are reported.Footnote 7
RESULTS AND DISCUSSION
PRELIMINARY ANALYSIS
Before addressing the research questions, we examined whether the participants become more proficient writers of English as a function of time. A LME model indicated a significant positive relationship between time and holistic essay scores (p < .001, R2m = .576). A summary of the model can be found in Table 9. The results indicate that the participants’ writing proficiency increased over the 2-year period, at a rate of approximately .5 points per collection point. Figure 1 includes plots of the holistic scores given to each participant’s essays at each collection point with the regression line (indicated by the dashed line) produced by the model.
TABLE 9. LME model predicting holistic writing score

Note: The fit was singular.

FIGURE 1. Holistic scores at each time point for each participant.
RQ1 Results: Syntactic Complexity Indices
Five indices of syntactic complexity outlined in Lu (Reference Lu2011) and discussed in the preceding text were used to examine longitudinal growth in the learner corpus (i.e., MLT and MLC, CN/C, CP/C, and DC/C). An initial check for assumptions indicated that CP/C failed to meet the assumption of normality (due to rare occurrence in the corpus) and was removed from further consideration. The results for each of the remaining four indices are reported in the following text.
CN/C
A LME model was run using Time to predict the number of CN/C in the participant essays. The model did not identify a clear relationship between Time and CN/C in the participant essays (p = .388, R2m = .014). A summary of the model can be found in Table 10. Figure 2 includes line plots for the CN/C scores for each participant at each collection point with the regression lines (indicated by the dashed line) produced by the model.
TABLE 10. LME model predicting complex nominals per clause

Note: The fit was singular.

FIGURE 2. Complex nominals per sentence at each time point for each participant.
DC/C
A LME model was run using Time to predict the number of dependent clauses per clause. The results of the analysis indicated that there was a significant positive relationship between Time and DC/C in the participant essays (p < .001, R2m = .401, R2c = .440). A summary of the model can be found in Table 11. The results indicate that the participants used a higher proportion of dependent clauses at each progressive collection point over the 2-year period. At time point one, dependent clauses on average account for approximately 12.5% of the clauses in a participant text. At each time point, the proportion of dependent clauses increases by 4.9%, indicating that by the final time point, dependent clauses account for approximately 37% of the clauses in each text. Figure 3 includes plots of the DC/C scores for each participant at each collection point with the regression lines (indicated by the dashed line) produced by the model.
TABLE 11. LME model predicting dependent clauses per clause


FIGURE 3. Dependent clauses per clause at each time point for each participant.
MLC
A LME model was run using Time to predict the MLC in the participant essays. The model did not identify a clear relationship between Time and MLC in the participant essays (p = .336, R2m = .014, R2c = .256). A summary of the model can be found in Table 12. Figure 4 includes plots of the MLC scores for each participant at each collection point with the regression lines (indicated by the dashed line) produced by the model.
TABLE 12. LME model predicting mean length of clause


FIGURE 4. Mean length of clause at each time point for each participant.
MLT
A LME model was run using Time to predict the MLT in the participant essays. The results of the analysis indicated that there was a significant positive relationship between Time and MLT in the participant essays (p < .001, R2m = .191, R2c = .355). A summary of the model can be found in Table 13. The results indicate that the participants wrote longer T-units over the 2-year period, at a rate of approximately .7 words per T-unit at progressive collection points. Figure 5 includes plots of the MLT scores for each participant at each collection point with the regression lines (indicated by the dashed line) produced by the model.
TABLE 13. LME model predicting mean length of T-unit


FIGURE 5. Mean length of T-unit values at each time point for each participant.
RQ1 Discussion: Syntactic Complexity Indices
The results of the four analyses indicated that significant positive linear trends existed between Time and DC/C and MLT with moderate to large effect sizes. As participants spent time studying English, they tended to write longer T-units and produced a higher proportion of dependent clauses. No significant trends were observed between Time and MLC and CN/C, and only small effect sizes (r = .118, R2m = .014) were observed. T-units can be lengthened through the addition of a number of linguistic constructions such as phrasal modifiers and/or subordinated clauses. Given that there was not a clear relationship between Time and CN/C, it is likely that the relationship between MLT and Time was primarily attributable to the addition of subordinate clauses. To test this hypothesis, post-hoc partial correlations were calculated using the ppcor package (Kim & Kim, Reference Kim and Kim2015) in R. The results, which are summarized in Table 14, indicate a moderate relationship (r = .443) between Time and MLT. However, when we control for the influence of DC/C on the relationship between Time and MLT, the relationship between Time and MLT is negligible (r = −.046). Conversely, when we control for the influence of MLT on the relationship between Time and DC/C, the relationship between Time and DC/C is still meaningful (r = .513). These results suggest that DC/C is the clearest and most accurate indicator of longitudinal growth in syntactic complexity in this dataset.
TABLE 14. Correlations between MLT, DC/C, and Time

Overall, these results align with the majority of previous studies that have found increases in MLT as a function of time and/or proficiency (Bulté & Housen, Reference Bulté and Housen2014; Lu, Reference Lu2011; Ortega, Reference Ortega2003). The results with regard to DC/C support the general hypothesis (at least for lower-proficiency learners) that more proficient writers will use more subordinated clauses in writing and is in line with Verspoor et al.’s (Reference Verspoor, Schmid and Xu2012) finding that there was a strong correlation between scores and number of dependent clauses. As this trend has not been consistently demonstrated in the L2 writing literature (e.g., Bulté & Housen, Reference Bulté and Housen2014; Ortega, Reference Ortega2003), it is important to consider the effects of writing task (narrative and expository writing), age (middle school students), L2 writing proficiency (low), and context (bilingual EFL secondary school). Bulté and Housen (Reference Bulté and Housen2014), for example, found that university-level ESL students demonstrated no meaningful development in DC/C over the course of a semester, but did demonstrate increases in noun phrase complexity, and similar results were reported in Kyle and Crossley (Reference Kyle and Crossley2018) as predicted by Biber et al. (Reference Biber, Gray and Poonpon2011). Further, Verspoor and colleagues (e.g., Penris & Verspoor, Reference Penris, Verspoor, Pfenniger and Navracsics2017; Verspoor et al., Reference Verspoor, Schmid and Xu2012) have argued that different linguistic features, both syntactic and lexical, will be prominent at different proficiency levels and stages of development. Dependent clause use may increase between some levels (such as the lower levels represented in this study), but then may become asymptotic and/or may be replaced by the use of other structures (e.g., features of noun phrase complexity).
RQ2 Results: VAC Sophistication Indices
Six indices related to usage-based theories of language development were considered. Three frequency measures were considered, including main verb frequency, VAC frequency, and verb-VAC frequency. Log transformations were used to adjust for the Zipfian nature of frequency data. Additionally, three indices that measured the strength of association between VACs and the verbs that filled them were considered, including delta p (verb as cue), delta p (VAC as the cue), and a bidirectional measure of association strength. All indices were calculated based on frequencies from the written portions of the COCA (Davies, Reference Davies2009). The results of each of the six LME analyses are included in the following text.
Main Verb Frequency
A LME model was run using Time to predict the mean main verb frequency score in the participant essays. The results of the analysis indicated that there was a negative relationship between Time and main verb frequency in the participant essays (p < .001, R2m = .457, R2c = .467). A summary of the model can be found in Table 15. The results indicate that the participants used less frequent main verbs as a function of time. Figure 6 includes line plots for the main verb frequency scores for each participant at each collection point with the regression lines (indicated by the dashed line) produced by the model.
TABLE 15. LME model predicting mean main verb frequency score
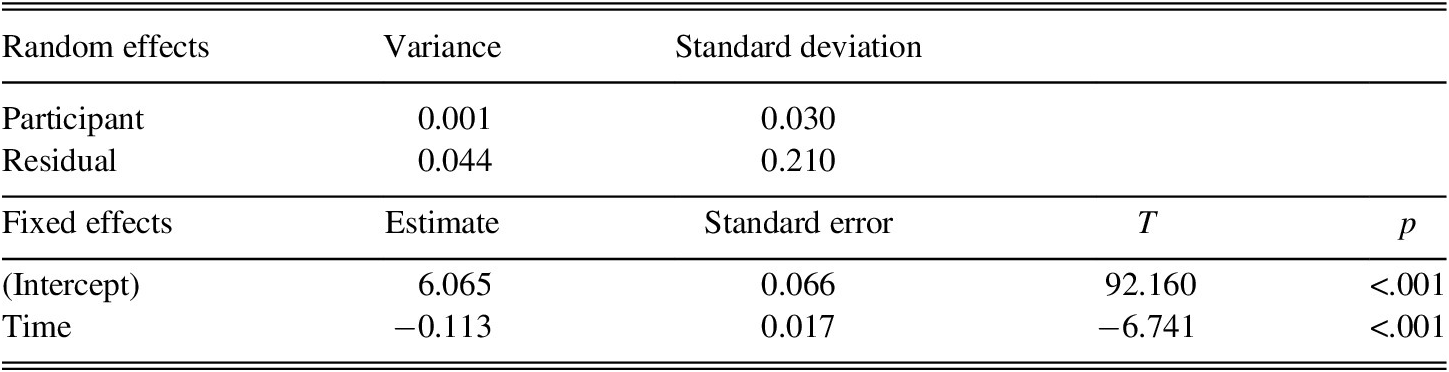

FIGURE 6. Average main verb frequency at each time point for each participant.
VAC Frequency
A LME model was run using Time to predict the mean VAC frequency score in the participant essays. The model did not identify a clear relationship between Time and VAC frequency in the participant essays (p = .425, R2m = .012). A summary of the model can be found in Table 16. Figure 7 includes plots of the VAC frequency scores for each participant at each collection point with the regression lines (indicated by the dashed line) produced by the model.
TABLE 16. LME model predicting mean VAC frequency score

Note: The fit was singular.

FIGURE 7. Average VAC frequency at each time point for each participant.
Verb-VAC Frequency
A LME model was run using Time to predict the mean verb-VAC frequency score in the participant essays. The results of the analysis indicated that there was a negative relationship between Time and verb-VAC frequency in the participant essays (p < .001, R2m = .241). A summary of the model can be found in Table 17. Figure 8 includes plots of the verb-VAC frequency scores for each participant at each collection point with the regression lines (indicated by the dashed line) produced by the model.
TABLE 17. LME model predicting mean verb-VAC frequency score

Note: The fit was singular.

FIGURE 8. Average verb-VAC frequency at each time point for each participant.
Delta p (Verb as Cue)
A LME model was run using Time to predict the mean strength of association score (delta p, verb as cue) in the participant essays. The model did not identify a clear relationship between Time and strength of association score as measured by delta p (verb as cue) in the participant essays (p = .702, R2m = .003). A summary of the model can be found in Table 18. Figure 9 includes line plots for the delta p (verb as cue) scores for each participant at each collection point with the regression lines (indicated by the dashed line) produced by the model.
TABLE 18. LME model predicting mean strength of association score (delta P verb as cue)

Note: The fit was singular.

FIGURE 9. Average delta P (verb as cue) score at each time point for each participant.
Delta p (VAC as Cue)
A LME model was run using Time to predict the mean strength of association score (delta p, VAC as cue) in the participant essays. The model did not identify a clear relationship between Time and strength of association score as measured by delta p (VAC as cue) in the participant essays (p = .189, R2m = .032). A summary of the model can be found in Table 19. Figure 10 includes line plots for the delta p (VAC as cue) scores for each participant at each collection point with the regression lines (indicated by the dashed line) produced by the model.
TABLE 19. LME model predicting mean strength of association score (delta P VAC as cue)

Note: The fit was singular.

FIGURE 10. Average delta p (VAC as cue) at each time point for each participant.
Bidirectional Association Strength
A LME model was run using Time to predict the mean strength of association score (bidirectional association strength) in the participant essays. The model did not identify a clear relationship between Time and strength of association score as measured by bidirectional association strength in the participant essays (p = .472, R2m < .001). A summary of the model can be found in Table 20. Figure 11 includes line plots for the bidirectional association strength scores for each participant at each collection point with the regression lines (indicated by the dashed line) produced by the model.
TABLE 20. LME model predicting mean strength of association score (collostructional strength)

Note: The fit was singular.

FIGURE 11 Average bidirectional association strength score at each time point for each participant.
RQ2 Discussion: VAC Sophistication Indices
Usage-based theories of language learning suggest that constructions that are frequently encountered and used will be easier to learn (and will be more likely to be produced) than those that are less frequently encountered and used. Further, verb-VAC combinations that are more strongly associated will also be easier to learn than those that are less strongly associated (e.g., Ellis & Ferreira-Junior, Reference Ellis and Ferreira-Junior2009). Less proficient learners may, however, produce less strongly associated verb-VAC combinations when they overgeneralize the use of verbs with newly learned VACs. A previous cross-sectional study based on holistic ratings of writing quality (Kyle & Crossley, Reference Kyle and Crossley2017) found that as holistic scores increased, the frequency of verb-VAC combination decreased, but strength of association scores increased. This preliminarily finding suggested that writers of higher-quality essays not only had a larger VAC repertoire but also had learned which verbs tend to co-occur with particular VACs (and vice versa).
This longitudinal study partially replicated the findings of the cross-sectional study of Kyle and Crossley (Reference Kyle and Crossley2017). Much like Kyle and Crossley (Reference Kyle and Crossley2017), a meaningful relationship was found between verb-VAC frequency and time spent studying English (R2m = .241, R2c = .241), suggesting that as the participants spent time learning English, they learned (and used) less frequent verb-VAC combinations, as would be expected by usage-based accounts. However, there are at least two points of departure between the results of the present study and the previous study. First, in the previous study, the strongest predictor of proficiency was the strength of association between a VAC and the verb that fills it (r = .251, R2 = .063). In this study, however, there was no meaningful relationship between any of the strength of association indices and time spent studying English. The most reasonable explanations may rest in the proficiency level of the participants in the current study, which were relatively low. As Verspoor et al. (Reference Verspoor, Schmid and Xu2012) showed in their cross-sectional study on the same learners, some linguistic constructions (such as simple sentences, dependent clauses, different types of chunks) seemed to develop at different rates and word frequency was a strong predictor of text score at all stages. However, longer collocational sequences such as fixed phrases, the use of particles, and compounds did not show significant increases until the end of the study (between stage 4 and 5). In other words, for these low-proficiency learners, early frequency effects are seen more strongly in isolated words than in groups of words, which would make sense as single words may be remembered more easily than combinations of words. Another potential explanation is that the method of measuring verb-VAC association strength (i.e., mean association strength score) may have obscured change that was taking place in specific VACs. It is possible that development occurred in particular VACs (e.g., double-object VACs), but not (or differently) in others. It may be useful, therefore, to look at the trajectories of individual VACs (much like some previous studies have done) instead of looking at mean scores (as has been common in studies of lexical sophistication and phraseology). Finally, if we consider the examples in Table 7, we can see that the most frequent VACs in the corpus are from a rather academic, formal written register. So, we may assume that these low-proficiency learners had not been exposed to these VACs yet, and this corpus may be more representative for advanced learners than young, low-proficiency learners. Each of these factors deserves further investigation that is beyond the scope of this article.
Second, unlike the previous cross-sectional study, there was a stronger relationship between Time and main verb frequency (R2m = .457, R2c = .467) than between the Time and verb-VAC frequency (R2m = .241). Further, there was no relationship between VAC frequency and Time, which preliminarily suggests that the variance accounted for by verb-VAC frequency may be attributable to main verb frequency. To investigate this hypothesis, post-hoc partial correlations were conducted using the ppcor package (Kim & Kim, Reference Kim and Kim2015) in R. The results, which are summarized in Table 21, indicate a moderate relationship (r = −.495) between Time and verb-VAC frequency. However, when we control for the influence of main verb frequency on the relationship between Time and verb-VAC frequency, the relationship between Time and verb-VAC frequency is negligible (r = −.029). Conversely, when we control for the influence of verb-VAC frequency on the relationship between Time and main verb frequency, the relationship between Time and main verb frequency is still meaningful (r = −.537). These results suggest that the learners in this study exhibited more sophisticated verb use, but otherwise did not exhibit changes in sophisticated verb-VAC use (at least as measured by mean frequency and strength of association scores).
TABLE 21. Correlations between VAC frequency, main verb frequency, and Time

RQ3 Results: Syntactic Complexity Versus VAC Sophistication Indices
To explore the degree to which syntactic complexity and VAC sophistication indices were complementary, we used both types of indices to predict the time point at which a text was produced (Time). However, we only selected those indices that showed unique meaningful relationships with Time in the previous analyses (DC/C and main-verb frequency).
The linear model with Time as the dependent variable reported significant main effects for both DC/C and main verb frequency with a large effect (p < .001, R2adjusted = .583). A summary of the model can be found in Table 22.
TABLE 22. Linear model predicting Time using DC/C and main verb frequency

a The relative importance of the indices in each model was calculated using the calc.relimp() function in the relaimpo package (Grömping, Reference Grömping2006). Specifically, the metric lmg (Lindeman et al., Reference Lindeman, Merenda and Gold1980), which takes into account both the direct relationship between the independent and dependent variable (i.e., the bivariate correlation) and the indirect relationship between the independent and dependent variable (i.e., the amount of variance explained when included in a multivariate model) was used.
RQ3 Discussion: Syntactic Complexity Versus VAC Sophistication Indices
The results indicated that main verb frequency and DC/C contributed to a model of development in a complementary manner. A linear model using dependent clauses per clause and main verb frequency to predict the time point at which an essay was produced (Time) accounted for 58.3% of the variance. A follow-up analysis for the relative importance of each index to the model indicated that main verb frequency and DC/C contributed to the model to a similar degree. As the participants in the study spent time studying English, they tended to use less frequent main verbs and more dependent clauses in their writing. This was in line with Verspoor et al.’s cross-sectional study (Reference Verspoor, Schmid and Xu2012) on similar learners as most frequent word types decreased across levels as determined by text scores.
CONCLUSION
This study investigates the degree to which indices of VAC sophistication, which previously were shown to be predictive of writing proficiency, can also be used to model language development over time. Most previous studies in the fields of SLA and SLW have measured syntactic development using indices of syntactic complexity such as MLT, MLC, and DC/C. Recently, the limitations of such indices have been pointed out (Biber et al., Reference Biber, Gray and Poonpon2011; Kyle & Crossley, Reference Kyle and Crossley2017; Norris & Ortega, Reference Norris and Ortega2009) including the difficulty of explaining findings in light of usage-based theories of SLA. Recently, Kyle and Crossley (Kyle, Reference Kyle2016; Kyle & Crossley, Reference Kyle and Crossley2017) developed VAC-based indices of sophistication that operate at a similar level of abstraction (e.g., the clause) as many measures of syntactic complexity but are in line with usage-based theories of language learning (Ellis, Reference Ellis2002; Ellis & Ferreira-Junior, Reference Ellis and Ferreira-Junior2009). In a cross-sectional study (Reference Kyle and Crossley2017), Kyle and Crossley found that the VAC indices were much stronger predictors of writing proficiency (as measured by holistic quality scores) than indices of syntactic complexity such as MLT, MLC, and DC/C. While Kyle and Crossley (Reference Kyle and Crossley2017) provided support for the use of VAC indices to predict holistic TOEFL scores, a large body of research has indicated that cross-sectional findings do not always align with developmental trajectories (Bestgen & Granger, Reference Bestgen and Granger2014; Bulté & Housen, Reference Bulté and Housen2014; Crossley & McNamara, Reference Crossley and McNamara2014; Lowie & Verspoor, Reference Lowie and Verspoor2019).
This study builds on Kyle and Crossley (Reference Kyle and Crossley2017) by investigating the degree to which indices of syntactic complexity and VAC sophistication can model changes in writing for adolescent EFL learners studying English over a 2-year period. These analyses indicated that holistic writing scores increased over the course of the study, suggesting that writing development occurred. Meaningful developmental trends were observed for two indices of syntactic complexity (MLT and DC/C) and for two VAC sophistication indices (main verb frequency and verb-VAC frequency). Follow-up analyses indicated that a single index of syntactic complexity (DC/C) and a single index related to VAC sophistication (main verb frequency) significantly contributed to a model of longitudinal development. As participants spent time studying English, they tended to use more dependent clauses (RQ1) and less frequent main verbs (RQ2). The former results support commonly observed trends in studies of L2 writing development (e.g., Byrnes, Reference Byrnes2009; Vyatkina, Reference Vyatkina2012) and some cross-sectional studies (Ortega, Reference Ortega2003; Verspoor et al., Reference Verspoor, Schmid and Xu2012). They differ, however, from the findings of Kyle and Crossley (Reference Kyle and Crossley2017), which found no meaningful relationship between DC/C and TOEFL holistic writing scores. The latter results are in line with previous work on lexical sophistication (e.g., Kyle & Crossley, Reference Kyle and Crossley2015) and generally support usage-based theories of language learning. However, no meaningful trend was observed between VAC frequency or verb-VAC strength of association or frequency measures and Time. This result counters expected usage-based accounts of language learning and previous studies that have indicated such relationships both longitudinally (e.g., Ellis & Ferreira-Junior, Reference Ellis and Ferreira-Junior2009) and cross-sectionally (Kyle & Crossley, Reference Kyle and Crossley2017), though this may have been due to the potential discrepancy between the input of the target learners in the present study and the written section of COCA, which was used to calculate VAC indices. Overall, the results of this study support the use of linguistic indices related to both clausal subordination (i.e., DC/C) and VAC use (i.e., main verb frequency) to model longitudinal development in lower proficiency L2 learners. Further research is needed to determine the degree to which age, educational context, instructional content, and register (among other factors) contributed to these findings (see limitations in the following text).
LIMITATIONS AND FUTURE DIRECTIONS
The current study had a number of limitations that future studies should address. First, the written sections (academic, fiction, magazine, and newspaper) of COCA may not have accurately represented the types of input that the participants were exposed to inside and outside of the classroom, which may affect the inferences drawn from the results. Relatedly, the learner corpus does not include information regarding what the participants were learning in their language classes (L1 or L2). If possible, future research should attempt to control for these issues. Second, although topic was controlled for at each collection point (i.e., all students wrote on the same topic during a particular collection point), topics changed at each successive collection point. While this choice was made to maintain ecological validity, it may have affected the results, though no obvious systematic differences were identified for particular prompts in the plots. Nonetheless, future studies should consider using a counterbalanced design as is possible. Third, in this study we attempted to fit linear models, which has been the norm in L2 studies for some time. However, this is not the only way to measure longitudinal development (e.g., de Bot et al., Reference Bot, Lowie, Thorne, Verspoor, Mayo, Mangado and Adrián2013; Larsen-Freeman & Cameron, Reference Larsen-Freeman and Cameron2008), and indeed the plots indicate that the data investigated in this study were not strictly linear. In future studies it would be fruitful to additionally investigate nonlinear and complementary developmental trends. Fourth, this study examined a small set of large-grained syntactic complexity indices and a small set of VAC features, but ignored other important features of development such as accuracy and fluency and other linguistic features such as lexical diversity, all of which may explain important variance in growth beyond syntactic complexity or sophistication features. This study examined a small number of students in a particular setting and a particular style of writing. To confirm the generalizability of the observed trends, replication studies are needed that represent a variety of learning contexts and language production types. Further, our study included relatively short texts (the mean essay length was approximately 182 words). To our knowledge, no study has attempted to identify the length of text needed to obtain a reliable score for indices of syntactic complexity or VAC sophistication. This is an important area for future research. A final potential limitation is the use of automated tools for the identification of linguistic features. The use of such tools enable large amounts of data to be analyzed (e.g., the 360-million-word section of COCA analyzed in this study) and identification accuracy has improved markedly over the past 10 years. However, identification accuracy is still less than perfect (ranging from 81.25% for L2 VACs to 97.0% for L2 main verbs), which introduces error into any downstream analysis. Future research should further investigate methods of increasing parsing and tagging accuracy on L2 texts (e.g., Meurers & Dickinson, Reference Meurers and Dickinson2017).
APPENDIX
HOLISTIC SCORING RUBRIC
The 0 represents the very beginning level where English is only barely emerging. There is usually very little text, and if there is text, it is mainly Dutch. Very simple sentence structure with many Dutch words and some English words thrown in, often misspelled.
The 1 represents English that has emerged to some degree. The language used is almost all English, with only a few Dutch words, but the language is simple, with mainly simple sentences, present tenses, often Dutch word order and Dutch expressions literally translated. Full of little errors.
The 2 represents English that has emerged. The English is still quite simple, simple sentence structure, simple tenses, an attempt at some creativity in vocabulary and syntax; the English may contain a Dutchism here and there, but it is mainly English. There are still many errors.
The 3 represents English that has emerged. The English is still quite simple with simple and compound sentences, but one or two dependent clauses may appear. There are mainly simple present and past tenses, but an occasional progressives or passive may appear. There is an attempt at some creativity in the vocabulary and syntax; even though the English still contains a few standard Dutchisms, there are also some authentic English collocations and expressions. There are still some errors.
The 4 represents English that has more variety in sentence structures (a few dependent clauses), some variety in tenses (past, future, progressive, passive, and use of modals). There are some authentic English collocations and expressions even though the English still contains a few standard Dutchisms. Some longer sentences, less choppy. There are still some errors, but mainly in mechanics and spelling.
The 5 represents English that has more variety in sentence structure (dependent clauses and nonfinite structures), variety in tenses (past, future, progressive, passive, and use of modals) where needed. There are several authentic English collocations and expressions, but there may also be a few standard Dutchisms. There are still some errors, but mainly in mechanics and spelling. The language flows.
The 6 represents English that has nativelike variety in sentence structure with dependent clauses and nonfinite structures, shows nativelike flexibility in time/tense/mood/voice. It contains many authentic English collocations and expressions, but there are still one or two Dutchisms. There are still some errors, but mainly in mechanics and spelling.
The 7 represents English that has a nativelike variety in sentence structure with dependent clauses and nonfinite structures, shows nativelike flexibility in time/tense/mood/voice. It contains mostly authentic English collocations and expressions, but there still be a Dutchism here and there. There are still some errors, but mainly in mechanics and spelling


