Introduction
Background
Throughout the United States, the 9-1-1 Emergency Medical Services (EMS) system is available to the public for unconditional use for a wide variety of medical complaints. While EMS systems vary in size and structure, they each must meet the needs of the population they serve. If a 9-1-1 system’s call volume and EMS transport utilization are recorded and analyzed over time, observed trends in utilization may be used to extrapolate future use of the EMS system. This may be a valuable tool for resource management.
Previous studies have described various trends in EMS utilization showing the increased use by specific groups, like the elderly or pediatric.Reference Platts-Mills, Leacock, Cabañas, Shofer and Mclean1–Reference Shah, Glushak and Karrison5 Predictions suggest that by the year 2030, the elderly will account for approximately one-half of EMS transports to US emergency departments (EDs).Reference Platts-Mills, Leacock, Cabañas, Shofer and Mclean1 One study, which retrospectively recorded population-based observations in the state of Kentucky, demonstrated that the overall rate of EMS transports was 51.7 (SD = 24.1) per 1,000 people per year. However, this rate varied between different communities. The EMS utilization was highest in those older than 65 (178.5 [SD = 84.2]/1,000/year), with the rate increasing exponentially with increasing age. A rising direct relationship between poverty level and EMS utilization was also observed. Additionally, the absence of 9-1-1 service and the absence of a hospital in the county were also associated with increasing rates of ambulance use.Reference Svenson6 Other studies have observed trends of utilization based on specific chief complaints, like chest pain, showing varying trends.Reference Brown, Mann and Daya7 Pediatric patients transported by EMS are more likely to have injuries and poisoning with higher acuity illnesses as compared to those arriving at the ED by other means.Reference Shah, Cushman, Davis, Bazarian, Auinger and Friedman3 Few studies have analyzed trends across an entire population,Reference Svenson6, Reference Munjal, Silverman and Freese8–Reference Pittet, Burnand, Yersin and Carron10 and at the time of this article, no studies have produced a population-based prediction model of future use in EMS systems.
In tiered EMS systems, such as in New Jersey, Basic Life Support (BLS) ambulances typically arrive before Advanced Life Support (ALS) due to a greater local presence of BLS squads. If a chief complaint or abnormal vital signs require ALS intervention, BLS will await ALS arrival for treatment and monitored transport to the hospital. The ALS units can be cancelled prior to arrival at the discretion of the BLS crew. Increasing ALS cancellation correlates with increased saturation of an ALS system. That is, more ALS units are cancelled when the system is busy because it is faster for BLS squads to transport directly to the hospital than to wait for ALS to arrive. This relationship has been repeatedly observed in the studied EMS agency and recorded at monthly medical advisory board (MAB) meetings. Therefore, the authors consider increasing ALS cancellations to be a measure of burden on this ALS system. In most EMS systems, anywhere between 20% and 30% of EMS calls result in no transport to the hospital at all.Reference Cushman and Cooney11
Goals of this Investigation
In this study, authors aimed to trend patterns of utilization in an EMS system which is the largest ALS provider in New Jersey – serving approximately 20% of the state population (Figure 1).12 This is to identify the needs of a growing population and to allow for a better understanding of how the EMS system is being used on a basis of call volume, EMS utilization, and frequency of ALS cancellation. Using this information, the authors aimed to develop a best-fitting prediction model (ie, best-fit for the distribution of data) that would show how the studied EMS system will be used in future years, while considering the projected growth of the served population. It is hypothesized that 9-1-1 call volume and overall ALS utilization per capita is increasing. Likewise, the metric “percent ALS cancellation” is increasing in the studied population. The authors planned to utilize available data in this large, two-tiered response system to assess demand for service, as well as to identify a best-fit model that will predict future utilization.

Figure 1. Highlight of All Counties in New Jersey Where the Studied EMS Agency Serves as the ALS Provider.
Methods
Study Design and Setting
A retrospective, cross-sectional, epidemiologic study of EMS system data was performed. The studied EMS system is a non-profit hospital cooperative comprised of 15 acute care hospitals which provides ALS services covering approximately 1,500 square miles in a catchment area with a population of approximately two million residents. Paramedics respond to a variety of rural, urban, and suburban communities (Figure 1). The EMS responders work in a two-tiered system, with paramedics providing ALS and emergency medical technicians (EMTs) providing BLS. The BLS squads typically arrive first on scene as they are greater in number and closer to calls in most areas.
When 9-1-1 is dialed and EMS is required, certain chief complaints activate a tiered response (both ALS and BLS) while others are solely BLS response. The BLS units are comprised of county, township, or private organizations depending on location. New Jersey requires every EMS agency (both ALS and BLS) to hold a “certificate of need” granted by the state for each city, county, or municipality. The studied agency maintained a certificate of need for the entire catchment area as the ALS provider during the entire study period. The BLS coverage by the agency, however, was variable and changed throughout the study period. For this reason, the authors chose to focus the study on ALS utilization and outcomes in addition to total 9-1-1 system utilization. Once on scene, a BLS unit can request paramedics (if ALS not previously activated) or cancel paramedics if ALS services are not required. The ALS providers currently respond to over 83,000 calls per year, and transport by ground and helicopter to 43 receiving hospitals. Online medical control is provided by adult and pediatric emergency physicians at a single hospital. All ALS patient contacts in New Jersey currently require contact with online medical control (an emergency physician) to discuss each patient encounter.
When an ambulance arrives on scene, there are generally four possible outcomes: (1) treatment and transport; (2) treatment and then patient refuses transport; (3) patient dead-on-arrival or resuscitation terminated; and (4) patient refuses medical assistance (RMA) and refuses transportation. Other options prior to EMS arrival include police cancellation of all EMS response, or BLS cancellation of ALS.Reference Cushman and Cooney11 In other words, a BLS service that can transport a patient may cancel the secondary ALS response when ALS arrival is delayed. This happens because it will likely be faster to transport a patient to the closest hospital rather than wait for an ALS response team. The decision for BLS to cancel ALS prior to arrival lies entirely on protocols established by individual BLS squad medical direction. This is variable between BLS organizations and not regulated by the state of New Jersey. Often, when ALS and BLS have arrived on scene (and after ALS evaluation), the patient can be triaged or “released” to BLS if no ALS services are required (after a discussion with medical command physician).
During the study period, there were no changes of operational protocols that would have affected the number of patients released to BLS, nor were there changes to operational protocols that would have affected outcomes of ALS dispatches or cancellation of ALS. Relevant clinical care guidelines did not change in the seven-year study period that might increase or decrease the proportion of patients transported.
Selection of Data
Systems data were extracted only using the electronic medical records of the EMS system (Rescue NET; Zoll; Chelmsford, Massachusetts USA) and the computer-assisted dispatch (CAD) database annually from 2010 through 2017. Quarterly data (Q1-Q4) were only available between 2013 and 2017. No individual patient data or patient information were accessed in the completion of this study; thus, it was deemed exempt by the institution’s Internal Review Board (IRB) from formal review (IRB protocol number: E2019.02). The studied CAD database is under supervision by the sponsoring institution and therefor included under the IRB federal registration. Call volume was recorded through an in-house 9-1-1 public service access point (dispatch center), which remained constant through the entire study period. All 9-1-1 calls in the study period were queried. If a 9-1-1 call required dispatch of both ALS and BLS services, it counted as one “call” towards the total 9-1-1 call volume. If only BLS was dispatched, it counted as one call towards the total call volume. Service area population was calculated using United States Census Bureau (Suitland, Maryland USA) data for each municipality included in the EMS system’s catchment area.12 For ALS services, the catchment area (square miles and boundaries) remained constant for the entire study period.
Study Variables
To calculate “9-1-1 calls per 1,000 people,” the total “call volume” extracted from the CAD database was divided by the service area population and multiplied by 1,000. The “ALS calls per 1,000 people” was calculated by dividing “total ALS calls” by the service area population and multiplied by 1,000. The ALS cancellation rate was determined by searching the CAD database for all ALS calls that were “cancelled en route” and “cancelled on scene.” This number was divided by “total ALS calls” to determine “percent ALS cancelled.” Each metric was calculated annually between 2010 and 2017. Quarterly metrics were calculated from 2013 to 2017, as quarterly data were not available before Q1 of 2013.
Statistical Analysis and Prediction Models
The cumulative frequency of 9-1-1 call volume and ALS call volume was equated to the New Jersey serviced population as rates per 1,000 people. The ALS cancellation rate was reported as percent cancelled of all ALS calls. Temporal trends were generated using only quarterly data (Figure 2, 3, and 4; 2013–2017) to account for variation and to better predict future trends. This quarterly model was expected to be non-linear and account for seasonable variation. The analysis for this study was generated using SAS software (2016; SAS Institute Inc.; Cary, North Carolina USA).

Figure 2. Demonstration of an Increasing Trend in 9-1-1 Utilization by the Study Population.
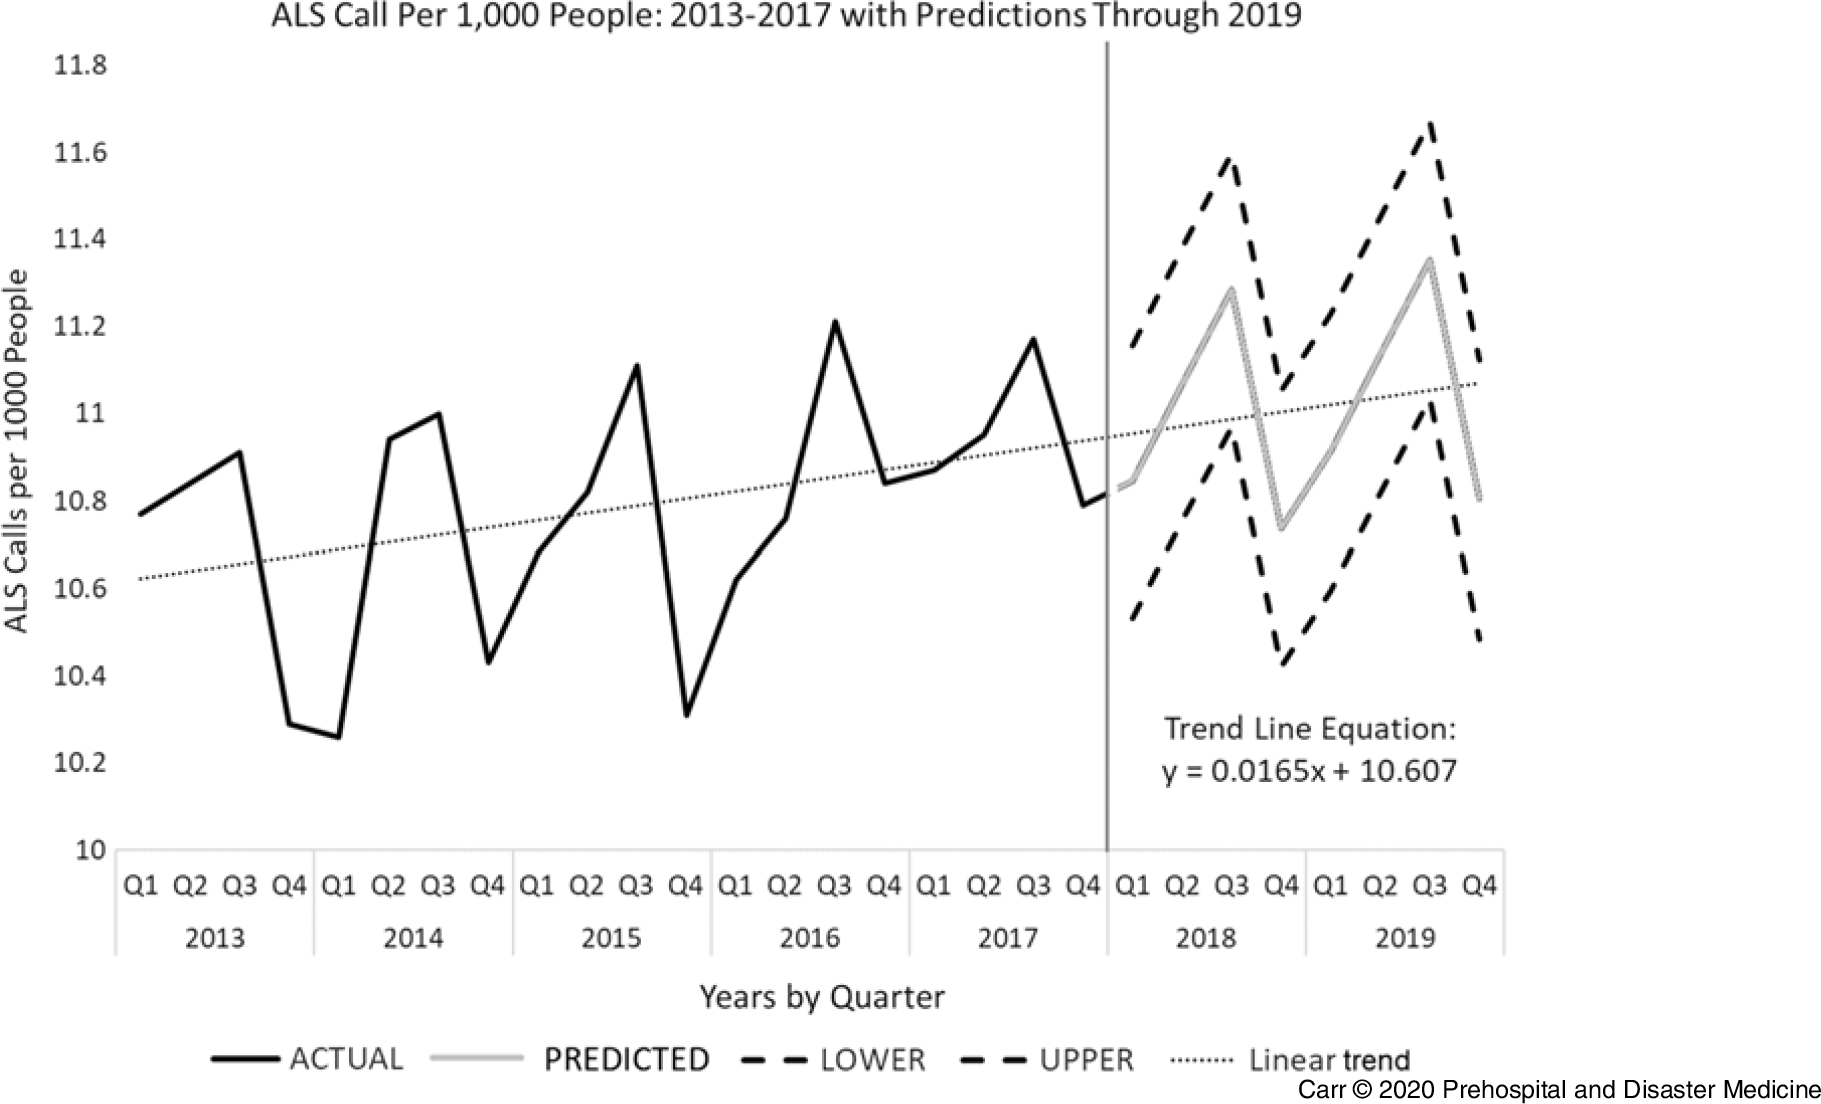
Figure 3. Demonstration of an Increasing Trend in ALS Calls per Capita within the Study Population.

Figure 4. Demonstration of an Increasing Temporal Trend of Percentage ALS Cancellations Prior to Arrival on Scene.
The five best-fitting models were analyzed, including linear, damp trend exponential smoothing, Winter’s approach, Additive Winter’s approach, and seasonality to ascertain which best fit the data. These models were judged on R-squared (R2) values, and Akaike Information Criterion (AIC) values where the lowest AIC values between models predicts the best model. The R2 is called the Coefficient of Determination, which reports how the proportion of the dependent variable (ie, call volume) changes with the independent variable (year). Authors chose the best model that accounted for all variation based on AIC and R2. For each prediction, the best model was consistently the Additive Winter’s model. Additionally, this model has low margin of error values to produce more narrow confidence intervals compared to other models.
The benefit of using SAS is that most of the variation in temporal trends is captured to predict what it will be in the future. It also allows for analysis of numerous models at the same time. The Additive Winter’s model was chosen because it has the best numbers in terms of AIC and R2 values. The best-fitting approach uses specific distribution algorithms to interpret the seasonal fluctuation of data. Using this information, it allows for higher R2 and AIC values, thus making a more robust model allowing for statistical confidence in measurements. Other models show similar trends, but with less significance. The Additive Winter’s model is objectively the most powerful, but it takes a considerable amount of time to compile data due to the large number of data points required to generate a trend. Another option considered was simple linear regression using Microsoft Excel (Microsoft Corp.; Redmond, Washington USA). The Centers of Medicare and Medicaid Services (CMS; Woodlawn, Maryland USA) has previously used linear regression with extrapolation to predict utilization and expenditures among differing variables.13 The limitation of using a linear prediction model is that it assumes all trends and input variables are remaining constant. In other words, Excel uses the first predicted values to predict subsequent values – this narrows margin of error and decreases confidence interval width as more years are predicted. In the end, Additive Winter’s approach proved to be the best choice.
Results
The total number of 9-1-1 calls from within the catchment area of the studied EMS system from 2010 through 2017 was 817,561. The captured population of the catchment area from 2010 through 2017 increased by 25,960 people (+1.37%) with an annual average increase by 0.19% (Table 1).
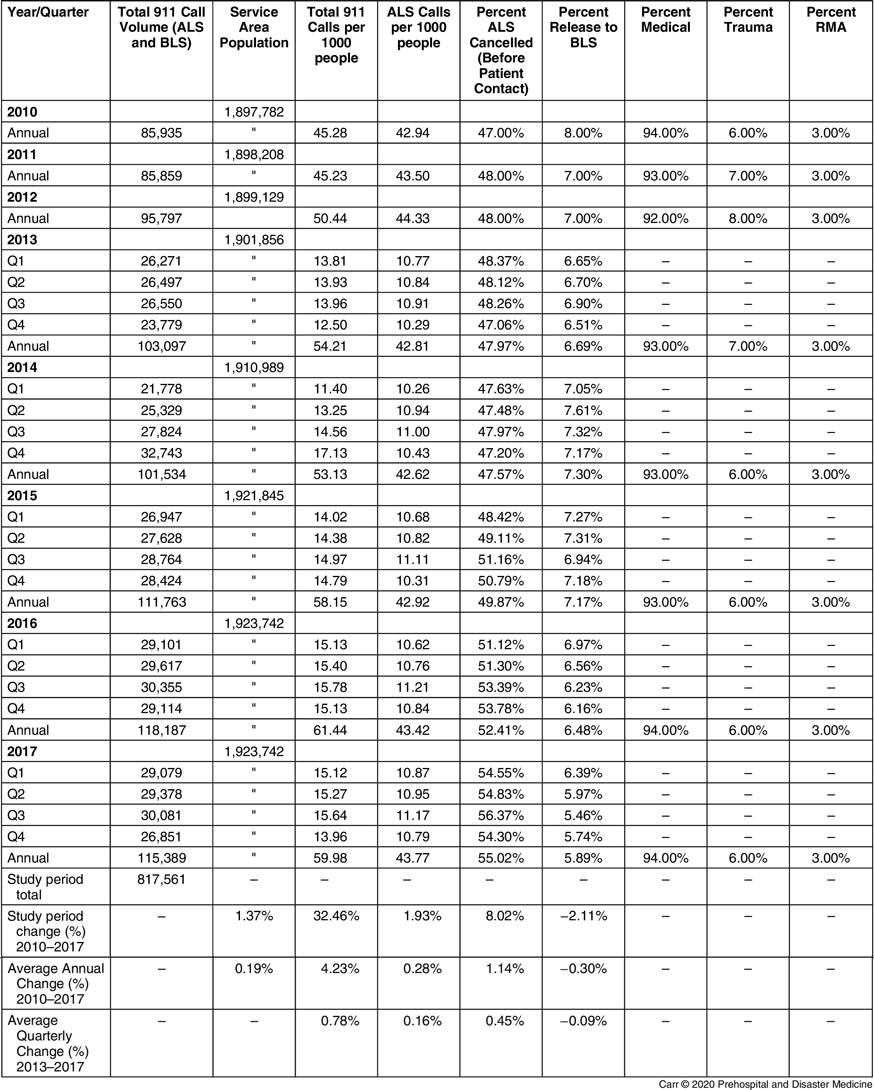
Table 1. Table Showing EMS System Call Volume and Utilization from 2010 through 2017 with Quarterly Data Presented from 2013 through 2017

Note: Annual service area population is also shown. 9-1-1 call utilization and ALS utilization rates are shown as per 1,000 people. Rate of ALS cancellation, rate of RMA, and medical/trauma are presented as percent.
Abbreviations: ALS, Advanced Life Support; EMS, Emergency Medical Services; RMA, refused medical assistance.
The 9-1-1 call volume per capita (both ALS and BLS) increased by 32.46% between 2010 and 2017 from 45.28 to 59.98 per 1,000 people, respectively (Table 1). That was an average annual increase of 4.23%. There was a 15.60% increase in 9-1-1 call volume per capita between 2013 and 2017 using the quarterly data line equation generated, y = 0.1041x + 13.389 (Figure 2). That was an average quarterly increase of 0.78% per quarter (Table 1).
All ALS calls per capita increased by 1.93% from 2010 to 2017 with an average annual increase of 0.28%. When looking at quarterly data, there was a 3.11% increase between 2013 and 2017 with an average quarterly increase of 0.16% per quarter (Table 1).
Percent ALS cancelled by BLS before patient contact increased from 47.00% to 55.02% (8.02% change) with an average annual increase of 1.14%. The quarterly data from 2013 to 2017 showed an average increase of 0.45% per quarter (Table 1).
The percent of patients who were released to BLS after ALS triage fell from 8.00% to 5.89% in the study period. That was an average annual decline of 0.30%. Quarterly data between 2013 and 2017 showed an average quarterly decrease of 0.09% (Table 1).
The percent of patients who RMA remained constant at three percent over the entire study period. The distribution of medical to trauma patients remained approximately ninety-four percent to six percent, respectively, with minimal variation across the study period. Quarterly data (Q1-Q1) were not available for RMA and medical/trauma distribution metrics – only annual data were recorded.
Based on the Additive Winter’s prediction of 9-1-1 call volume extending from Q1 of 2018 to Q4 of 2019, there would be a 95% chance that call volume will increase from 15.07 to 16.28 calls per 1,000 people – an 8.03% increase over two years (Figure 2).
As there was obvious variability in utilization between quarters with regards to ALS calls per capita, the Additive Winter’s prediction model predicted that ALS call volume per capita will continue to be variable. In other words, ALS utilization will increase and decrease in 2019 with seasonal variation and 95% confidence (Figure 3).
Further, the Additive Winter’s approach predicted with 95% confidence that ALS cancellation will increase after the study period ends. Percent ALS cancellation will increase from 55.28% to 57.53% between Q1 of 2018 and Q4 of 2019. That would be a 2.25% increase in ALS cancellation in the forecasted time period.
Discussion
This study analyzed trends in 9-1-1 and EMS utilization of a diverse population of almost two million people in the state of New Jersey. There was an overwhelming increase in 9-1-1 utilization, as demonstrated in Figure 2 and Table 1. When adjusting for population growth, there was a congruent increase in utilization increasing from 45 calls per 1,000 people to 60 calls per 1,000 people; that is a 32.49% growth over the seven-year study period. This demonstrates a dramatic increase in utilization, which is consistent with recent publications that demonstrated a potential risk for strain on existing 9-1-1 systems.Reference Cannuscio, Davis, Kermis, Khan, Dupuis and Taylor14
One preliminary hypothesis of the increasing use of the 9-1-1 system was based on the principle that there has been a subsequent increased use of EDs on a national level. When reviewing the Centers for Disease Control and Prevention’s (CDC; Atlanta, Georgia USA) Chartbook on Long-Term Trends in Health, data indicate the per capita and gross annual ED volume has been increasing in the period between 1997 and 2015. During 1997, an estimated 94.9 million visits were made to hospital EDs in the United States, approximately 35.6 visits per 100 people. In 2015, an estimated 136.9 million visits were made to hospital EDs, approximately 43.3 visits per 100 people.15 These findings are congruent with the demonstrated 9-1-1 system utilization increase. The 9-1-1 usage increase may also be related to a changing age distribution, proportionally favoring an elderly population who calls 9-1-1 more frequently.
A major focus of the data is that ALS cancellation prior to arrival is increasing, and the study authors consider this to be a measure of the impact of burden on this EMS system. Other studies have measured other metrics as a burden related to increasing call volume – the most popular being EMS response time.Reference Wolbrom, Rahman and Hilton16–Reference Wei lam, Zhang and Oh19 Response time has been liberally used as a process indicator to assess EMS performance internationally. It is quantifiable, objective, and easily comprehended by the public and policymakers. However, its correlation to better patient outcomes has yet to be reliably established.Reference Al-shaqsi18 One retrospective study determined that annual call volume increases lead to longer response times, and that they are likely directly correlated to one another.Reference Wolbrom, Rahman and Hilton16 Another large systematic review of Utah EMS data estimates a strong relationship between response time and mortality, but it did not reach statistical significance. Higher response times did lead to a statistically higher probability of hospital admission.Reference Wilde17 The difficulty with establishing “increasing EMS response times” as a reproducible measure of system burden is that no two EMS systems are alike. That is, EMS systems are intricately structured and funded with overlapping participation of municipalities, private organizations, and hospitals; they also maintain varying ratios of paid and volunteer responders. Until there is a national unification of these factors, no one indicator of performance or burden can be applicable to another system. This is the first study that suggests increasing rate of ALS cancellation as a measure of burden on EMS systems. It should only apply to agencies with similar structure, regionality, and regulation. In the absence of written medical protocols, ALS cancellation may vary significantly between different organizations.Reference Yeh and Cone20
This EMS agency has noticed an increase in ALS cancellation on days when the system is saturated. The ALS cancellations directly increasing with call volume is routinely reported at monthly MAB meetings. This study pioneers the metric of ALS cancellations as a measure of burden in tiered ALS/BLS response systems. As such, these data inform practice and planning for the future of the studied EMS agency.
One study surveyed systems where BLS agencies can cancel ALS prior to arrival. In this study, a survey was mailed to the physician medical directors of EMS agencies in 125 of the largest US cities. The survey requested information on policies governing cancellation of responding ALS units. Ninety-four cities (75% of all cities contacted) responded to the survey. The authors found that fewer than one-half of the surveyed EMS systems that permit non-ALS personnel to cancel responding ALS units use written protocols to direct these decisions. Of these, only one-half utilize specific medical criteria to guide cancellation. Medical oversight of these cancellations is highly variable.Reference Yeh and Cone20 According to the survey, many major cities experience ALS cancellation by non-ALS personnel, which supports the utilization as a potential marker for increased burden.
Finally, there is a decreasing rate of “release to BLS” in the study period. These data were not entered in the Additive Winter’s prediction model. The percent of patients released to BLS after ALS triage falls from 8.00% to 5.89% in the study period. In other words, fewer patients are being released to a BLS for transport to the hospital. The ALS providers are required to remain with the patient until ED department hand-off is given. This means that ALS units are increasingly unavailable to respond to pending 9-1-1 calls. One article by Eckstein, et al discusses how ALS crews are detained in hospitals for longer periods due to the escalating problem of over-saturated hospital beds and ED over-crowding – waiting to transfer care to ED staff.Reference Eckstein, Isaacs and Slovis21 The subsequent detention of EMS crews creates severe risks for delayed EMS responses to impending critical cases.
Limitations
While this study did account for the growth of the residential population in the EMS system’s catchment area, there was no adjusting for changes in commuter populations or tourism. In the study period, it is unlikely that there was variation in daily commuting to business districts, but these data were not available. Furthermore, various sections of the studied service area may be impacted by seasonal influx of large quantities of people, such as to the New Jersey beaches in the summer. In 2017, there were almost 100 million tourist visitors to the State of New Jersey, which may have affected annual call volume. Additionally, in February 2014, Super Bowl XLVIII took place at MetLife Stadium (East Rutherford, New Jersey USA), which may have impacted Q1 data for 2014.22
There was no available information on the age distribution of the EMS calls. Previous studies have demonstrated that different age groups call EMS at different rates.Reference Platts-Mills, Leacock, Cabañas, Shofer and Mclean1–Reference Wrigley, George, Smith, Snooks, Glasper and Thomas9 Unfortunately, with the EMS system database, it is impossible to link age distribution to the total number of calls. This would require opening each individual call chart to document demographic information. It is also unclear if New Jersey’s age distribution is changing based on US census data. This is because age distributions are only reported on 2010, 2014, and 2016 census summaries.12 Townships of New Jersey inconsistently reported age distribution data on an annual basis. As mentioned previously, an aging population will call 9-1-1 more frequently.Reference Platts-Mills, Leacock, Cabañas, Shofer and Mclean1, Reference Gerson and Shvarch4, Reference Shah, Glushak and Karrison5, Reference Brown, Mann and Daya7 The demonstrated increase in 9-1-1 call volume could be because the New Jersey residential population is aging. The findings of this study can only be assessed on a “macro” level and cannot be used to identify regional growth or growth in demand by specific populations.
Additionally, this study focuses on a tiered EMS system where there is a dual response from ALS and BLS. Most US EMS systems do not have such an elaborate system as New Jersey. The necessity of a dual response seems directly related to state or municipality legislature requiring all ALS treatments to have two paramedics (thus forcing a separate ALS and BLS response unit). New Jersey and Delaware currently mandate two paramedics to staff each ALS unit, but do not require ALS units capable of transporting patients. Massachusetts, Wisconsin, and Utah laws require two paramedics to a call, but do not require the paramedics to be on the same unit. Arizona’s requirements for the crew varies depending on whether the ambulance services a rural or wilderness area.Reference Robbins, Merlin and Shotwell23 Some local governments and agencies usually enforce staffing requirements that exceed the state requirements and may staff ambulances with two or more paramedics – this will trigger a separate ALS and BLS response.Reference Robbins, Merlin and Shotwell23
It stands to reason that EMS utilization may plateau at some point. The presented model in this study assumes EMS utilization will always increase. There is likely a ceiling effect where this model could predict poorly if there is a major change in utilization because of policy change (ie, all 9-1-1 callers get pre-determined bill for every time the EMS system is activated, regardless of outcome).
As most EMS systems may not have access to SAS software (likely due to cost), it is important to comment on the use of this model within other statistical software. For instance, JMP Pro 14 (JMP, Version 14; SAS Institute Inc.; Cary, North Carolina USA; 1989–2019) can perform Winter’s forecasting method by selecting “Statistical Index” and scrolling to “Winter’s Method.” Also, Minitab 17 or Minitab 19 (Version 17/19 Statistical Software; Minitab; State College, Pennsylvania USA; 2010) has this feature directly within the “stat” drop down menu. “R – The R Project for Statistical Computing” (R Foundation for Statistical Computing; Vienna, Austria; 2003) is a free statistical software and the Winter’s seasonality capturing model is demonstrated in an accompanying website.Reference Hyndman and Athanasopoulos24
Conclusion
If the current system remains in place, this prediction model reliably predicts increasing 9-1-1 call volume, ALS utilization, as well as ALS cancellation prior to arrival up to end of 2019 (with 95% confidence; Figure 2, 3, and 4). With these trends and best-fitting models of prediction, an overwhelming increased use of (and increased burden on) the studied 9-1-1 EMS response system is projected. This prediction model assumes that there are no major population shifts or demographic changes in the studied population. There is an urgent need for change and innovation to mitigate this increasing burden. Hopefully, other EMS systems can use this model to project utilization, predict allocation of resources, and identify similar measures of over-utilization.
Acknowledgements
The authors wish to thank administrative and clinical support staff at Monmouth-Ocean Hospital Service Corporation EMS (Wall Township, Neptune, New Jersey USA) for their assistance with acquiring system data. They also wish to thank all EMTs and paramedics who continuously work to meet the needs of the served population.
Conflicts of interest
All authors have no disclosures or conflicts of interest.