Introduction
The oil palm species Elaeis guineensis Jacq. originates along the coast of the Gulf of Guinea in Western and Central Africa, but its exact site of origin in Central Africa has not been pinpointed. Some authors have suggested that the centre of origin is Nigeria or Cameroon (Corley and Tinker, Reference Corley and Tinker2003). The expansion of oil palm cultivation began in Africa and South-East Asia during the colonial period due to its multiple industrial and food uses (Corley and Tinker, Reference Corley and Tinker2003). Since that time, oil palm has become one of the world's main sources of vegetable oils, with a production of 43.6 million tons of oil in 2010, accounting for 26.65% of the world's production of edible oils (FAOSTAT, 2010). Most of the commercially produced oil palm seed is tenera material derived from the cross Deli dura× AVROS pisifera. However, the low level of diversity in the populations of Deli dura (Kularatne et al., Reference Kularatne, Shah and Rajanaidu2001) could limit oil productivity (Dumortier, Reference Dumortier2003). The growing global demand for palm oil has created the need to incorporate new sources of African genes from different origins. In this way, variability can be increased in order to develop palms with superior agronomic qualities (Corley and Tinker, Reference Corley and Tinker2003). The majority of seed production programmes are based on the selection of dura (thick-shelled) genotypes as the female parent and pisifera (shell-less) genotypes as the pollen parent. This selection is performed through the evaluation of the selected breeding parents using progeny testing of crosses involving parents dura and pisiferas selected for high oil yield following the reciprocal recurrent selection method (Gascon and Berchoux, Reference Gascon and de Berchoux1964) or the family and individual selection method (Hardon, Reference Hardon1970). Studies of diversity and the resources involved in breeding programmes have allowed different researchers to propose new strategies for the efficient selection of parental lines (Billotte et al., Reference Billotte, Risterucci, Barcelos, Noyer, Amblard and Baurens2001; Mayes et al., Reference Mayes, Jack and Corley2000; Purba et al., Reference Purba, Noyer, Baudouin, Perrier, Hamon and Lagoda2000; Kularatne and Rajanaidu, Reference Kularatne, Shah and Rajanaidu2001; Hayati et al., Reference Hayati, Wickneswari, Maizura and Rajanaidu2004; Norziha et al., Reference Norziha, Rafii, Maizura and Ghizan2008; Singh et al., Reference Singh, Mohd, Ting, Rosli, Tan, Leslie, Ithnin and Cheah2008; Cochard et al., Reference Cochard, Adon, Rekima, Billotte, Desmier de Chenon, Koutou, Nouy, Omoré, Purba, Glazsmann and Noyer2009). Today, molecular markers are a useful technique to select genetically distant individuals. Microsatellite markers or simple sequence repeats (SSR) offer advantages with respect to other molecular markers. The SSR include co-dominance, multi-alleles and high level of polymorphic information, which, together with their high abundance and random distribution within the genome, make them a valuable tool for studying genetic diversity between closely related cultivars (Kalia et al., Reference Kalia, Rai, Kalia, Singh and Dhawan2011). The aim of this study was to molecularly characterize oil palm (E. guineensis Jacq.) progenies from different origins using microsatellite markers in order to assess their genetic diversity and provide important information to optimize their use. In this way, families could be chosen to ensure that maximum genetic divergence is incorporated in breeding programmes.
Materials and methods
Plant material
In this study, 193 samples of pre-bred material, represented by 23 families (progenies), were analysed. The resulting palms from controlled pollinated crosses between individuals of different origins are presented in Table 2. The term ‘origin’ refers to the geographical regions where the E. guineensis material was maintained, including the Democratic Republic of the Congo, Ekona, Djongo, Mongana, Yangambi and Brabanta, which were described previously by Corley and Tinker (Reference Corley and Tinker2003), Corley and Castro (Reference Corley and Castro2004) and Castro and Corley (Reference Castro and Corley2007).
DNA extraction and amplification of microsatellite markers
Genomic DNA was extracted from young leaves using a Qiagen extraction kit (Ref. 69 106) following the manufacturer's instructions. DNA quality was evaluated on a 0.8% agarose gel and then quantified by spectrophotometry. The DNA of each sample was diluted to a concentration of 5 ng/μl for use in the amplification reaction of each microsatellite. A total of 20 microsatellite markers were selected and evaluated. According to their location within the genome, these markers are at independent loci and have been mapped to 14 of the 16 linkage groups (Billotte et al., Reference Billotte, Risterucci, Barcelos, Noyer, Amblard and Baurens2001, Reference Billotte, Marseillac, Risterucci, Adon, Brottier, Baurens, Singh, Herrán, Asmady, Billot, Amblard, Durand-Gasselin, Courtois, Asmono, Cheah, Rohde, Ritter and Charrier2005; Singh et al., Reference Singh, Mohd, Ting, Rosli, Tan, Leslie, Ithnin and Cheah2008). The amplification conditions for each marker were in accordance with those reported by the authors. To visualize the amplification product, a 6% denaturing polyacrylamide gel, 5 M urea and silver nitrate staining were used.
Data analysis
Using the algorithms in the FSTAT software (Goudet, Reference Goudet2002), for each locus, the following genetic diversity parameters were calculated: allelic frequencies; total number of alleles; allelic richness (R a) (calculated as the total number of alleles present in the population at a given locus). It also included the average polymorphic information content (PIC), a parameter used to measure the informativeness of each genetic marker, which is calculated from allelic frequencies. The following parameters were considered to estimate the genetic diversity of each family: (1) the average number of alleles per locus (A); (2) the number of effective alleles per locus (A e), which is defined as the number of alleles that can be present in a family; (3) the observed heterozygosity (H o), which is a parameter used to quantify the number of heterozygous genotypes; (4) unbiased expected heterozygosity (H e), which was obtained according to Nei's (Reference Nei1978) procedure. This information was obtained using the algorithms included in the GenAlEx 6.1 software (Peakall and Smouse, Reference Peakall and Smouse2006). To determine the genetic differentiation among the families, Nei's (Reference Nei1987) diversity indices and statistical indices F (F ST, F IS) according to Weir and Cockerham (Reference Weir and Cockerham1984), including confidence intervals, were calculated using the FSTAT software (Goudet, Reference Goudet2002). An analysis of molecular variance (AMOVA) was conducted between and within families using Arlequin (Excoffier and Heckel, Reference Excoffier and Heckel2006). The matrix of the genetic distance between families was generated according to the definition by Nei (Reference Nei1972). The dendrogram was generated from the distance genetic matrix and the UPGMA (unweighted pair-group mean arithmetic average) clustering method using the NTSYS pc 2.11L software (Rohlf, Reference Rohlf2000). For the statistical values reported per group, 1000 bootstrap replicates were used in the DARwin5 software (Perrier and Jacquemoud-Collet, Reference Perrier and Jacquemoud-Collet2006). A principal coordinate analysis (PCoA) was carried out using the algorithms included in the GENALEX software (Peakall and Smouse, Reference Peakall and Smouse2006).
Results
Allelic diversity
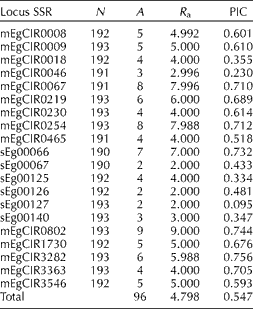
A total of 96 alleles were obtained in the 193 evaluated samples (Table 1). The number of alleles per locus ranged from 2 to 9. The loci mEgCIR0067, mEgCIR0254, sEg00066, mEgCIR0802 and mEgCIR3282 had the highest number of alleles and thus the highest allelic richness. Also, these loci showed a maximum value of PIC; therefore, these loci are highly informative. The loci sEg00067, sEg00126 and sEg00127 had the lowest number of alleles (A= 2), the lowest allelic richness (R a= 2.000) and a minimum value of PIC, suggesting that these loci were least informative.
Table 1 Number of alleles and polymorphic information content (PIC) for the 20 loci
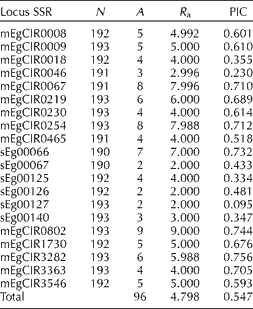
SSR: simple sequence repeats; N: number of evaluated individuals per locus; A: number of detected alleles per locus; R a: allelic richness.
Genetic diversity of oil palm E. guineensis within each family
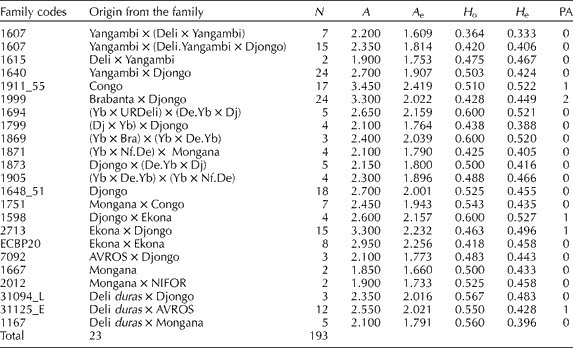
The diversity parameters that were evaluated in the different families are presented in Table 2, where the average number of alleles per locus (A) within each family ranged from 1.850 to 3.450. The family from Congo had the maximum number of alleles (A= 3.450) and the family from Mongana had the minimum number of alleles (A= 1.850). In most of the families, the effective number of alleles (A e) was close to the observed number of alleles (A), indicating an absence of the rare alleles. On the other hand, the families from Congo, Brabanta × Djongo, Djongo × Ekona, Ekona × Djongo and Deli dura× AVROS showed differences between A and A e. These differences indicate that there are some alleles with low frequency or rare alleles.
Table 2 Genetic diversity parameters in Elaeis guineensis from different families
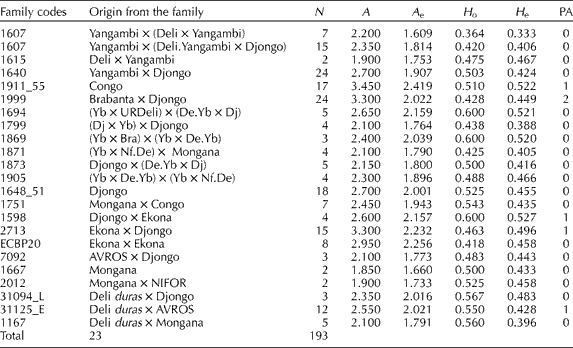
N: number of evaluated individuals per family; A: average number of alleles; A e: effective number of alleles; H o: observed heterozygosity; H e: Nei's (Reference Nei1978) expected heterozygosity; PA: number of private alleles.
When comparing the observed and expected heterozygosity, the observed heterozygosity value was higher in all of the progenies. This was expected due to the fact that the study was conducted on progenies from parents of different geographical regions. The families from Congo, Brabanta × Djongo, Djongo × Ekona, Ekona × Djongo and Deli dura× AVROS showed alleles that were found only in each one of these families, and so were defined as private alleles (Table 2). However, it is necessary to note that these parameters were directly related to the size of the sample. Therefore a larger number of samples for each family are needed to confirm these results.
Genetic differentiation between families
The parameters of diversity and genetic differentiation according to Nei (Reference Nei1987) and F statistics (Weir and Cockerham, Reference Weir and Cockerham1984) among families are given in Table 3. According to Laurentin (Reference Laurentin2009), the parameters of genetic differentiation between and within the families may be applied regardless of the number of alleles per locus or the evolutionary forces. The total genetic diversity was H T= 0.557. The average genetic diversity among subgroups (D ST; Table 3) was 0.115 among the families, reflecting greater variability among the families. The genetic differentiation coefficient (G ST; Table 3) was 0.207, and its corresponding F ST statistic was 0.174 with a confidence interval of 0.149 to 0.198, suggesting genetic differentiation among the 23 assessed families. This conclusion was in accord with the results of AMOVA, which showed highly significant differences with a partitioning of 17% genetic diversity (heterozygosity) among the families (Table 4). The fixation index values, G IS and its corresponding F IS statistic were negative, indicating an excess of heterozygotes. The F IS was within a confidence interval of − 0.171 to − 0.000; however, the values of G IS were not statistically significant.
Table 3 Diversity and genetic differentiation coefficients (Nei, Reference Nei1987) and F statistics (Weir and Cockerham, Reference Weir and Cockerham1984) among families

H o: average of the observed genetic diversity; H s: average of the genetic diversity among groups; D ST: average genetic diversity among subgroups; H T: total genetic diversity; G ST: genetic differentiation coefficient; G IS: endogamy coefficient; CI: confidence interval.
***Values are significantly different (P< 0.001).
Table 4 Analysis of molecular variance

*** P< 0.001.
Genetic relationships
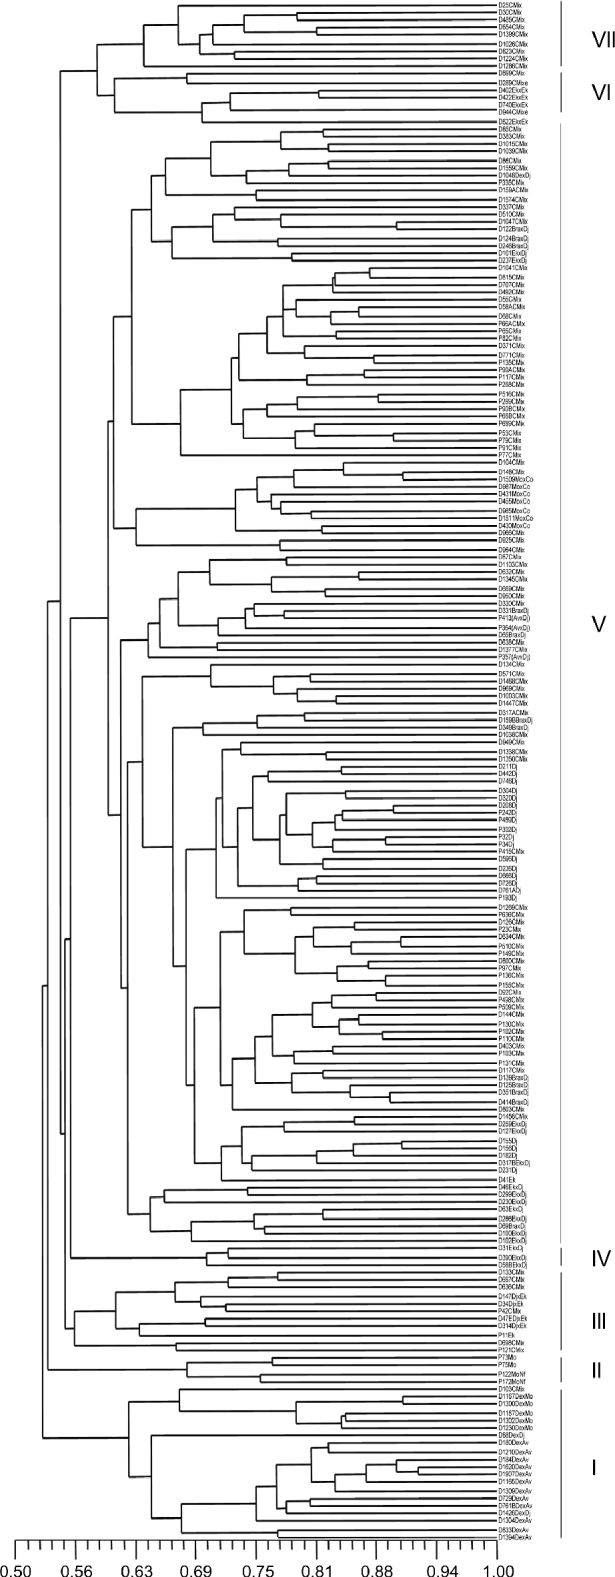
The dendrogram obtained by applying the UPGMA algorithm (Fig. 1) and taking individuals as the unit of analysis allowed to identify seven groups with statistical support based on bootstrap values greater than 50. Deli dura× AVROS, Deli dura× Mongana and Deli × Djongo origins shared the same group (I). This indicates a genetic closeness among them and an apparent reflection of Deli but different from the other African origins. Group II contained cultivars of Mongana and Mongana × Nifor origin. These were pisifera-type palms belonging to 2012 and 1667 codes, which differed from the other groups. Group III was made up of cultivars of Djongo × Ekona origin, one pisifera palm of Ekona origin and some palms of Congo Mix origin. Group IV was made up of three palms of Ekona × Djongo origin, code 2713, which clearly differed genetically from the other crossing codes of the same origin in group V. Group V was the largest group, which was made up of closely related cultivars as they shared at least one parent of Djongo origin, as shown in the genealogy reported by Castro and Corley (Reference Castro and Corley2007) that included Congo Mix, Djongo, AVROS × Djongo, Brabanta × Djongo, Mongana × Congo and Ekona × Djongo. Group VI was made up of cultivars of Ekona × Ekona origin. Group VII comprised mostly of cultivars of Congo Mix origin, code 1871, with a common parent of NIFOR origin. The Congo Mix origin included different crossing codes. That is why it was distributed in different groups.
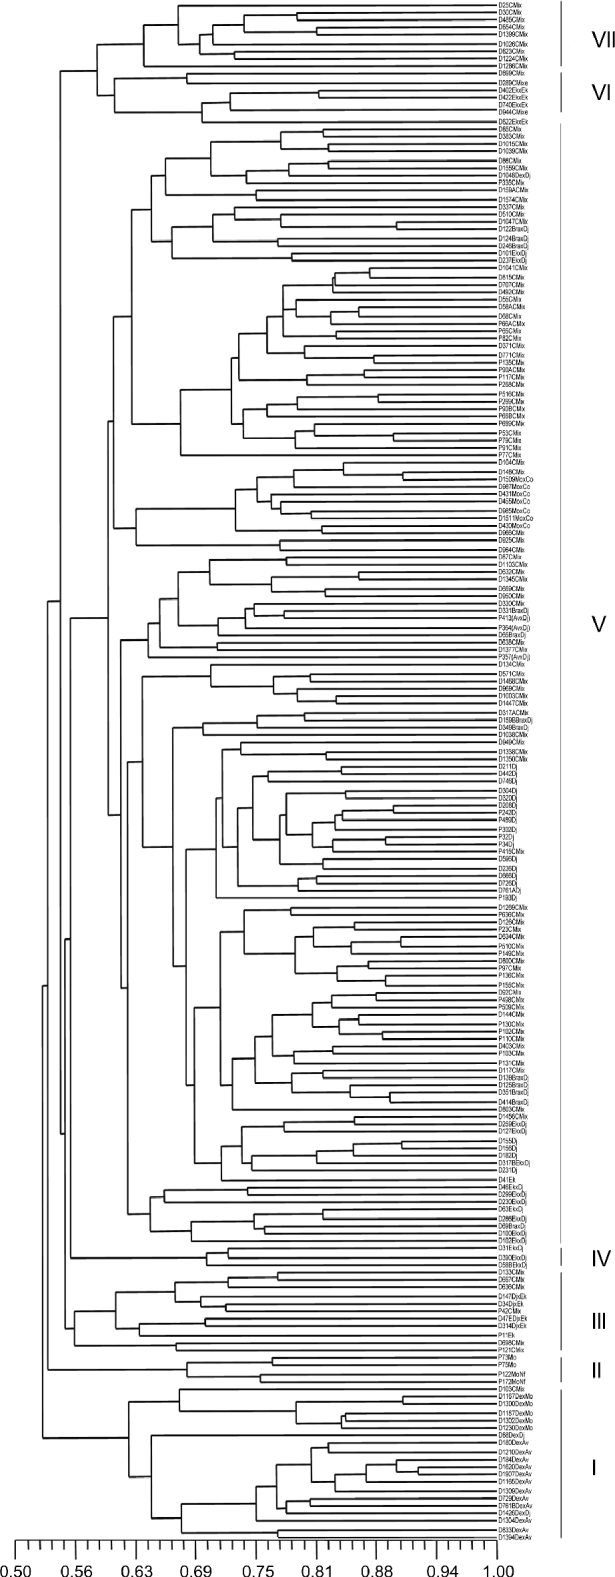
Fig. 1 Dendrogram obtained from the Nei and Li (Reference Nei and Li1979) genetic similarity matrix, using the UPGMA (unweighted pair-group mean arithmetic average) grouping method for oil palm materials from different origins.
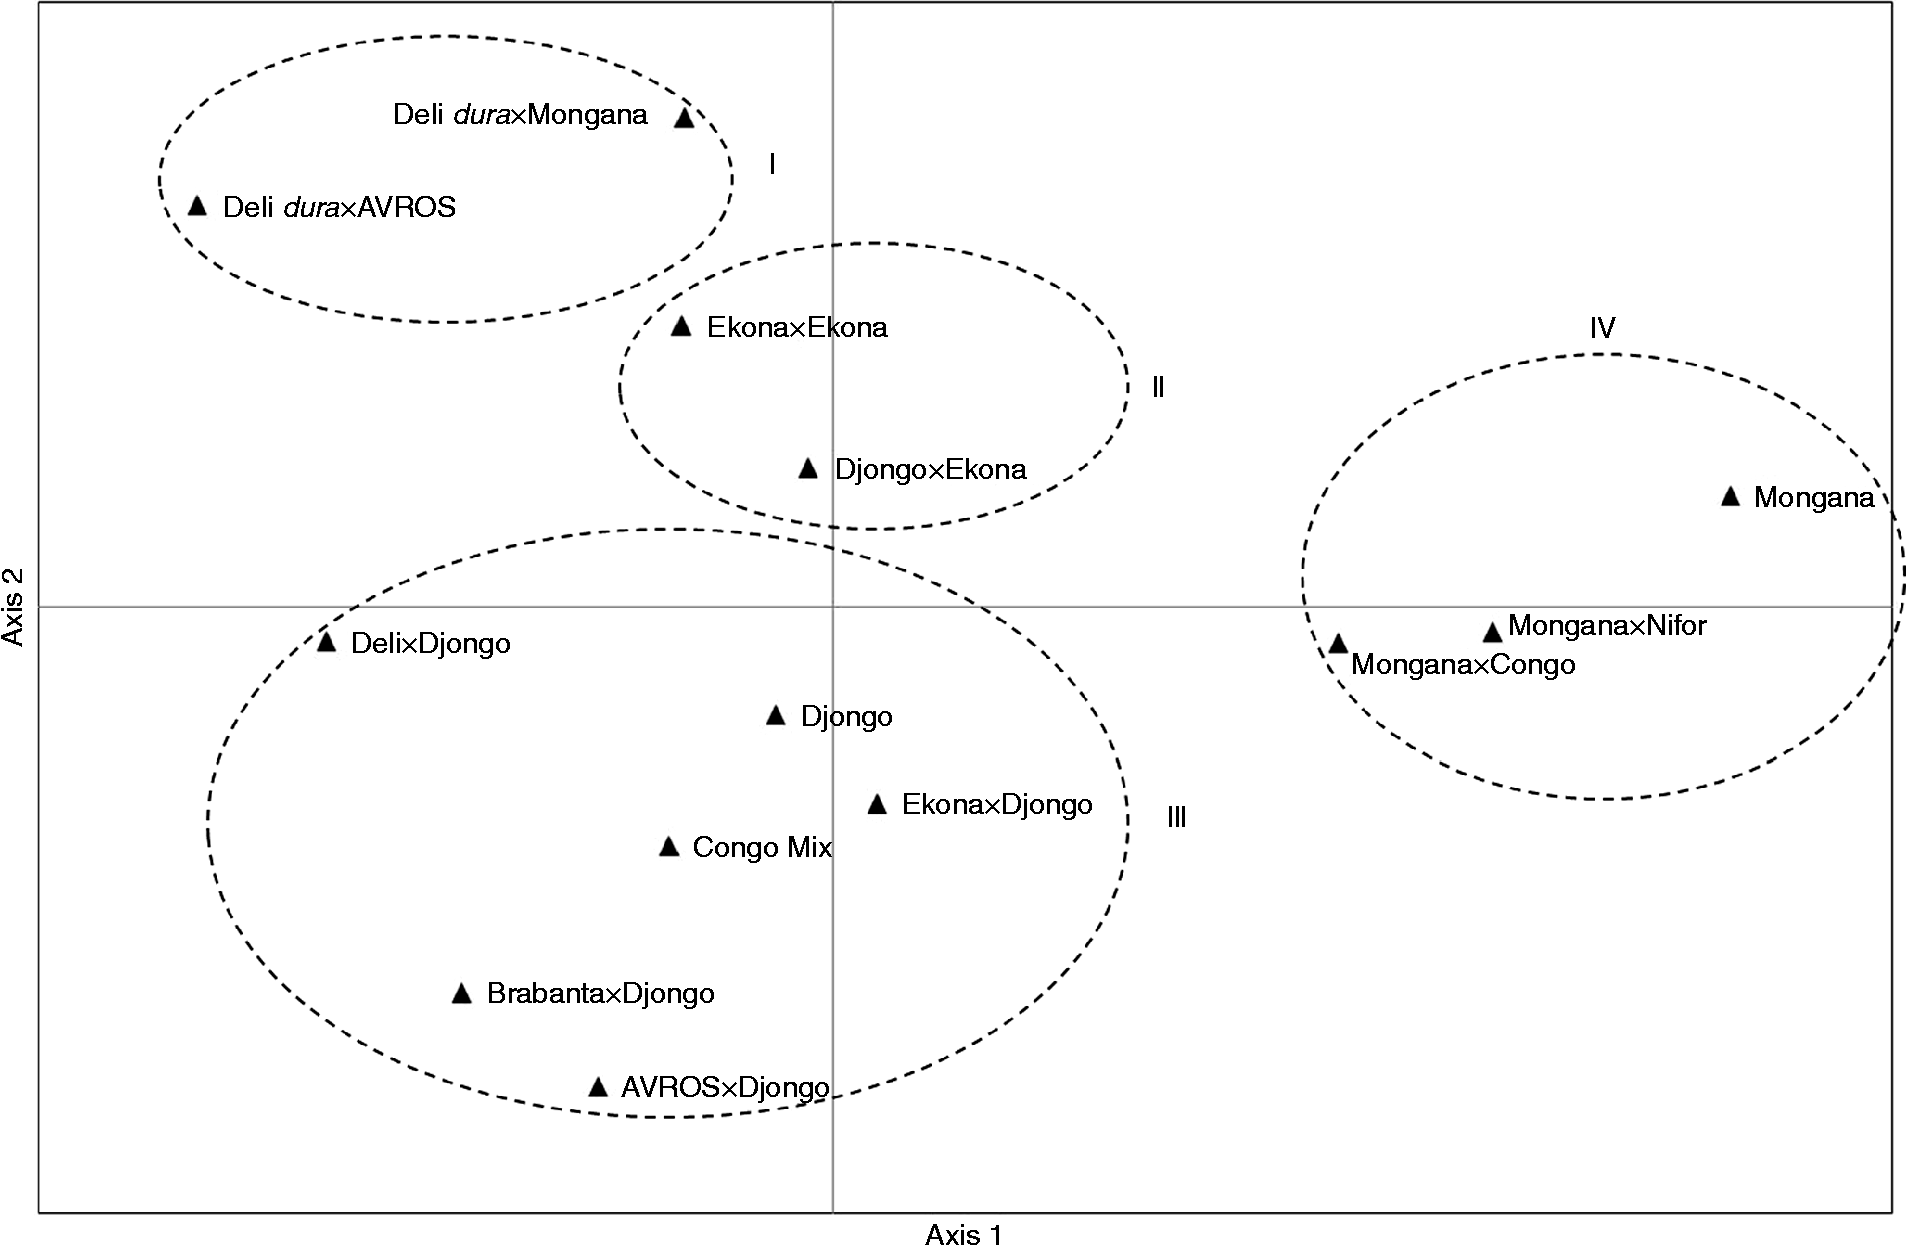
In the PCoA, the first two coordinates explained 65% of the total variation (the first one explained 38% and the second one 27%). Four groups were visible in these two coordinates (Fig. 2). Group I was made up of Deli dura× AVROS and Deli dura× Mongana origins. Group II was made up of origins Ekona × Ekona and Djongo × Ekona. Group III was represented mostly by accessions from Djongo. Group IV comprised mostly of progenies from Mongana.
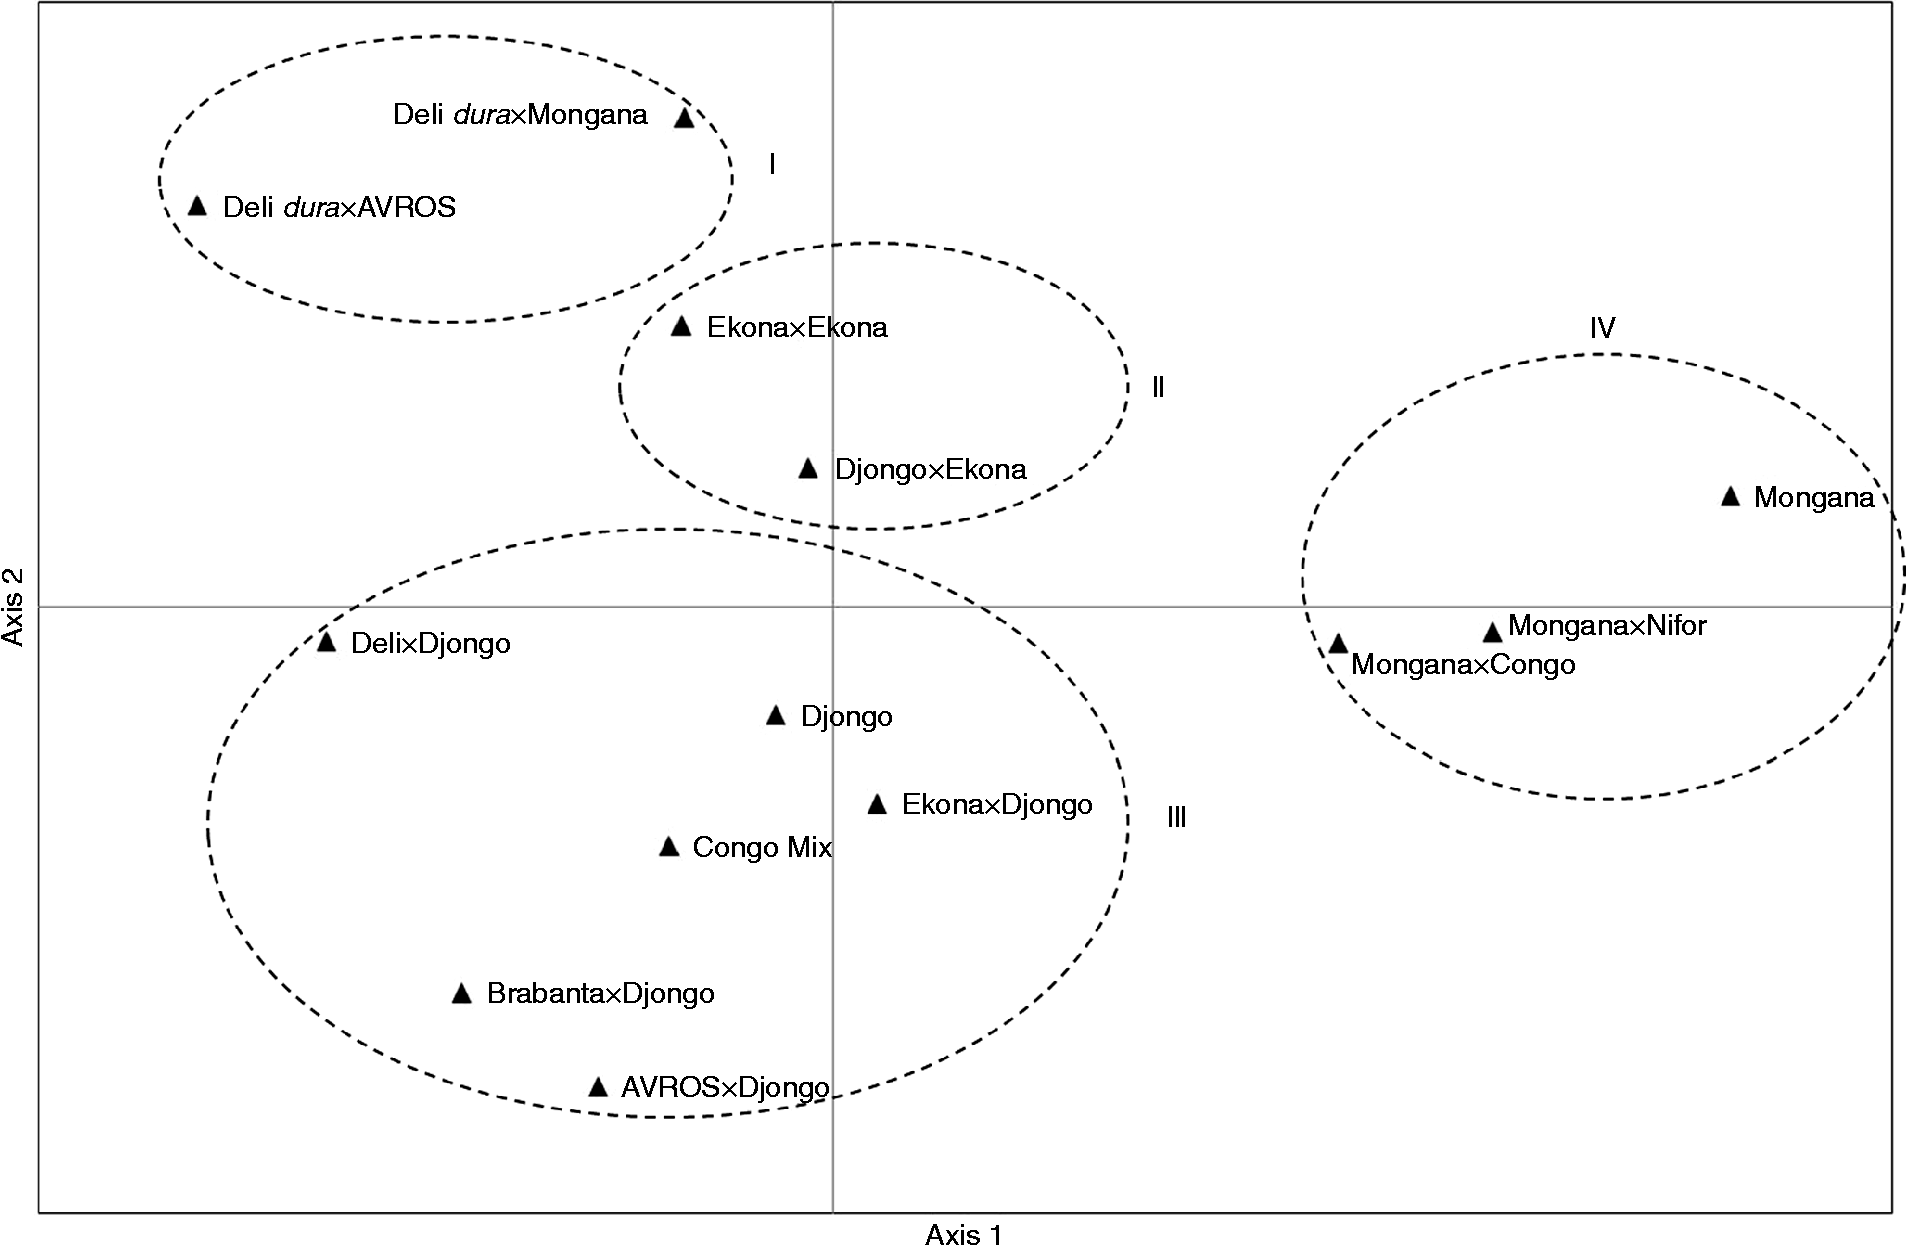
Fig. 2 Principal coordinate analysis based on 20 simple sequence repeats of oil palm Elaeis guineensis Jacq. families from different origins.
Discussion
The microsatellite markers used in this study made it possible to distinguish between closely related cultivars, and these markers were generally highly informative with regard to heterozygosity compared with other types of molecular markers used in the oil palm. For instance, for the African origins, the value of expected heterozygosity with the amplified fragment length polymorphism (AFLP) technique was never below 0.65, while with isozymes, the expected heterozygosity values varied between 0.1 and 0.5 (Purba et al., Reference Purba, Noyer, Baudouin, Perrier, Hamon and Lagoda2000; Hayati et al., Reference Hayati, Wickneswari, Maizura and Rajanaidu2004). In restriction fragment length polymorphism (RFLP) and AFLP analyses performed in E. guineensis accessions, the value of expected heterozygosity was under 0.135 (Barcelos et al., Reference Barcelos, Amblard, Berthaud and Seguin2002). In the RFLP study, with 359 accessions of oil palm originating from 11 African countries, the value of expected heterozygosity was under 0.25 (Maizura et al., Reference Maizura, Rajanaidu, Zakri and Cheah2006).
In most of the progenies evaluated, the observed heterozygosity value was higher than expected, reflecting a high proportion of heterozygous genotypes within each family. Moreover, the fixation index values, G IS and its corresponding F IS statistic were negative, indicating an excess of heterozygotes in the evaluated progenies. The coefficients (G ST= 0.207 and F ST= 0.174) and the AMOVA used in this study show that there is genetic differentiation among some of the evaluated families, which was reflected in the groups obtained by the dendrogram and principal coordinate analyses. This difference could be due to some of the families being enriched with germplasm from different origins through controlled pollinated crosses. The PCoA showed more defined groups, which is in agreement with the parent they descended from based on the pedigree used in a pre-breeding programme. The groupings of progenies into one cluster suggest that the families were sampled from the same source of genetic stock. The palms of group I contained material derived from the four palms planted in the Bogor Botanical Gardens in 1848 that derived from Deli dura populations, which still form the major basis for the dura oil palm germplasm in South-East Asia. According to Rosenquist (Reference Rosenquist1986), the Deli dura type is generally considered a breeding population of restricted origin, which is the basis of various oil palm breeding programmes around the world and results from selection through many generations (Corley and Tinker, Reference Corley and Tinker2003). In addition, the families of group I were genetically distant with respect to other progenies. This result is consistent with the results obtained by Cochard et al. (Reference Cochard, Adon, Rekima, Billotte, Desmier de Chenon, Koutou, Nouy, Omoré, Purba, Glazsmann and Noyer2009) who found a strong genetic differentiation (G ST= 0.231) between Deli cultivars (Indonesia) versus cultivars of African origin (Zaire). At the phenotypic level, Ooi (Reference Ooi1975) found that the cross between Deli dura and an unrelated Congo origin increases the additive genetic variance for the number of bunches and average bunch weight, increasing the oil yield potential. The advantages of Deli dura× Djongo with 7.5 tons of oil/ha/year and Deli dura× Mongana with 6.8 ton/ha/year have been observed in field tests in the Colombian municipality of Cumaral, Meta (Castro and Corley, Reference Castro and Corley2007). This agronomic value has been confirmed under Indonesian conditions, where yields of approximately 7.2 tons of oil/ha/year have been reported for this type of cross (Durand-Gasselin et al., Reference Durand-Gasselin, Kouamé, Cochard, Adon and Amblard2000). The parents of group II probably came originally from palms from a village called Lisombe in Cameroon, characterized by having thin-shelled fruits; for this reason, the term lisombe became a synonym for tenera. One of the first plantations in Cameroon was established in the state of Ikassa around 1919, from seeds of these palms (Corley and Tinker, Reference Corley and Tinker2003); these palms exhibited very good bunch composition, an agronomic potential that has been demonstrated under Colombian conditions, where the Ekona × Ekona origin has recorded yields of 7.3 tons of oil/ha/year. The origins that made up group III came mostly from the famous Djongo palm, which was used to establish one of the first plantations in Palmeraie de la Rive at Yangambi in Zaire in 1922. Beirnaert (Reference Beirnaert1933) described in greater detail the selection work carried out in Congo, which was basically focused on practical and theoretical production issues. An important feature that makes this origin particularly different is the fruit which is elongated and ovoid shaped, with a thin shell, kernel located towards the centre and the mesocarp portion in the basal part of the fruit (Corley and Tinker, Reference Corley and Tinker2003). The best lines were established in Binga, a plantation that included a former substation of Yangambi, which led to the development of the Binga breeding programme that also included cultivars of Brabanta and Mongana origin, among others (Hardon et al., 1976; Rosenquist 1986 cited by Corley and Tinker, Reference Corley and Tinker2003). Thanks to the introgression of other origins, the potential of these cultivars has increased considerably as evidenced by production data from Brabanta × Djongo crosses, with 7.6 tons of oil/ha/year in field tests in the Colombian municipality of Cumaral, Meta (Castro and Corley, Reference Castro and Corley2007).
It is important to highlight that palms of group IV are primarily pisifera type from Mongana origins and were the most genetically distant. One of the important objectives of this study was to identify genetic differentiation between the different origins for their use inside breeding programmes. The cost of maintaining oil palm pre-bred material is extremely high. Therefore, the genetic relationships estimated from the molecular data suggest that it could be convenient to select the families more distant from each group and the palms more distant from each family selected to reserve genetic variability in few accessions. Subsequently, the new gene pool can be used into the base population of the first generation of breeding. This information will guide us in the decision-making process when planning breeding programmes focused on crosses to develop new populations with an acceptable broad genetic base and adaptability. In this way, sources of resistance to biotic and abiotic factors can be identified for the development of new varieties with competitive advantages for the sector. Moreover, it would be convenient to identify agronomic traits, such as bunch position in the crown, or yield components such as the percentage of the mesocarp/fruit to obtain new genetic material with a high yield potential.
Acknowledgements
The authors thank Dr R.H.V. Corley and Dr E. Rosenquist for designing the crosses and planning the breeding programme. The authors also thank the Breeding and Seed Production Program of Unipalma S.A. for permission to publish the results.


