


Visual attention shapes learning, self-regulation, and behavior (Morales, Fu, & Pérez-Edgar, Reference Morales, Fu and Pérez-Edgar2016; Posner & Rothbart, Reference Posner and Rothbart2007). Affect-biased attention emerges relatively early in development (Leppänen & Nelson, Reference Leppänen and Nelson2012) and is characterized by automatic attentional prioritization based on a stimulus’ relative affective and motivational salience to the individual (Ehlers & Todd, Reference Ehlers and Todd2017; Todd, Cunningham, Anderson, & Thompson, Reference Todd, Cunningham, Anderson and Thompson2012). It also plays a role in emotion regulation (Todd et al., Reference Todd, Cunningham, Anderson and Thompson2012; White, Helfinstein, Reeb-Sutherland, Degnan, & Fox, Reference White, Helfinstein, Reeb-Sutherland, Degnan and Fox2009), impacting voluntary and involuntary processes that modulate emotional experiences in order to serve one's goals (Thompson, Reference Thompson1994). Affect-biased attention is shaped by the individual's past experience and current emotional and motivational state and can, over time, influence individuals’ experience of the social world by creating a habitual filter that canalizes perception, emotional response, and behavior (Morales, Fu, et al., Reference Morales, Fu and Pérez-Edgar2016; Todd et al., Reference Todd, Cunningham, Anderson and Thompson2012). Attention bias (AB) toward perceived threatening stimuli, subserved by both automatic (bottom-up) and regulatory (top-down) processes, is a tractable form of emotion dysregulation that may increase risk for psychopathology (Jazaieri, Morrison, Goldin, & Gross, Reference Jazaieri, Morrison, Goldin and Gross2015; Tone, Garn, & Pine, Reference Tone, Garn, Pine and Cicchetti2016). The present study implemented reaction time (RT), and stationary and ambulatory eye-tracking measures of threat-related attention in 5- to 7-year-old children. We aimed to illustrate that multimodal eye-tracking assessments can enhance our understanding of how AB is a form of emotion dysregulation that contributes to increased vulnerability for socioemotional maladjustment.
Attention Plays a Role in Emotion Regulation During Development
Posner's neurobehavioral model of attention is composed of three interdependent components: alerting, orienting, and executive attention (Rothbart, Sheese, Rueda, & Posner, Reference Rothbart, Sheese, Rueda and Posner2011; Petersen & Posner, Reference Petersen and Posner2012). During infancy, attentional control is largely involuntary and dominated by the orienting network (Rothbart et al., Reference Rothbart, Sheese, Rueda and Posner2011). The executive network begins to play a larger role as the prefrontal cortex matures across childhood and adolescence (Eisenberg, Spinrad, & Eggum, Reference Eisenberg, Spinrad and Eggum2010; Posner, Rothbart, Sheese, & Voelker, Reference Posner, Rothbart, Sheese and Voelker2014). Attention and other emotion regulation processes share overlapping frontolimbic circuitries involving bidirectional influences from both bottom-up subcortical structures like the amygdala and ventral striatum and top-down prefrontal regions encompassing the orbitofrontal cortex, anterior cingulate, and ventrolateral, dorsolateral, and ventromedial prefrontal cortices (Beauchaine & Zisner, Reference Beauchaine and Zisner2017; Corbetta & Shulman, Reference Corbetta and Shulman2002). Aberrant activation and connectivity in the frontolimbic circuitries are linked to AB to threat (Bishop, Reference Bishop2008), emotion dysregulation (Hilt, Hanson, & Pollak, Reference Hilt, Hanson, Pollak, Brown and Prinstein2011), and psychopathology (Sylvester et al., Reference Sylvester, Corbetta, Raichle, Rodebaugh, Schlaggar, Sheline and Lenze2012).
Threat-related AB Is Associated With Anxiety Dysregulation
Affect-biased attention serves as a means of engaging with emotionally provocative stimuli while also regulating emotional experiences (Gross, Reference Gross1998; Todd et al., Reference Todd, Cunningham, Anderson and Thompson2012). However, attention deployment can also lead to patterns of emotion dysregulation that propagate and amplify maladaptive behavior (Tone et al., Reference Tone, Garn, Pine and Cicchetti2016). Emotion dysregulation, marked by avoidance of fear-eliciting stimuli, prevents the development of more adaptive emotion regulation strategies, such as reappraisal or extinction (Jazaieri et al., Reference Jazaieri, Morrison, Goldin and Gross2015). Avoidance is a hallmark symptom of anxiety disorders (Aldao, Nolen-Hoeksema, & Schweizer, Reference Aldao, Nolen-Hoeksema and Schweizer2010), and AB to threat has been linked to anxiety in both children and adults (Bar-Haim, Lamy, Pergamin, Bakermans-Kranenburg, & van IJzendoorn, Reference Bar-Haim, Lamy, Pergamin, Bakermans-Kranenburg and van IJzendoorn2007; Dudeney, Sharpe, & Hunt, Reference Dudeney, Sharpe and Hunt2015; Roy, Dennis, & Warner, Reference Roy, Dennis and Warner2015).
The dot-probe task is commonly used to index AB in anxiety. This task presents pairs of faces. In each trial, one face is affectively salient (e.g., threat) and one is neutral. The face pair is followed by a probe (e.g., an asterisk) that appears in the same location as the affective face (congruent trials) or in the same location as the neutral face (incongruent trials). AB is quantified by subtracting RTs in the congruent trials from RTs in the incongruent trials. A positive score indicates more rapid attention deployment toward the affective face, whereas a negative score indicates bias away from the threat (Abend, Pine, & Bar-Haim, Reference Abend, Pine and Bar-Haim2014). At the neural level, dot-probe studies have found that high trait anxiety or anxiety disorders are associated with perturbations in both subcortical regions associated with orienting and in prefrontal networks subserving emotion regulation. That is, anxious youth display overactive amygdala, and altered activation in the ventrolateral prefrontal cortex, dorsolateral prefrontal cortex, and anterior cingulate (for reviews, see Blackford & Pine, Reference Blackford and Pine2012; Sylvester & Pine, Reference Sylvester, Pine, Pérez-Edgar and Fox2018). While correlational evidence suggests that AB to threat may be related to deficient anxiety regulation (Tone et al., Reference Tone, Garn, Pine and Cicchetti2016), it is not clear how AB contributes to the onset and development of anxiety dysregulation.
Threat-Related AB Increases the Risk for Anxiety and Broad Socioemotional Problems
Studying threat-related AB in children at risk for anxiety is important for understanding the role of AB in the emergence of anxiety dysregulation (Shechner et al., Reference Shechner, Britton, Pérez-Edgar, Bar-Haim, Ernst, Fox and Pine2012). Behavioral inhibition (BI) is a biologically based temperament characterized by heightened vigilance and overreactivity to novelty in infancy (Kagan, Reznick, Clarke, Snidman, & Garcia-Coll, Reference Kagan, Reznick, Clarke, Snidman and Garcia-Coll1984). BI is conceptualized as a qualitatively distinct profile relative to non-BI children (Fox, Snidman, Haas, Degnan, & Kagan, Reference Fox, Snidman, Haas, Degnan and Kagan2015). In childhood, stable BI across time often manifests as social withdrawal (SW; Fox, Henderson, Rubin, Calkins, & Schmidt, Reference Fox, Henderson, Rubin, Calkins and Schmidt2001), which in turn is associated with further elevation in risk for developing internalizing symptoms by adolescence and young adulthood (Prior, Smart, Sanson, & Oberklaid, Reference Prior, Smart, Sanson and Oberklaid2000; Rubin, Coplan, & Bowker, Reference Rubin, Coplan and Bowker2009). Despite being the most robust individual difference predictor of anxiety (reviewed in Pérez-Edgar & Guyer, Reference Pérez-Edgar and Guyer2014), the majority of BI children do not develop clinical anxiety (Degnan et al., Reference Degnan, Almas, Henderson, Hane, Walker and Fox2014; Degnan & Fox, Reference Degnan and Fox2007). Differential patterns of emotion regulation and dysregulation, including patterns of AB, may be an important cofactor that accounts for this multifinality. When BI co-occurs with threat-related AB, longitudinal studies have revealed a strong relation with the development of childhood SW and anxiety (Morales, Pérez-Edgar, & Buss, Reference Morales, Pérez-Edgar and Buss2015; Nozadi et al., Reference Nozadi, Troller-Renfree, White, Frenkel, Degnan, Bar-Haim and Fox2016; Pérez-Edgar et al., Reference Pérez-Edgar, Bar-Haim, McDermott, Chronis-Tuscano, Pine and Fox2010, Reference Pérez-Edgar, Reeb-Sutherland, McDermott, White, Henderson, Degnan and Fox2011; White et al., Reference White, Degnan, Henderson, Pérez-Edgar, Walker, Shechner and Fox2017).
In addition to the RT studies suggesting threat-related AB underlies the link between BI and anxiety, a number of neuroimaging studies (for reviews, see Blackford, Clauss, & Benningfield, Reference Blackford, Clauss, Benningfield, Pérez-Edgar and Fox2018; Sylvester & Pine, Reference Sylvester, Pine, Pérez-Edgar and Fox2018) suggest that BI is characterized by hyperreactivity in the amygdala-based system underlying threat detection (Kagan, Reference Kagan, Zentner and Shiner2012). Individual differences in threat responsiveness may relate to enhanced orienting driven by bottom-up processes (e.g., Schwartz, Wright, Shin, Kagan, & Rauch, Reference Schwartz, Wright, Shin, Kagan and Rauch2003). Hyperactive automatic attention processes may impede development of neural networks that support adaptive strategies, including executive attention (Fu, Taber-Thomas, & Pérez-Edgar, Reference Fu, Taber-Thomas and Pérez-Edgar2017; Hardee et al., Reference Hardee, Benson, Bar-Haim, Mogg, Bradley, Chen and Pérez-Edgar2013), fear regulation, and appraisal (Clauss, Benningfield, Rao, & Blackford, Reference Clauss, Benningfield, Rao and Blackford2016; Shechner et al., Reference Shechner, Fox, Mash, Jarcho, Chen, Leibenluft and Britton2018). Over time, these regulatory systems may become less efficient and flexible (Henderson, Pine, & Fox, Reference Henderson, Pine and Fox2015; Henderson & Wilson, Reference Henderson and Wilson2017), resulting in an entrenched and habitual pattern of maladaptive emotion regulation (Morales, Fu, et al., Reference Morales, Fu and Pérez-Edgar2016; Pérez-Edgar, Reference Pérez-Edgar, Pérez-Edgar and Fox2018).
Multimodal Approaches Facilitate the Delineation of Attention Patterns
Although some studies have found that BI children showed AB toward threat using RT measures (Pérez-Edgar et al., Reference Pérez-Edgar, Bar-Haim, McDermott, Chronis-Tuscano, Pine and Fox2010; Szpunar & Young, Reference Szpunar and Young2012), and these are consistent with the neuroimaging literature indicating threat hyperreactivity in subcortical structures, the literature is far from consistent. For example, Morales et al. (Reference Morales, Pérez-Edgar and Buss2015) found that children characterized with dysregulated fear, another fearful temperament profile, displayed AB away from threat. The majority of the studies have found no zero-order correlation between BI and RT measures of AB (Broeren, Muris, Bouwmeester, Field, & Voerman, Reference Broeren, Muris, Bouwmeester, Field and Voerman2011; Cole, Zapp, Fettig, & Pérez-Edgar, Reference Cole, Zapp, Fettig and Pérez-Edgar2016; Pérez-Edgar et al., Reference Pérez-Edgar, Reeb-Sutherland, McDermott, White, Henderson, Degnan and Fox2011; Vervoort et al., Reference Vervoort, Wolters, Hogendoorn, Prins, de Haan, Boer and Hartman2011; White et al., Reference White, Degnan, Henderson, Pérez-Edgar, Walker, Shechner and Fox2017), even when group differences in neural activations underlying attention processes toward the same stimuli are evident (e.g., Auday, Taber-Thomas, & Pérez-Edgar, Reference Auday, Taber-Thomas and Pérez-Edgar2018; Fu et al., Reference Fu, Taber-Thomas and Pérez-Edgar2017; Hardee et al., Reference Hardee, Benson, Bar-Haim, Mogg, Bradley, Chen and Pérez-Edgar2013). Moreover, studies also failed to find zero-order correlations between AB measures and SW levels (Cole et al., Reference Cole, Zapp, Fettig and Pérez-Edgar2016; Morales et al., Reference Morales, Pérez-Edgar and Buss2015; Pérez-Edgar et al., Reference Pérez-Edgar, Reeb-Sutherland, McDermott, White, Henderson, Degnan and Fox2011).
The overreliance on dot-probe based RTs as the primary measure of attention deployment may contribute to the inconsistent findings. Dot-probe RT measures have poor test–retest reliability, particularly in youth (Britton et al., Reference Britton, Bar-Haim, Clementi, Sankin, Chen, Shechner and Pine2013; Brown et al., Reference Brown, Eley, Broeren, MacLeod, Rinck, Hadwin and Lester2014). In part, this may be because response-based measures do not provide a direct measure of attention processes, which reduces measurement reliability (Rodebaugh et al., Reference Rodebaugh, Scullin, Langer, Dixon, Huppert, Bernstein and Lenze2016). Attention processes are continuous and dynamic; multiple attention shifts may occur during and after stimulus presentation before the manual response is made (Yiend, Reference Yiend2010). RT measures are particularly “noisy” indicators of attention as the final button press incorporates multiple mechanisms from initial sensory processing to initial orienting and potentially disengagement from other stimuli, through to response selection and motor engagement (Shechner et al., Reference Shechner, Britton, Pérez-Edgar, Bar-Haim, Ernst, Fox and Pine2012).
Due to the problems inherent in the dot-probe task and other RT measures of AB, there have been recent calls to implement multiple measures of AB across levels of analysis to characterize affect-biased attention (Fu & Pérez-Edgar, Reference Fu and Pérez-Edgar2019; Price et al., Reference Price, Kuckertz, Siegle, Ladouceur, Silk, Ryan and Amir2015; Rodebaugh et al., Reference Rodebaugh, Scullin, Langer, Dixon, Huppert, Bernstein and Lenze2016). Eye-tracking measures of attention are promising as they provide a more proximal, continuous, and temporally sensitive measure of visual attention (Armstrong & Olatunji, Reference Armstrong and Olatunji2012). Eye-tracking indices can be calculated from computerized tasks to capture components of AB conceptually associated with anxiety (Eysenck, Derakshan, Santos, & Calvo, Reference Eysenck, Derakshan, Santos and Calvo2007; Mogg & Bradley, Reference Mogg and Bradley1998).
Only a handful of studies have utilized eye-tracking measures with dot-probe paradigms to examine AB in youth (Burris, Barry-Anwar, & Rivera, Reference Burris, Barry-Anwar and Rivera2017; Burris, Barry-Anwar, Sims, et al., Reference Burris, Barry-Anwar, Sims, Hagerman, Tassone and Rivera2017; Hilt, Leitzke, & Pollak, Reference Hilt, Leitzke and Pollak2017; Price et al., Reference Price, Siegle, Silk, Ladouceur, McFarland, Dahl and Ryan2013, Reference Price, Rosen, Siegle, Ladouceur, Tang, Allen and Silk2016; Tsypes, Owens, & Gibb, Reference Tsypes, Owens and Gibb2017). These studies commonly measured (a) initial attention vigilance to emotional faces (e.g., angry face; e.g., Price et al., Reference Price, Rosen, Siegle, Ladouceur, Tang, Allen and Silk2016; Tsypes et al., Reference Tsypes, Owens and Gibb2017); and (b) sustained attention preference toward the emotional faces (e.g., Hilt et al., Reference Hilt, Leitzke and Pollak2017). These indices showed improved internal consistency and reliability compared to RT measures in 9- to 13-year-olds (Price et al., Reference Price, Kuckertz, Siegle, Ladouceur, Silk, Ryan and Amir2015). Findings from three studies that compared dot-probe eye-tracking and RT indices showed that while eye-tracking measures were associated with levels of rumination (Hilt et al., Reference Hilt, Leitzke and Pollak2017), suicidal ideation (Tsypes et al., Reference Tsypes, Owens and Gibb2017), and transition from anxiety to later depression (Price et al., Reference Price, Rosen, Siegle, Ladouceur, Tang, Allen and Silk2016). Eye-tracking findings were evident even when there were no symptom-related differences in RT scores. Hence, eye-tracking measures might be more sensitive in capturing AB patterns associated with internalizing symptoms in children than the RT measures (Price et al., Reference Price, Kuckertz, Siegle, Ladouceur, Silk, Ryan and Amir2015).
Extending Threat-Related Attention to Social Interactive Contexts
Thus far, existing assessments of AB (including RT, eye-tracking, and neuroimaging methods) rely on screen-based, computer-controlled paradigms that examine attention toward preselected, static, and relatively artificial stimuli, often black-and-white photos. However, there is a real-time, dynamic relation between attention, emotion regulation (i.e., changes in initial emotion responses), and socioemotional behavior (Cole, Hall, & Hajal, Reference Cole, Hall, Hajal, Beauchaine and Hinshaw2017; Morales, Fu, et al., Reference Morales, Fu and Pérez-Edgar2016; Todd et al., Reference Todd, Cunningham, Anderson and Thompson2012). While eye-tracking measures of attention offer improvements over RT measures, using this technology in the static dot-probe task still limits the ability to delineate attention patterns in the context of real-life social interactions. A core aspect of emotion dysregulation in BI children is the tendency to monitor and avoid rather than engage and explore with the social environment (Pérez-Edgar, Reference Pérez-Edgar, Pérez-Edgar and Fox2018). Hence, we need to understand how AB is deployed in more dynamic than screen-based task contexts. To this end, we need to incorporate more ecologically valid and interactive paradigms to capture attention patterns in vivo to fully capture risk for developing socioemotional maladjustments (Redcay & Warnell, Reference Redcay and Warnell2018).
Mobile eye-tracking offers a spatially and temporally sensitive assessment tool for capturing person-centered attention processes in naturalistic contexts. By continuously recording an individual's field of view and attention focus, we can chart real-time within-person changes in attention as the individual interacts with the social world (Franchak, Reference Franchak, Hopkins, Geangu and Linkenauger2017; Hayhoe & Rothkopf, Reference Hayhoe and Rothkopf2011). Emerging mobile eye-tracking studies indicate that screen-based, stationary attention patterns are different from patterns observed during naturalistic exploration (Bambach, Crandall, Smith, & Yu, Reference Bambach, Crandall, Smith and Yu2018; Franchak, Reference Franchak, Wagman and Blauin press). Specifically, the opportunity for real-life social interaction and the resulting awareness of the self as an active social agent, rather than a passive observer, leads to different looking behavior in adults (Foulsham, Walker, & Kingstone, Reference Foulsham, Walker and Kingstone2011; Freeth, Foulsham, & Kingstone, Reference Freeth, Foulsham and Kingstone2013; Kretch & Adolph, Reference Kretch and Adolph2015; Laidlaw, Foulsham, Kuhn, & Kingstone, Reference Laidlaw, Foulsham, Kuhn and Kingstone2011). In addition, behavioral observations in the laboratory indicate that attention patterns toward affectively salient stimuli and events predict emotional behavior (e.g., Crockenberg, Leerkes, & Bárrig Jó, Reference Crockenberg, Leerkes and Bárrig Jó2008; Kiel & Buss, Reference Kiel and Buss2011). Thus, incorporating mobile eye-tracking in traditional observational paradigms could reveal more fine-grained attention patterns that play a role in emotion regulation and dysregulation. Finally, evidence suggests that laboratory-based mobile eye-tracking paradigms can capture threat-related AB associated with psychopathology. For example, Woody et al. (Reference Woody, Rosen, Allen, Price, Hutchinson, Amole and Silk2019) found that adolescent girls showed more frequent and longer eye gazes toward a critical judge, relative to a positive judge, when giving a speech. This pattern, in turn, was associated with levels of depressive symptomatology.
The Current Study
To reconcile the consistent findings of neural differences in response to threat with inconsistent findings from RT measures of threat bias in BI, the current study was designed to assess the possibility that eye-tracking might be a more reliable measure of AB in BI children. In addition, in order to begin to explore the utility of incorporating multiple paradigms and multiple contexts to study patterns of AB (Price et al., Reference Price, Kuckertz, Siegle, Ladouceur, Silk, Ryan and Amir2015; Rodebaugh et al., Reference Rodebaugh, Scullin, Langer, Dixon, Huppert, Bernstein and Lenze2016), we developed an eye-tracking paradigm that could be used in a real-world setting (Fu & Pérez-Edgar, Reference Fu and Pérez-Edgar2019). The present study used a screen-based stationary eye-tracking and a mobile eye-tracking paradigm to assess attention patterns among a group of 5- to 7-year-old BI children. This age group precedes the typical onset of clinically significant anxiety (Beesdo, Knappe, & Pine, Reference Beesdo, Knappe and Pine2009), but is marked by the transition to formal schooling, when SW is commonly expressed in BI children (Coplan & Arbeau, Reference Coplan and Arbeau2008). As such, the current study helps delineate more fine-grained, trait-level attention patterns that may underlie behavior dysregulation and potentiate risks for socioemotional maladjustment.
In this three-part investigation, we first aimed to examine whether there are BI-linked differences in AB indices computed from a traditional dot-probe task using RTs and traditional stationary eye-tracking, and whether stationary AB modulates parent report of SW levels. In Part 2, we aimed to investigate whether there are BI-linked differences in looking behavior toward a putative social threat (i.e., an unfamiliar adult), and whether ambulatory threat-related attention is associated with SW. In Part 3, we explored (a) the association between stationary and ambulatory attention indices, (b) whether the association varied by BI status, and (c) whether stationary and ambulatory attention measures jointly predict SW levels. This three-part systematic analysis is designed to illustrate the strength and promise of both stationary and mobile eye-tracking as additional tools for capturing AB, while also generating initial indicators of power and effect size.
Method
The present analysis drew from an ongoing multivisit study examining temperament-related individual differences in affect-biased attention using both stationary and mobile eye-tracking measures. Exclusion criteria for participating in the larger study included being a non-English speaker, having gross developmental delays, or having severe neurological and medical illnesses. All study procedures were approved by the institutional review board at Pennsylvania State University, and written informed consent/assent was obtained prior to participation.
All participants completed the dot-probe task while undergoing traditional stationary eye-tracking. A subsample also provided data from a mobile eye-tracking paradigm that measured ambulatory attention toward a putative social threat, in a live social context. Given the novel mobile eye-tracking methodology used in the current study, we were mindful of good practices for reporting eye-tracking data (Oakes, Reference Oakes2010) and aimed to demonstrate the utility of the eye-tracking technology in developmental research. Thus, we have carefully noted the specifications of the equipment used and the protocols needed to capture visual attention patterns during social interactions.
Participants
Part 1: Dot-probe task
Participants were 81 5- to 7-year-olds (M age = 6.03, SD = 0.61; 40 boys), recruited through a university database of families interested in participating in research studies, community outreach, and word of mouth. Potential participants (158 children; M age = 5.86, SD = 0.72; 86 boys) were screened based on parent report (92.4% maternal report) using the Behavioral Inhibition Questionnaire (BIQ; Bishop, Spence, & McDonald, Reference Bishop, Spence and McDonald2003). Of the 158 children characterized for the current study, 37 (23.4%) met the BI criterion (see below), and 23 participated in the study. Fifty-eight children who scored below the BI cutoffs also participated in the current analysis. The sample was predominantly Caucasian (86.7%), which reflects the surrounding rural community. The remaining families self-identified as Asian (N = 5), African American (N = 4), Hispanic (N = 1), and biracial (N = 1). The sample included two sibling pairs. One child from each pair was excluded from data analyses (2 boys, both non-BIs).
All 81 participants attempted the dot-probe task. Seventy-one children (M age = 6.06, SD = 0.6; 35 boys; Table 1) were included in the final analyses of RT data. Eye-tracking data analyses included 73 participants (M age = 6.06, SD = 0.61; 34 boys; Table 1). Sixty-six participants provided both valid RT and stationary eye-tracking data (M age = 6.08, SD = 0.59; 31 boys). RT and eye-tracking data were excluded if the participants were from a sibling pair (N = 2) or completed too few trials of the task (N = 1). Specifically, for the RT data, participants were excluded if they provided no RT data (N = 4), or had poor performance (i.e., <60% valid trials; N = 3). For the eye-tracking data, participants were excluded if they had no fixation data (N = 1), or provided too few trials with at least one valid face fixation (N = 4). The included participants did not differ from the excluded participants in sex, RT data: χ2 = 0.002, p = .97, φ = .005, eye-tracking data: χ2 = 2.33, p = .13, φ = .17; BI status, RT data: χ2 = .01, p = .90, φ = .01, eye-tracking data: χ2 = 0.05, p = .82,φ = .03; age, RT data: t (78) = 1.19, p = .24, d = 0.27, eye-tracking data: t (78) = 1.52, p = .13, d = 0.34; and SW levels, RT data: t(78) = –0.49, p = .63, d = –0.11, eye-tracking data: t (78) = –0.69, p = .49, d = 0.16.
Table 1. Mean and standard deviations of demographic information and study variables included in Part 1: Behavioral inhibition, dot-probe task attention measures, and social withdrawal

Notes: Mean and standard deviation for RT and stationary eye-tracking bias scores were computed from Winsorized values. BI, behavioral inhibition. RT, reaction time. **p < .001.
Parts 2 and 3: Mobile eye-tracking
Thirty-seven (M age = 6.13, SD = 0.63; 18 boys; 12 BI; 91.9% Caucasian) of the 81 children who participated in the larger study were included in analyses using mobile eye-tracking data. Data from the remaining participants were not included in analyses for a variety of reasons: the first 19 children were used for technical development of the protocol, 1 family declined to participate, 4 data sets were lost due to technical problems, and we were unable to obtain satisfactory calibration on 13 participants. The final subsample of 37 children did not contain any members of a sibling pair. Independent samples t tests indicate that the subsample did not differ from the larger sample on age, t (78) = 1.32, p = .19, d = 0.3, and SW levels, t (78) = –0.61, p = .55, d = –0.14. In addition, they did not differ on sex, χ2 (1) = 0.02, p = .90, φ = .01, and BI status, χ2 (1) = 0.55, p = .46, φ= .08.
Apparatus and procedures
Stationary eye-tracking
Data were acquired using a RED-m Eye Tracking System (SensoMotoric Instruments). Children were seated 60 cm from a 22-inch (1600 × 900 pixels) presentation monitor. The eye-tracker has embedded cameras that detect and record the reflection of an infrared light source on the cornea relative to the pupil from both eyes. The eye-tracking system has a 60-Hz sampling rate and an average accuracy of 0.5 to 1 degree, equivalent to 0.5- to 1-cm area on the screen with the 60-cm viewing distance. Once the experimenter made sure the child's eye gaze was on the center of the screen, testing began with a 5-point calibration and 4-point validation procedure during which an audiovisual animation was presented at the center and four corners of the screen. The calibration and validation procedure were administered before each of the four task blocks. Children could choose to take a short break after each block. Testing continued until all 100 trials had been presented, or the child declined to continue.
Mobile eye-tracking
As shown in Figure 1a, participants wore a Pupil head-mounted eye-tracker (Pupil Labs; Kassner, Patera, & Bulling, Reference Kassner, Patera and Bulling2014). The system consists of two eye cameras with infrared illumination for dark pupil tracking and a world camera with a fisheye lens. System specifications (resolution, sampling rate, etc.) are provided in the online-only Supplement 1. The system enables eye fixation information to be integrated with visual information from the participants’ perspective. Data were recorded with Pupil Capture v.0.9.12 (Pupil Labs) installed on an MSI VR One Backpack PC (Windows 10; Figure 1a).Footnote 1 In order to allow for the real-time monitoring of data collection during the experiment, a monitor located in a separate room was remotely connected to the Backpack PC. The headset plus the Backpack PC were light enough to enable children to move freely throughout the recording session.

Figure 1. Recordings from mobile eye-tracking procedures. (a) Task procedure. The child completed the Stranger Approach episode while wearing a head-mounted eye-tracker. The episode was taken from the Preschool Laboratory Temperament Assessment Battery (Lab-TAB; Goldsmith, Reilly, Lemery, Longley, & Prescott, Reference Goldsmith, Reilly, Lemery, Longley and Prescott1994). During the episode, a stranger walked toward the child, sat down and initiated a conversation, and left the room. The room recording (left) and the eye-tracking recording (right) were synchronized offline for data coding. In the eye-tracking recording, recording from the eye cameras were overlaid onto the recording from the world camera. (b) Validation procedure. Before the beginning of the Stranger Approach episode, the experimenter sat in the room location where the stranger would appear during the task episode. The experimenter held a target board (24 inches in diameter) at the child's eye level. The child was asked to look at five points on the target (center and four points of intersection). Recordings from the validation procedure were used for postexperiment calibration quality inspection and gaze correction. The images show gazes from two children after gaze correction. The top image displays a child with satisfactory calibration. Thus, after gaze correction (i.e., aligning the red circle to the pointed location on the target), the red circle can reliability indicate the actual gaze location. The bottom image shows a child with less satisfactory calibration. Hence, the red circle may not reliably indicate the gaze location even after correction. In such cases, we allowed a margin of error by using the yellow circle to determine whether the child looked at an area of interest. For example, in the image, we deemed that the child was looking at the pointed location, even when the location was outside the region of the red circle but enclosed by the yellow circle.
Upon starting the mobile eye-tracking session of the study, the child was led to a testing room for eye-tracker placement and calibration. Calibration and validation procedures are crucial for ensuring accurate and reliable mobile data (Franchak, Reference Franchak, Hopkins, Geangu and Linkenauger2017). The procedures are noted in detail in the online-only Supplement 1. After calibration and validation, the child was left alone in the room to complete the Stranger Approach episode (Goldsmith, Reilly, Lemery, Longley, & Prescott, Reference Goldsmith, Reilly, Lemery, Longley and Prescott1994; see online-only Supplement 1). The experimenter jointed the child again after the episode to continue the procedures for the larger study. The order of stationary and mobile eye-tracking procedures was randomized across participants.
Measures
BI
Parents completed the BIQ (Bishop et al., Reference Bishop, Spence and McDonald2003), a 30-item instrument that measures the frequency of BI-linked behavior in the domains of social and situational novelty (plus a summed total score) on a 7-point scale ranging from 1 (hardly ever) to 7 (almost always). The questionnaire has adequate internal consistency, construct validity, and validity in differentiating behaviorally inhibited from noninhibited children (Bishop et al., Reference Bishop, Spence and McDonald2003; Mernick, Pine, Gendler, & Shechner, Reference Mernick, Pine, Gendler and Shechner2018). Parent reports on the BIQ correlate with laboratory observations of BI in social scenarios (Dyson, Klein, Olino, Dougherty, & Durbin, Reference Dyson, Klein, Olino, Dougherty and Durbin2011). The BIQ had good internal consistency in the present study (Cronbach's α = 0.95).
Across the literature, BI has typically been characterized as a distinct group although this group can be characterized using composites of fearful behaviors that are on a continuum (reviewed in Buss & Kiel, Reference Buss, Kiel, Vasa and Roy2013). The categorical approach employed here reflects, in part, the original characterization of BI as a qualitatively distinct temperamental profile (Kagan et al., Reference Schwartz, Wright, Shin, Kagan and Rauch2003), as well as recruitment procedures that relied on an extreme-groups approach (Fox et al., Reference Fox, Henderson, Rubin, Calkins and Schmidt2001). We used group-based analyses, as our primary interest was to identify distinct attention patterns from stationary and ambulatory attention that may differentiate BI and non-BI profiles.Footnote 2
Children were designated as BI if they scored high on either the social novel subscale (≥60), the grand total score (≥119), or both. Cutoff scores were based on previous studies of extreme temperament in children aged 4–15 years (Broeren & Muris, Reference Broeren and Muris2010). Our group previously used the same parameters to screen 706 9- to 12-year-olds and established a BI distribution consistent with published findings (Broeren & Muris, Reference Broeren and Muris2010), identifying 25% of the sample as BI (e.g., Auday et al., Reference Auday, Taber-Thomas and Pérez-Edgar2018; Liu, Taber-Thomas, Fu, & Pérez-Edgar, Reference Liu, Taber-Thomas, Fu and Pérez-Edgar2018). These studies found that the BI group displayed altered patterns of threat-related attention at both behavioral (Morales, Taber-Thomas, & Pérez-Edgar, Reference Morales, Taber-Thomas and Pérez-Edgar2017) and neural (Auday et al., Reference Auday, Taber-Thomas and Pérez-Edgar2018; Fu et al., Reference Fu, Taber-Thomas and Pérez-Edgar2017; Thai, Taber-Thomas, & Pérez-Edgar, Reference Thai, Taber-Thomas and Pérez-Edgar2016) levels.
SW
The MacArthur Health Behavior Questionnaire (Armstrong, Goldstein, & MacArthur Working Group on Outcome Assessment, Reference Armstrong and Goldstein2003; Essex et al., Reference Essex, Boyce, Goldstein, Armstrong, Kraemer and Kupfer2002) consists of 172 items that mothers rated on a dichotomous (yes or no) or a 3-point scale (0 = never or not true, 1 = sometimes or somewhat true, or 2 = often or very true) regarding their children's mental and physical health and functioning during the past 6 months. The Health Behavior Questionnaire is particularly sensitive to internalizing problems (Lemery-Chalfant et al., Reference Lemery-Chalfant, Schreiber, Schmidt, Hulle, Essex and Goldsmith2007). The SW composite is computed as the mean of the scores on items from the social inhibition (3 items; e.g., “is afraid of strangers”) and asocial with peers (6 items; e.g., “avoids peers”) scales. The composite has adequate internal consistency in the present study (Cronbach's α = 0.76).
Stationary AB
The dot-probe task (Figure 2) has been previously administered behaviorally with 5- to 6-year-old children (Cole et al., Reference Cole, Zapp, Fettig and Pérez-Edgar2016; Kujawa et al., Reference Kujawa, Torpey, Kim, Hajcak, Rose, Gotlib and Klein2010; Morales, Pérez-Edgar, & Buss, Reference Morales, Pérez-Edgar and Buss2015, Reference Morales, Pérez-Edgar and Buss2016). The dot-probe task consisted of 8 practice trials and 100 experimental trials randomly presented in 4 blocks of 25 trials. Each trial began with the presentation of a central fixation cross for 500 ms followed by a pair of faces (NimStim; Tottenham et al., Reference Tottenham, Tanaka, Leon, McCarry, Nurse, Hare and Nelson2009) presented side by side for 500 ms. Faces were then removed and replaced by an asterisk (i.e., the probe) in the location of one of the preceding faces (2500 ms). Participants indicated the location of the asterisk by pressing a button on a keyboard as fast as they could (response recorded for 2500 ms; intertrial interval of 1800 ms). Task presentation was controlled by Experimenter Center (SensoMotoric Instruments).

Figure 2. Schematic of the dot-probe task used in the current study for reaction time and stationary eye-tracking measures. The illustrated trial presents face stimuli from the NimStim Face Stimulus set (Tottenham et al., Reference Tottenham, Tanaka, Leon, McCarry, Nurse, Hare and Nelson2009) approved for publication.
In congruent trials, the probe replaced the emotional face (angry or happy). Incongruent trials had the probe replace the neutral face. Three combinations of faces were presented: angry-neutral (40 trials; 20 congruent trials), happy-neutral (40 trials; 20 congruent trials), and neutral-neutral (20 trials). The face stimulus set consisted of 10 different actors (half male). Each face was presented 10 times. The probe appeared in the right and left positions equally. The face pictures were each 14×19cm (visual angle 13.31×17.99 degrees), with a distance of 26.5 cm between their centers.
Ambulatory attention
The Stranger Approach episode (Goldsmith et al., Reference Goldsmith, Reilly, Lemery, Longley and Prescott1994) is a standardized observational paradigm designed to study temperament-related individual differences in interacting with a novel, putative social threat in a context that is optimized for experimental control. In the episode (Figures 1 and 3), a stranger (i.e., a research assistant who the child has never met) knocked on the door, entered the room, and stood by the door. The stranger then engaged in a prescribed set of actions; the script is presented in detail in online-only Supplement 1. Seven research assistants acted as the stranger for children in the current subsample; all strangers, but one, were male. All strangers were clean-shaven and wore identical clothing and a hat, with hair tucked in, in order to minimize individual differences.

Figure 3. State space grids depicting gaze on three areas of interest (AOIs: the stranger, the child him/herself, and the background room) during six types of stranger's behavior in the Stranger Approach episode (entering, standing by the door, approaching, standing by the chair, sitting on the chair, and walking away) for BI (bottom) and non-BI (top) children. Data from each child are depicted in a different color. The hollow circle represents the starting point for each child. The size of the circle is proportional to the duration of a continuous gaze on an AOI. Bigger circles indicate longer continuous gaze on the AOI.
Data processing
Dot-probe manual RTs
Data cleaning was based on published methods (Morales et al., Reference Morales, Pérez-Edgar and Buss2015, Reference Morales, Pérez-Edgar and Buss2016). Trials with missing responses, incorrect responses, and RTs outside a 150- to 2000-ms window post-probe presentation were excluded. Next, RTs of included trials were averaged for each participant and trials with RTs +/– 2SD of the individual child's mean were excluded. Children who had poor task performance (<60% valid trials) were excluded from RT data analyses. Similar inclusion/exclusion cutoffs have been applied in previous dot-probe studies in children with the age range of the current sample (Cole et al., Reference Cole, Zapp, Fettig and Pérez-Edgar2016; Pérez-Edgar et al., Reference Pérez-Edgar, Reeb-Sutherland, McDermott, White, Henderson, Degnan and Fox2011; White et al., Reference White, Degnan, Henderson, Pérez-Edgar, Walker, Shechner and Fox2017).
The cleaned RTs from the angry-neutral and happy-neutral trials were used to compute AB scores to the emotional faces by subtracting the mean RTs to probes on the congruent trials from the mean RTs to the probes on the incongruent trials. Positive scores denote a bias to emotional faces (angry or happy) whereas negative scores suggest a bias away from emotional faces (angry or happy). One outlier for the angry bias score (<mean – 3SD) was Winsorized by reassigning the outlier to the threshold for the minimum value (i.e., mean – 3SD).
Stationary eye-tracking
The raw x-y position coordinates of fixations, defined as gaze maintained for at least 80 ms within a 100-pixel maximum dispersion, were exported with BeGaze (SensoMotoric Instruments). An area of interest (AOI) encircling and including the entire face and probe display areas was created using BeGaze. Current analyses used fixation location, latency, and dwell time for each face AOI fixation in each trial computed using in-house Python scripts (Python Software Foundation, http://www.python.org/). After examining calibration (see online-only Supplement 1), we calculated the number of trials that contained at least one valid face fixation for each participant. Participants who provided too few trials (<mean trial number – 2SD; i.e., <26 trials) were excluded.
Indices of AB
For each participant, we computed mean fixation latency for each face type (only the initial face fixation latency in each trial were included), mean dwell time on each face type, and the total number of trials in which each face type was fixated upon. The cleaned eye-tracking fixation data from the angry-neutral and happy-neutral trials were used to compute AB scores to the emotional faces. Six eye-tracking AB scores were computed (Table 1). Two AB latency scores were calculated by subtracting the mean fixation latency on the emotional face (angry or happy) from the mean fixation latency on the competing neutral face. Two AB dwell time scores were calculated by subtracting the mean dwell time on the neutral face from the mean dwell time on the emotional face (angry or happy). Finally, two AB frequency scores were computed by subtracting the total number of trials with a neutral face fixation from the total number of trials in which participants fixated on the emotional face (angry or happy). Across all six indices, positive values indicate AB toward the emotional faces, whereas negative values indicate bias away from the emotional faces. One outlier happy bias latency score was Winsorized.
Mobile eye-tracking recording
Data from the eye cameras and the world camera were recorded to separate files. The recordings were combined and further processed using Pupil Player v.0.9.12 (Pupil Labs). Detailed procedures are noted in online-only Supplement 1. The room recording from video cameras and the exported eye-tracking recording were synchronized into a single composite video using Final Cut Pro (Figure 1). The composite recordings were inspected to make sure that the recordings from two sources were not out of synchronization for more than three frames. The composite videos were exported for coding with a resolution of 1920×1080 pixels at 30 fps.
Coding ambulatory gaze behavior
We used Datavyu software (Datavyu Team, 2014) for coding based on published methods (Franchak & Adolph, Reference Franchak and Adolph2010; Franchak, Kretch, & Adolph, Reference Franchak, Kretch and Adolph2017; Franchak, Kretch, Soska, & Adolph, Reference Franchak, Kretch, Soska and Adolph2011; Kretch & Adolph, Reference Kretch and Adolph2015; Kretch, Franchak, & Adolph, Reference Kretch, Franchak and Adolph2014). oders inspected the composite video frame by frame to denote the onset and offset time of each valid AOI fixation. For recordings with good calibration, the red circle was used to infer gaze location on AOIs: stranger's face (defined as any part of the head), stranger's body, child him/herself (when the child was looking at his or her own body), and the background room. For recordings with less optimal calibration, the yellow circle was used to determine gaze locations. The AOIs for these recordings were stranger's face only, stranger's body only, stranger's face and body (when the yellow circle enclosed both parts), child him/herself, and the background room.
A valid AOI fixation is defined as ≥3 consecutive frames (≈99.9 ms) of stable gaze on the same AOI. When the child looked down at him/herself, the pupils were often out of the range of the eye cameras (i.e., no points of gaze were visible). In such cases, coders scored the onset and offset times of self-looking using the room recording synced with the eye-tracking recording. Coders also denoted the onset and offset times for gazes on an AOI for shorter than 3 consecutive frames and unusable frames, defined as loss of tracking due to eye blinks, or when pupils were not properly detected due to reasons other than self-looking.
As the world camera can capture the stranger's behavior during the face-to-face interaction, coders marked the onset and offset times of the stranger's continuous movement: entering the room, standing by the door, approaching the child, standing by the chair, sitting on the chair, and walking away from the child. The time period when the stranger was standing by the chair was not scored for one participant because the stranger was out of the child's field of view. To ensure interrater reliability, a master coder scored 100% of all recordings, with 20% double coding for each participant. We had an average agreement of 94.2% (κ = 0.84) for eye gaze coding and 99.6% for stranger behavior coding (κ = 0.77).
Mobile eye-tracking indices of attention toward the putative social threat
Our primary interest was to characterize attention patterns toward the stranger. Continuous gaze behavior coding produced a time series of gaze locations for each participant. From this time series, we were able to make a number of computations. We calculated total number of gaze visits to the stranger. Each unique visit must be preceded by a fixation away from the stranger. In addition, we computed mean latency of gaze reengagement to the stranger, defined as the average time elapsed from the end of a visit to the stranger to the next visit to the stranger. We excluded the latency of first look to the stranger, as the stranger knocked on the door before entering, which may have primed children's looking behavior. We found that 6 children had zero latency to engage to the stranger. To capture sustained attention toward the stranger, we computed mean visit duration by dividing the total dwell time on the stranger by the number of visits made to the stranger, and proportion of dwell time on the stranger relative to the total duration of valid AOI fixations. The mean latency of reengagement and mean visit duration were subsequently log-transformed to correct for the skewed distributions.
We also aligned the timing of gaze coding and stranger behavior coding in Datayvu (Datavyu Team, 2014). This allowed us to explore children's gaze patterns as the stranger's behavior changed over the course of the episode (Figure 3).
Statistical analyses
Part 1: BI, stationary attention measures, and SW
Exploratory analyses suggested that participant age was not correlated with RT and stationary eye-tracking AB scores (ps > .19; Table 2). Boys showed greater happy bias than girls, indicated by mean latency, t (71) = 2.02, p = .047, d = 0.48. Independent samples t tests indicated that there were no sex differences in other indices (ps > .24, ds < 0.28). Hence, sex was added as a covariate only in models with latency indices of AB as the dependent variables (DVs). Because participants differed in total numbers of valid angry-neutral and happy-neutral trials (24–79 trials; M = 56.95, SD = 14.09), the effect of valid trial number was controlled for in analyses with latency and dwell time bias scores as DVs.
Table 2. Intercorrelations among variables in Part 1: Behavioral inhibition, dot-probe task attention measures, and social withdrawal

Note: The correlations among attention bias RT and stationary eye-tracking indices were based on 66 participants who provided both valid RT and stationary eye-tracking data. RT, reaction time. +p < .07. *p < .05. **p < .001.
For RT AB scores, a 2×2 mixed measures analysis of variance was used to test the effect of emotion (angry vs. happy) and BI status (BI vs. non-BI). If there was a significant correlation between any RT bias score and SW, a linear regression was used to test whether the relation was significant controlling for BI status.
To examine the pattern of stationary eye-tracking AB as a function of emotion and BI status, we first fitted a mixed-measures analysis of covariance with emotion (angry vs. happy) as the within-subjects factor and BI status (BI vs. non-BI) as the between-subjects factor on latency AB scores. The model was then repeated with dwell time scores as the DV. Finally, a mixed-measures analysis of variance was used to test the effects of emotion and BI status on AB frequency scores.
For significant correlations between any stationary eye-tracking AB score and SW levels, we then examined the effect of the AB score on SW, controlling for BI using a linear regression model.
Part 2: BI, ambulatory attention measures, and SW
We explored children's ambulatory gaze patterns using state space grids (Hollenstein, Reference Hollenstein2007; Lamey, Hollenstein, Lewis, & Granic, Reference Lamey, Hollenstein, Lewis and Granic2004; Lewis, Lamey, & Douglas, Reference Lewis, Lamey and Douglas1999). Mobile eye-tracking paradigms generate rich, high-intensity data. Thus, data visualization is a vital step that facilitates hypothesis generation and testing (Yu, Yurovsky, & Xu, Reference Yu, Yurovsky and Xu2012). State space grids provide a useful tool for visualizing how children's gaze patterns evolve as the stranger's behavior unfolds in real time (Figure 3). The unequal sample sizes in the BI and non-BI groups prevented us from making between-group comparisons. Instead, we examined within-person changes in children's gaze patterns across the six states of stranger's behavior in the BI and non-BI groups separately. We used the transitional entropy index produced by GridWare (Lewis et al., Reference Lewis, Lamey and Douglas1999) as a measure of the organization of children's AOI looking behavior in each of the stranger's behavior states (Hollenstein, Reference Hollenstein2007; Lewis et al., Reference Lewis, Lamey and Douglas1999). A high entropy score indicates high level of gaze transitions across AOIs (stranger child him/herself and the background room).
Preliminary analyses indicated that age was not correlated with mobile eye-tracking indices of attention patterns toward the stranger (ps > .26; Table 3), and independent-samples t tests suggest that there were no sex differences in these measures (ps > .10, ds < 0.60). Hence, the effects of age and sex were not controlled for in analyses for parsimony. However, the total coded episode duration (equal to the duration of stranger presence) did vary across subjects and was correlated with mean latency of reengagement to the stranger, r = .47, p = .003, proportion of time looking at the stranger, r = –.37, p = .02, and SW levels, r = –.34, p = .04 (Table 3). Therefore, all analyses accounted for the total duration of the stranger episode.
Table 3. Intercorrelations among variables for Part 2: Behavioral inhibition, ambulatory attention measures, and social withdrawal

*p < .05. **p < .01. ***p < .001.
The descriptive statistics for ambulatory attention coding are presented in Table 4. While the stranger's behavior and speech were standardized across participants, children's social behavior, such as the duration of their responses to the stranger's prompts, can drive the duration of stranger presence, which in turn, may influence children's gaze behavior. Hence, the coded episode duration was entered as a covariate in models with mobile eye-tracking indices and SW as DVs. Moreover, the mean number of visits to the stranger was higher in recordings when we allowed a margin of error for determining AOI looking (M = 30.69, SD = 11.35) versus recordings that did not use the error margin (M = 22.71, SD = 10.26), t (35) = 2.18, p = .04, d = 0.74. To control for this effect, a dichotomous variable (use of error margin) was entered as a covariate in models with mobile eye-tracking measures as the DV.
Table 4. Mean and standard deviations of demographic information and study variables included in Part 2: Behavioral inhibition (BI), ambulatory attention measures, and social withdrawal

Note: Total coded duration equals the duration of the time period when the stranger was present in the room. We allowed a margin of error in determining eye gaze locations for participants with less optimal mobile eye-tracking calibration. Mean latency of gaze visit and mean visit duration were log-transformed for analyses. Raw values are presented here for ease of interpretation. *p < .05. **p < .001.
Our analytic approach to mobile eye-tracking data involved two steps. We examined whether BI status influenced each mobile eye-tracking index of attention toward the putative social threat. We ran four linear regressions models with stranger presence duration and error margin coding as covariates, BI status as the predictor, and (a) total number of visits to the stranger, (b) mean latency of reengagement, (c) mean visit duration, and (d) proportion of dwell time on the stranger as the DV, respectively. To further explore whether BI is associated with a distinct pattern of ambulatory attention, we used a multivariate analysis of covariance to test the effect of BI on the linear combination of the four mobile eye-tracking indices, controlling for stranger presence duration and error margin coding.
When we found a significant correlation between any of the four mobile eye-tracking measures and SW levels, we tested whether the mobile eye-tracking index predicted SW after controlling for stranger presence duration and BI status.
Part 3: BI, comparison of stationary and ambulatory attention measures, and SW
Our focus here was to integrate multiple indices. We examined whether mobile eye-tracking indices of attention patterns toward the stranger correlated with stationary eye-tracking indices of AB across the overlapping subsample of 37 children. Rather than examining the correlations between all possible stationary-ambulatory pairs, we assessed the correlations between ambulatory gaze frequency (i.e., total number of gaze visits to the stranger) and stationary fixation frequency measures of AB, between ambulatory gaze latency (i.e., mean latency of reengagement) and stationary latency AB scores, and between ambulatory gaze dwell time (i.e., mean visit duration and proportion of dwell time on the stranger) and stationary dwell time AB scores. These measures were chosen as they were conceptually similar across the tasks.
Next, we investigated whether the relations between ambulatory attention toward the stranger and stationary indices of AB differed as a function of BI. In order to minimize the number of models tested, we used the findings from Part 1 and 2 to select measures that differentiated between the BI groups. We employed a multiple regression model to test if the measure of ambulatory looking behavior, BI status, and their interaction predicted the stationary eye-tracking measure of angry bias. The model was repeated with the stationary eye-tracking index of happy bias as the DV.
Next, using the same stationary and mobile eye-tracking indices as the previous analysis, we tested whether the mobile eye-tracking measure could better explain the variance in SW levels over and above the stationary eye-tracking measure of AB, and whether the two types of eye-tracking indices jointly predicted SW levels. We employed a hierarchical regression model predicting SW levels by entering the stationary eye-tracking index of angry bias, the mobile eye-tracking measure, and their interaction. We ran an additional regression model to examine whether the stationary eye-tracking index of happy bias, the mobile eye-tracking measure, and their interaction predicted SW levels. The coded episode duration (i.e., the stranger presence duration) was entered in both models as a covariate (see Part 2 analyses).
Results
Part 1: BI, stationary attention measures, and SW
Descriptive statistics and intercorrelations of study variables
Descriptive statics for study variables are presented in Table 1. Preliminary analyses found no significant RT-based AB either across the whole sample: angry bias, t (70) = 1.36, p = .18, d = 0.33; happy bias, t (70) = 1.32, p = .19, d = 0.32; or separately within the BI group: angry bias, t (19) = 0.35, p = .73, d = 0.20; happy bias, t (19) = 0.02, p = .98, d = 0.01; and non-BI group: angry bias, t (50) = 1.4, p = .17, d = 0.40; happy bias, t (50) = 1.74, p = .09, d = 0.49. Correlation analyses (Table 2) indicated that neither RT angry bias nor happy bias was correlated with SW levels, ps > .36.
BI group differences in stationary AB scores
Across the RT and stationary eye-tracking AB indices, models revealed no significant main effect of BI (BI vs. non-BI), ps > .18, emotion (angry vs. happy), ps > .66, or Emotion × BI interaction effects, ps > .17, on these stationary AB measures (Table 5).
Table 5. Parameter estimates and effect sizes for models examining behavioral inhibition (BI) group difference in attention bias indices

Part 2: BI, ambulatory attention measures, and SW
Visualization of gaze patterns in BI and non-BI children
Figure 3 displays the visualization of AOI gazes in BI and non-BI children using the state space grids. We found that for both BI and non-BI children, the transitional entropy score was highest for the “stranger approach” state (BI: 7.88; non-BI: 16.46) compared to the other states. The score was lowest for the “stranger sitting” state (BI: 2.04; non-BI: 2.53). This suggests that children's gaze patterns were the least stable during “stranger approach,” possibly due to the high saliency of the stranger (approach movement and unfamiliarity). The gaze patterns became the most stable and organized during “stranger sitting,” possibly because this is the longest segment of the episode. In addition, the stranger was sitting still and most likely engaged in conversation with the child.
BI group differences in attention patterns toward the stranger
The linear regression model revealed that after controlling for total coded episode duration, B = –0.02, ß = –0.04, t = –0.22, p = .83, and the coding method, B = 8.07, ß = 0.35, t = 2.16, p = .04, the BI group showed fewer gaze visits to the stranger than the non-BI group, B = –8.72, ß = –0.37, t = –2.32, p = .03, R 2 = .25. BI status did not significantly predict mean latency of gaze reengagement toward the stranger, B = 0.18, ß = 0.26, t = 1.76, p = .09, R 2 = .34, mean visit duration, B = 0.08, ß = 0.13, t = 0.7, p = .49, R 2 = .05, or proportion of time looking at the stranger, B = –2.97, ß = –0.06, t = –0.36, p = .73, R 2 = .15. Likewise, The multivariate analysis of covariance model indicated that there was no BI difference in an overall attention pattern indexed by the four mobile eye-tracking measures, F (4, 30) = 1.80, p = .15, ηp2 = .19.
The effect of number of visits to the stranger on SW
As shown in Table 3, the number of visits to the stranger was negatively correlated with SW levels, r = –.43, p = .01. However, the number of visits did not significantly predict SW levels, B = –0.01, ß = –0.22, t = –1.58, p = .12, R 2 = .44, over and above the effect of BI.
Part 3: BI, comparison of stationary and ambulatory attention measures, and SW
Relation between ambulatory attention and stationary attention patterns by BI status
Across all children, happy bias dwell time score was negatively related to average visit duration to the stranger, r = –.5, p = .002, and proportion of dwell time on the stranger, r = –.32 p = .05. No additional correlations were found between mobile and stationary eye-tracking indices, ps > .15.
Given the findings from Part 2, we examined whether BI status moderated the association between the number of visits to the stranger and angry bias indexed by the dot-probe face-fixation frequency. The linear regression model revealed a significant Visit Number × BI interaction effect, B = 0.41, ß = 0.51, t = 2.46, p = .02, R 2 = .16 (Figure 4). That is, number of visits to the stranger was positively related to the stationary eye-tracking angry bias index for BI children B = 0.35, ß = 0.9, t = 2.39, p = .02, whereas the association was not significant for non-BI children, B = –0.05, ß = –0.14, t = –0.72, p = .47. A second regression model indicated that BI status did not moderate the relation between number of visits to the stranger and the happy bias index, B = 0.21, ß = 0.27, t = 1.21, p = .23, R 2 = .06.
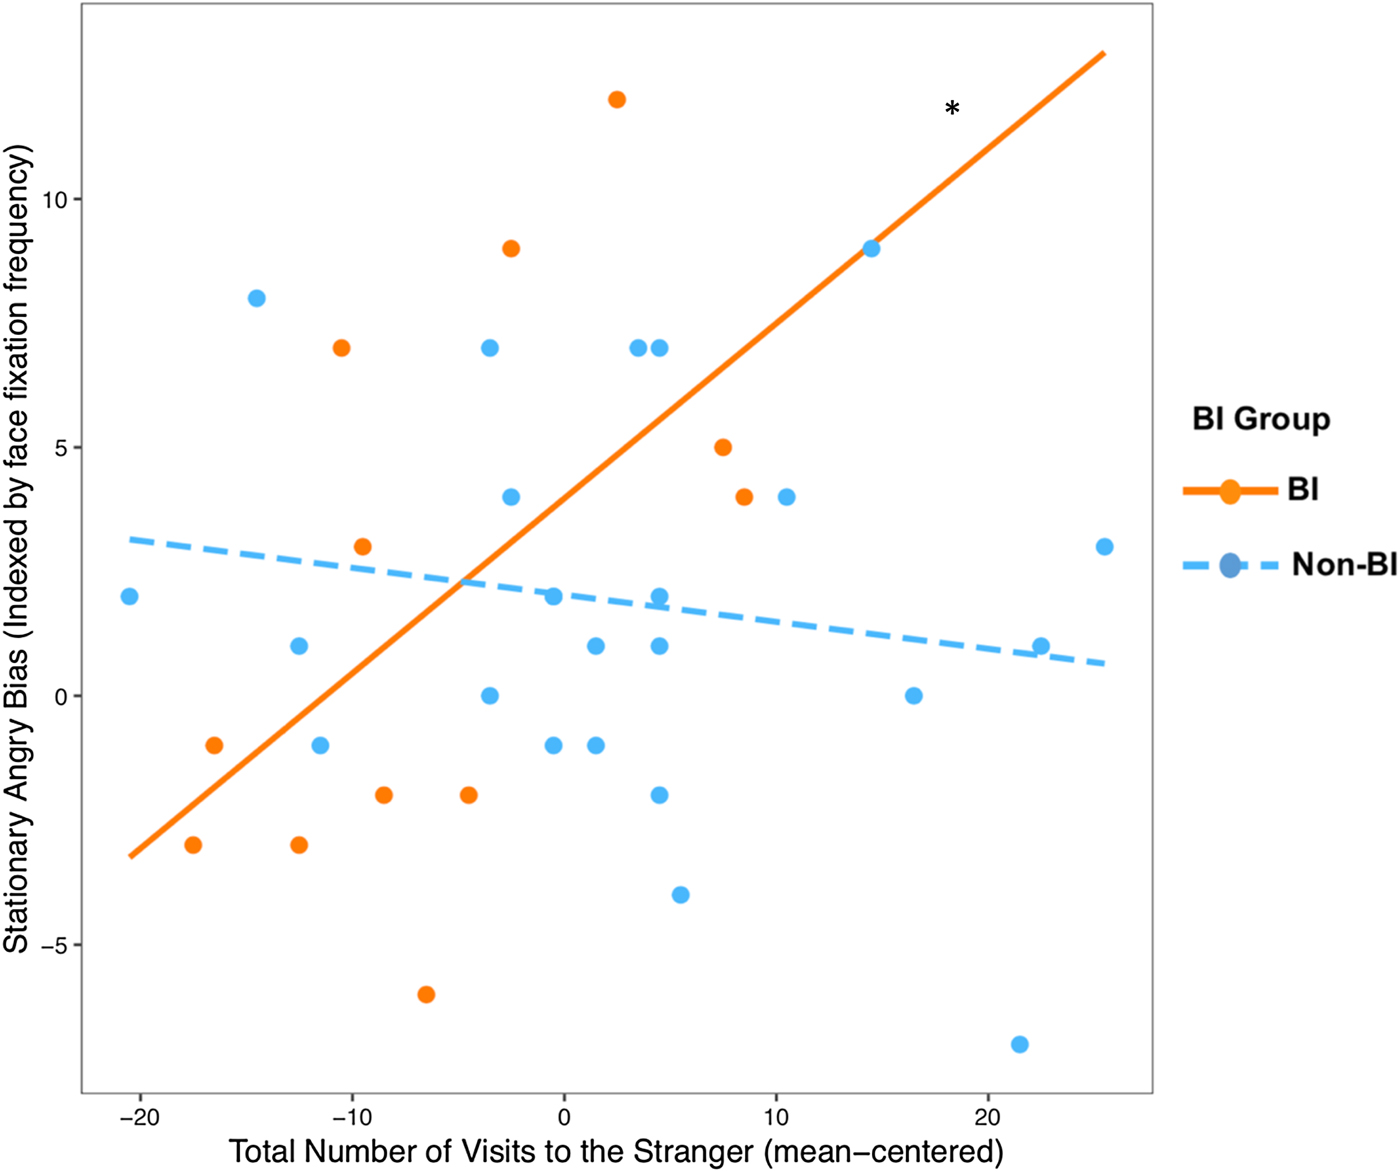
Figure 4. The association between the total number of visits to the stranger measured in the mobile eye-tracking task and the angry bias score computed from face fixation frequency in the stationary dot-probe eye-tracking task, separately for the BI and non-BI groups. *p < .05.
The effect of ambulatory and stationary attention patterns on SW levels
The hierarchical regression model suggested that after controlling for the effect of stranger presence duration, B = –0.004, ß = –0.34, t = –2.11, p = .04, the effect of the stationary angry bias did not significantly explain SW levels, B = 0.01, ß = 0.09, t = 0.57, p = .58, R 2 = .13. Including the ambulatory number of visits to the stranger explained significantly more variance in SW levels, B = –0.01, ß = –0.38, t = –2.51, p = .02, ΔR 2 = .14. The Visit Number × Angry Bias interaction effect on SW levels was not significant, B = 0.002, ß = 0.29, t = 1.88, p = .07, R 2 = .34. Similarly, the second regression model revealed that the number of visits to the stranger accounted for significantly more variance in SW levels, relative to only including stranger presence duration and stationary happy bias score as predictors, B = –0.01, ß = –0.36, t = –2.34, p = .03, ΔR 2 = 0.12. The Visit Number × Happy Bias interaction effect on SW levels was also not significant, B = 0.002, ß = 0.28, t = 1.93, p = .06, R 2 = .36.
Discussion
The present study is the first to examine attention patterns toward affectively salient stimuli in children assessed for BI by directly comparing manual RTs with stationary and mobile eye-tracking measures of attention. Affect-biased attention plays a central role in anxiety regulation (Todd et al., Reference Todd, Cunningham, Anderson and Thompson2012; White et al., Reference White, Helfinstein, Reeb-Sutherland, Degnan and Fox2009) and the development of socioemotional functioning (Morales, Fu, et al., Reference Morales, Fu and Pérez-Edgar2016). Existing literature strives to understand how age-related changes in affect-biased attention interact with early vulnerability factors, such as BI, to influence the emergence of psychopathology (Field & Lester, Reference Field and Lester2010; Morales, Fu, et al., Reference Morales, Fu and Pérez-Edgar2016; Shechner et al., Reference Shechner, Britton, Pérez-Edgar, Bar-Haim, Ernst, Fox and Pine2012). However, the extant literature is inconsistent in this association, which may relate to how attention is measured. The current study advances attention assessment beyond screen-based paradigms and into social interactive contexts.
This study examined whether BI-related differences emerged in stationary and ambulatory measures of attention: manual RT and eye-tracking indices in the dot-probe paradigm, and mobile eye-tracking measures of ambulatory attention during active social interaction. We also examined whether the stationary and ambulatory attention measures independently predicted parent reports of SW levels. Finally, we examined whether the association between the stationary and ambulatory attention indices varied as a function of BI status, and whether the stationary and ambulatory indices jointly predicted SW levels.
The current study revealed several important findings. First, while there were no BI group differences in RT and eye-tracking indices of AB, the proof-of-concept investigation among a subsample of the participants found that BI children made fewer gaze visits to the stranger than the non-BI group during active interaction with the stranger. Second, the association between gaze frequency to the stranger and stationary AB (indexed by the difference in angry vs. neutral face fixation frequency) differed as a function of BI status. That is, the BI group was characterized by a consistent pattern of stationary and ambulatory threat-related attention. Third, while stationary AB alone did not predict SW, including the ambulatory gaze frequency measure as an additional predictor added some explanatory power. We did not find strong evidence suggesting that stationary and ambulatory attention patterns jointly predict SW levels. Together, the current study provided preliminary evidence suggesting that BI may be associated with trait-like attention patterns toward putative social threats evident across contexts. We will consider each of these findings in turn.
RT scores of AB to angry or happy faces did not differ between BI groups, nor was a relation found when BI scores were considered as a continuous measure (see online-only Supplement 2). This is consistent with studies that compared dot-probe RT performance in 9- to 12-year-olds characterized using the same BI cutoff (Auday et al., Reference Auday, Taber-Thomas and Pérez-Edgar2018; Fu et al., Reference Fu, Taber-Thomas and Pérez-Edgar2017; Morales et al., Reference Morales, Taber-Thomas and Pérez-Edgar2017) and in 5- to 7-year-olds characterized as BI in toddlerhood (Pérez-Edgar et al., Reference Pérez-Edgar, Reeb-Sutherland, McDermott, White, Henderson, Degnan and Fox2011; White et al., Reference White, Degnan, Henderson, Pérez-Edgar, Walker, Shechner and Fox2017). Furthermore, the bias scores did not correlate with SW levels, in line with prior studies (Cole et al., Reference Cole, Zapp, Fettig and Pérez-Edgar2016; Morales et al., Reference Morales, Pérez-Edgar and Buss2015; Pérez-Edgar et al., Reference Pérez-Edgar, Reeb-Sutherland, McDermott, White, Henderson, Degnan and Fox2011). While some studies have found a relation between dot-probe responses and anxiety in adults, this relationship is not consistent, particularly in children (Dudeney et al., Reference Dudeney, Sharpe and Hunt2015; Roy et al., Reference Roy, Dennis and Warner2015; Shechner et al., Reference Shechner, Britton, Pérez-Edgar, Bar-Haim, Ernst, Fox and Pine2012). The RT difference score has poor reliability in youth (Britton et al., Reference Britton, Bar-Haim, Clementi, Sankin, Chen, Shechner and Pine2013; Brown et al., Reference Brown, Eley, Broeren, MacLeod, Rinck, Hadwin and Lester2014), which might have further undermined our power to detect BI difference with a modest sample size (Hedge, Powell, & Sumner, Reference Hedge, Powell and Sumner2018). A major problem with RT measures is that attention is captured as snapshots in time with the probe presentation (Rodebaugh et al. Reference Rodebaugh, Scullin, Langer, Dixon, Huppert, Bernstein and Lenze2016; Yiend, Reference Yiend2010). As such, these measures might be too “noisy” to reliably capture the core attention patterns associated with vulnerability for socioemotional problems, such as anxiety (Shechner et al., Reference Shechner, Britton, Pérez-Edgar, Bar-Haim, Ernst, Fox and Pine2012). These evident limitations of dot-probe RT measures generated current calls for implementing multiple levels of attention measurements (Price et al., Reference Price, Kuckertz, Siegle, Ladouceur, Silk, Ryan and Amir2015; Rodebaugh et al., Reference Rodebaugh, Scullin, Langer, Dixon, Huppert, Bernstein and Lenze2016).
Because of the improvements in attention assessments embedded in eye-tracking measures, we predicted BI children would display AB indexed by dot-probe eye-tracking measures. However, contrary to our hypothesis, there were no BI-related differences in the stationary eye-tracking measures. In addition, there was no significant relation between stationary AB scores and SW levels. This is an important relation because SW is conceptualized as an intermediate development sequela in the link between BI and the emergence of anxiety (Rubin et al., Reference Rubin, Coplan and Bowker2009). Although there are still relatively few eye-tracking studies using established paradigms in children, eye-tracking indices of AB has generated some improvements in reliability over RT measures (Price et al., Reference Price, Kuckertz, Siegle, Ladouceur, Silk, Ryan and Amir2015). However, inconsistencies are still evident in pediatric studies. For example, pediatric anxiety was associated with initial vigilance toward angry faces in one study (Shechner et al., Reference Shechner, Britton, Pérez-Edgar, Bar-Haim, Ernst, Fox and Pine2013), with threat avoidance in others (Gamble & Rapee, Reference Gamble and Rapee2009; In-Albon, Kossowsky, & Schneider, Reference In-Albon, Kossowsky and Schneider2009; Shechner et al., Reference Shechner, Jarcho, Wong, Leibenluft, Pine and Nelson2017), and in some, with difficulty in disengaging from threat (Seefeldt, Krämer, Tuschen-Caffier, & Heinrichs, Reference Seefeldt, Krämer, Tuschen-Caffier and Heinrichs2014). Some of this variability may relate to variance in paradigm and stimulus presentation duration. These studies employed variations of free-viewing with stimulus presentation ranging from 500 ms (Gamble & Rapee, Reference Gamble and Rapee2009) to 4000 ms (In-Albon et al., Reference In-Albon, Kossowsky and Schneider2009). It is also possible that anxiety-related AB takes place at both early and late stages of visual information processing (Cisler & Koster, Reference Cisler and Koster2010). The 500-ms face presentation implemented in the current study might be too short to capture temperament-related individual differences in later components of AB. By using a long face presentation of 2000 ms in a dot-probe task, Price et al. (Reference Price, Kuckertz, Siegle, Ladouceur, Silk, Ryan and Amir2015) showed that the eye-tracking index of difficulty in disengaging from fearful faces had good test–retest reliability in 9- to 13-year-olds, but the reliability score was lower than the eye-tracking indices for initial attention vigilance and sustained attention toward threat. Hence, to increase the reliability and sensitivity of stationary eye-tracking AB measures, it would be fruitful to use multiple task paradigms that are optimized to capture different components of AB.
Even with implemented variations, computerized attention paradigms still limit our ability to understand the interactive relation between affect-biased attention, emotion dysregulation, and socioemotional behavior in the real-world settings (Fu & Pérez-Edgar, Reference Fu and Pérez-Edgar2019; Morales et al., Reference Morales, Taber-Thomas and Pérez-Edgar2017; Todd et al., Reference Todd, Cunningham, Anderson and Thompson2012). Affect-biased attention is one method used to regulate negative emotional responses (Cole et al., Reference Cole, Hall, Hajal, Beauchaine and Hinshaw2017). Attention engagement and disengagement in a dynamic environment impact the development from early BI to subsequent socioemotional adjustment, as suggested by theoretical models (Morales, Fu, et al., Reference Morales, Fu and Pérez-Edgar2016; Henderson et al., Reference Henderson, Pine and Fox2015) and longitudinal evidence (Morales et al., Reference Morales, Pérez-Edgar and Buss2015; Nozadi et al., Reference Nozadi, Troller-Renfree, White, Frenkel, Degnan, Bar-Haim and Fox2016; Pérez-Edgar et al., Reference Pérez-Edgar, Bar-Haim, McDermott, Chronis-Tuscano, Pine and Fox2010, Reference Pérez-Edgar, Reeb-Sutherland, McDermott, White, Henderson, Degnan and Fox2011; White et al., Reference White, Degnan, Henderson, Pérez-Edgar, Walker, Shechner and Fox2017). Thus, we expected to see that BI children display altered attention patterns during an active interaction with a putative social threat.
Here, we found that BI children directed fewer eye gazes toward the stranger compared to their non-BI peers. However, there were no BI group differences in average latency of reengagement and sustained attention toward the stranger. Thus, the BI group was associated with a gaze pattern that is characterized specifically by reduced frequency of reengagement to the social partner, rather than a global avoidance pattern. A similar pattern of attention avoidance from threat was also found in 6-year-old children who were characterized by a dysregulated fear temperament profile in toddlerhood (Morales et al., Reference Morales, Pérez-Edgar and Buss2015). Thus, the current findings suggest that fearful temperament is associated with attention avoidance from affectively salient social stimuli in a naturalistic context.
BI children may use attention avoidance as a reactive, involuntary emotion regulation strategy to reduce initial fear reactivity (Gross, Reference Gross2014; Rueda, Reference Rueda, Zentner and Shiner2012). Attention avoidance may temporarily ameliorate negative affect, although in the long term it is an ineffective emotion regulation strategy that predicts heightened anxiety (Aldao et al., Reference Aldao, Nolen-Hoeksema and Schweizer2010; Jazaieri et al., Reference Jazaieri, Morrison, Goldin and Gross2015). Adult studies showed that AB away from imminent threat predicts concurrent posttraumatic stress disorder symptoms (Bar-Haim et al., Reference Bar-Haim, Holoshitz, Eldar, Frenkel, Muller, Charney and Wald2010), as well as posttraumatic stress disorder symptoms a year later (Wald et al., Reference Wald, Shechner, Bitton, Holoshitz, Charney, Muller and Bar-Haim2011). Recent research (Troller-Renfree, Buzzell, Pine, Henderson, & Fox, Reference Troller-Renfree, Buzzell, Pine, Henderson and Fox2019) examining the chronometry of regulatory control revealed that toddlerhood BI predicted increased engagement of reactive control even after the eliciting challenge is removed. Moreover, adolescents characterized with early BI who also adopt reactive control display increased anxiety symptoms.
It should be noted that BI levels, measured using continuous scores, did not predict the frequency of gaze visit to the stranger (online-only Supplement 2). The BI category represents 23% of the 158 children screened. Hence, it is possible that the attention avoidance pattern is not a linear effect and only characterizes children with extreme levels of BI. Replication in a larger sample with BI scores computed from both parent-report and observational measures (Fox et al., Reference Fox, Henderson, Rubin, Calkins and Schmidt2001) would help assess the generalizability and reliability of the current preliminary data.
We provide preliminary evidence suggesting that children's looking behavior in vivo can facilitate the identification of attention patterns that underlie the vulnerability of developing socioemotional maladjustment. Specifically, the BI group was characterized by a consistent threat-related attention pattern across the computerized and social interactive task contexts. The positive association between stationary and ambulatory attention measures was also significant at high levels of BI measured using continuous scores (online-only Supplement 2), indicating a potentially robust linear effect. Largely in parallel with the present findings, Morales et al. (Reference Morales, Taber-Thomas and Pérez-Edgar2017) showed that BI children (9- to 12-year-olds) also showed a cross-task correlation for RT threat bias scores. In addition, a consistent pattern of threat bias across both tasks was linked to greater social anxiety (Morales et al., Reference Morales, Taber-Thomas and Pérez-Edgar2017). Corroborating previous findings using screen-based paradigms, it is likely that BI is characterized by traitlike, and possibly inflexible AB patterns in both static and dynamic (real-life) social contexts.
BI is characterized by a hyperreactive neural response pattern toward both threat and reward (Kagan, Reference Kagan, Zentner and Shiner2012; Guyer et al., Reference Guyer, Nelson, Perez-Edgar, Hardin, Roberson-Nay, Monk and Ernst2006). This hyperreactive response style may frequently engage regulatory attention control functions, such as avoidance, as an attempt to dampen the experienced intensity of affective stimuli. Over time, the engagement of regulatory processes becomes more reactive, rigid, and less efficient in regulating bottom-up attention orienting toward the affectively salient stimuli. An entrenched and context-independent attention pattern may gradually form through this cyclic process, which in turn increases the risk for socioemotional maladjustment and anxiety in BI children (Henderson et al., Reference Henderson, Pine and Fox2015; Henderson & Wilson, Reference Henderson and Wilson2017; Pérez-Edgar, Reference Pérez-Edgar, Pérez-Edgar and Fox2018).
We believe that incorporating mobile eye-tracking in a real-life social interactive context can complement computer-based assessments to uncover fine-grained attention patterns underlying anxiety vulnerability. There were, however, several limitations in the mobile eye-tracking portion of this study. First, we had a small sample of children who contributed mobile eye-tracking data (N = 37). Although the sample size is comparable to published mobile eye-tracking studies in infants (e.g., Franchak et al., Reference Franchak, Kretch and Adolph2017; Kretch et al., Reference Kretch, Franchak and Adolph2014), adolescents (Woody et al., Reference Woody, Rosen, Allen, Price, Hutchinson, Amole and Silk2019), and adults (e.g., Freeth et al., Reference Freeth, Foulsham and Kingstone2013; Laidlaw et al., Reference Laidlaw, Foulsham, Kuhn and Kingstone2011), it is not adequate for high-level modeling. The small sample size may have especially affected the power of our multiple regression models examining interaction effects (Maxwell, Reference Maxwell2000). While the moderating effect of BI in the relation between ambulatory and stationary attention measures has adequate effect size (Cohen, Reference Cohen1988), replications using larger samples are needed to uncover robust interaction effects. The mobile eye-tracking method is valuable but labor-intensive, which limits the extent to which large sizes can be easily acquired. The efficiency of data processing can be improved with the development of more automated fixation AOI identification functions.
Second, our BI characterization was based on parents’ reports. While the BIQ is a reliable and valid instrument that has been extensively used for BI identification (e.g., Liu et al., Reference Liu, Taber-Thomas, Fu and Pérez-Edgar2018; Mernick et al., Reference Mernick, Pine, Gendler and Shechner2018), the investigation of BI-related differences in ambulatory attention patterns will benefit from relying on laboratory observations to identify the BI group (Kagan, Reference Kagan, Davidson, Sherer and Hill Goldsmith2003). One future direction is to compute a BI composite from coded parameters (e.g., latency, frequency, and duration) of fearful behavior across Lab-TAB fear-eliciting episodes (Fox et al., Reference Fox, Snidman, Haas, Degnan and Kagan2015; Goldsmith et al., Reference Goldsmith, Reilly, Lemery, Longley and Prescott1994; Kagan et al., Reference Kagan, Reznick, Clarke, Snidman and Garcia-Coll1984). Researchers can then examine how the trait-level BI status and the state-level fear responses during the episode may influence children's online gaze patterns, and how these patterns may interact with BI to predict SW and anxiety levels. Furthermore, at a microlevel, a dynamic systems approach can model the ebb and flow of fear responses and the engagement of fear regulation during the exposure to putative social threats (Cole et al., Reference Cole, Hall, Hajal, Beauchaine and Hinshaw2017; Morales et al., Reference Morales, Ram, Buss, Cole, Helm and Chow2018). The current study did not directly examine the moment-by-moment relation between attention and fear responses. By providing spatially and temporally sensitive assessments gazes in real time, mobile eye-tracking opens the opportunity to study how ambulatory attention influences the unfolding of fear responses and regulation during social interactions.
Third, the present study assessed attention processes in a narrow developmental window that is marked by increased SW problems as children transition to formal schooling. Another future direction may be to chart age-related changes in stationary and ambulatory attention. Cross-sectional (Pérez-Edgar et al., Reference Pérez-Edgar, Morales, LoBue, Taber-Thomas, Allen, Brown and Buss2017) and longitudinal (Leppänen, Cataldo, Enlow, & Nelson, Reference Leppänen, Cataldo, Enlow and Nelson2018; Peltola, Yrttiaho, & Leppänen, Reference Peltola, Yrttiaho and Leppänen2018) stationary eye-tracking studies in infants have shown significant age effects on threat-related attention patterns. While it is expected that children might be better able to exert some regulatory control on bottom-up attention orienting with the development of executive attention in childhood (Rothbart et al., Reference Rothbart, Sheese, Rueda and Posner2011), we lack the data needed to depict possible linear or nonlinear changes in affect-biased attention patterns from infancy through childhood (Morales, Fu, et al., Reference Morales, Fu and Pérez-Edgar2016; Shechner et al., Reference Shechner, Britton, Pérez-Edgar, Bar-Haim, Ernst, Fox and Pine2012). With respect to ambulatory threat-related attention specifically, researchers could investigate whether there is a shift from attention preference toward threat in toddlerhood (e.g., Kiel & Buss, Reference Kiel and Buss2011) to threat avoidance in childhood (e.g., Morales et al., Reference Morales, Pérez-Edgar and Buss2015).
Fourth, although we adopted a social interactive paradigm, the data from the current study was still acquired in a laboratory setting. Thus, we lack full ecological validity in our assessment. The experimental paradigm was implemented to maximize control of stimulus presentation for this preliminary study. However, there are factors such as familiarity and context that are likely to play an important role in real-world settings that are not incorporated into our paradigm. With technological optimization of offline calibration, and the use of small wearable devices (e.g., cell phones) for data collection and online data quality monitoring (Pupil Labs, https://pupil-labs.com/pupil/), future studies will be able to venture into the “real” world to sample children's ambulatory attention as they navigate their specific social environments (Jung, Zimmerman, & Pérez-Edgar, Reference Jung, Zimmerman and Pérez-Edgar2018). This would vastly improve our understanding of the real-world clinical utility of incorporating visual attention measures into clinical and therapeutic interventions.
In conclusion, the present proof-of-concept study demonstrates the utility and benefits of using mobile eye-tracking technology to interrogate affect-biased attention patterns that may contribute to emotion regulation and evident vulnerability for socioemotional problems. Specifically, we highlighted that, relative to RT and computerized eye-tracking paradigms, assessing ambulatory attention patterns in the context of an active social interaction may enhance our sensitivity in detecting BI-related individual differences in threat-related attention patterns. Furthermore, the findings indicated that BI might be characterized by a potentially inflexible, context-independent pattern of attention deployment, which limits emotional regulation capacity and increases risk for socioemotional difficulties.
Supplementary material
The supplementary material for this article can be found at https://doi.org/10.1017/S0954579419000427.
Acknowledgments
We thank families for their participation in the study.
Financial support
The study was supported by the National Institute of Mental Health Grant R21 MH111980 (to K.P.E.). Preparation of the manuscript was supported by internal funding from the Research Institute at Nationwide Children's Hospital.


