


Introduction
The area of Antarctic Treaty governance is defined geopolitically as all land, adjoining ice shelves and ocean south of latitude 60°S. Although this landmass covers ~14 million km2, only ~0.2–0.4% is ice- or snow-free in summer (Burton-Johnson et al. Reference Burton-Johnson, Black, Fretwell and Kaluza-Gilbert2016), and the continent is characterized as the coldest, highest, driest and most inhospitable on Earth. The Antarctic continent is generally considered to include two broad biogeographical zones: the Maritime Antarctic and Continental Antarctica (Convey Reference Convey2017). These regions are distinct based on features such as the number and variety of species present and general climatic features (Walton Reference Walton and Laws1984, Cañadas Reference Cañadas2001).
Bryophytes are the second largest group of terrestrial plants globally, second only to the angiosperms (Buck & Goffinet Reference Buck, Goffinet, Goffient and Shaw2000). Approximately 17,800 species have been described across > 1200 genera, the largest division being represented by mosses (Bryophyta, ~13,000 species; Goffinet et al. Reference Goffinet, Buck, Shaw, Goffinet and Shaw2009). They are ecologically important organisms, and they are often amongst pioneer plants, being the first to colonize various terrestrial habitats and facilitating further colonization and establishment of other plant species (Hespanhol et al. Reference Hespanhol, Vieira and Séneca2008). They also contribute to soil formation and the carbon and nitrogen cycles, and they are an important component of terrestrial biomass (Lisboa & Ilkiu-Borges Reference Lisboa and Ilkiu-Borges1995). These organisms create microenvironments occupied by various micro-invertebrate groups such as rotifers, nematodes, tardigrades, mites and springtails (Gradstein et al. Reference Gradstein, Churchill and Salazar-Allen2001) that, in turn, can contribute to the fitness of the mosses (Shortlidge et al. Reference Shortlidge, Carey, Payton, McDaniel, Rosenstiel and Eppley2021). Bryophyte species have been used for studies of global climate change (Tuba et al. Reference Tuba, Slack and Stark2011), and they can be ecological indicators because many species are sensitive to small changes in environmental conditions (Royles et al. Reference Royles, Amesbury, Convey, Griffiths, Hodgson, Leng and Charman2013). Bryophytes are widely distributed globally and, although the greatest diversity is found in humid and shaded habitats, they are also well represented in extreme environments such as deserts and alpine and polar regions, including Antarctica (Buck & Goffinet Reference Buck, Goffinet, Goffient and Shaw2000, Ochyra et al. Reference Ochyra, Smith and Bednarek-Ochyra2008). Today, ~116 species of mosses from 17 families are known from Antarctica (Ochyra et al. Reference Ochyra, Smith and Bednarek-Ochyra2008, Câmara et al. Reference Câmara, Valente, de Amorim, Henriques, Carvalho-Silva, Convey and Stech2019).
In Antarctic terrestrial ecosystems, bryophyte communities develop in habitats that receive sufficient liquid water derived from precipitation or snowmelt during the summer months, broadly separating into xeric, mesic and hydric communities (Smith Reference Smith and Laws1984, Wasley et al. Reference Wasley, Robinson, Lovelock and Popp2006). Lacking a vascular system, bryophyte gametophytes do not have the mechanisms available to avoid desiccation, as characterizes vascular plants (Proctor et al. Reference Proctor, Oliver, Wood, Alpert, Stark, Cleavitt and Mishler2007). Bryophytes are therefore poikilohydric, with no specialized structures for regulating and controlling water loss, and they depend on the presence of free water during the summer months to allow photosynthesis to take place (Longton Reference Longton1988). Poikilohydric plants accumulate relatively high levels of cellular solutes, including lipids that provide protection during desiccation and freezing (Roser et al. Reference Roser, Melick, Ling and Seppelt1992, Montiel Reference Montiel2000, Robinson et al. Reference Robinson, Wasley, Popp and Lovelock2000), soluble amino acids and carbohydrates (Farrar Reference Farrar1976, Reference Farrar1978, Karunen & Salin Reference Karunen and Salin1982, Longton Reference Longton1988). Fatty acids are also important in the structure of the cell membrane and in maintaining its functions, thereby playing an important role in cold tolerance (Hulbert Reference Hulbert2003).
Across Antarctica, water availability is recognized as the major driver of terrestrial biodiversity (Convey et al. Reference Convey, Chown, Clarke, Barnes, Bokhorst and Cummings2014), and the extent of moss communities depends strongly on the availability of liquid water in the summer. In the Maritime Antarctic, these communities range from extensive moss banks and moss carpets that occur in areas with reliable water sources, typically diverse moss and lichen fellfields, and small isolated moss cushions growing in crevices and on rock and soil surfaces (Smith Reference Smith and Laws1984, Ochyra et al. Reference Ochyra, Smith and Bednarek-Ochyra2008, Block et al. Reference Block, Smith and Kennedy2009). In the Antarctic Peninsula region, the furthest south published records of bryophyte occurrences are of small cushions of two species from Quilty Nunatak in Ellsworth Land, approaching 76°S (Convey & McInnes Reference Convey and McInnes2005).
Plant-water relations, including water uptake, transport and loss, are important characteristics for the functioning of plant communities and ecosystems and potentially useful predictors of the effects of global climate change (Sack et al. Reference Sack, Ball, Brodersen, Davis, Des Marais and Donovan2016). As has been more widely reported for the two native Antarctic higher plants, expansions in bryophyte populations have also been noted in the Maritime Antarctic in response to regional climate change (Cannone et al. Reference Cannone, Guglielmin, Convey, Worland and Favero-Longo2016, Reference Cannone, Dalle Fratte, Convey, Worland and Guglielmin2017), while multi-century archives of bryophyte growth patterns in bank-forming mosses have been used to infer growth responses to previous changes in environmental temperature (Amesbury et al. Reference Amesbury, Roland, Royles, Hodgson, Convey, Griffiths and Charman2017). Rapid colonization of bryophytes into habitats recently exposed by snow and ice recession is also associated with the recent warming in the Maritime Antarctic (Convey & Smith Reference Convey and Smith2006).
Community composition and diversity depend on multiple processes that operate at different temporal and spatial scales (Heino et al. Reference Heino, Mykrä and Muotka2007). Given sufficient time, it might be assumed that all species present are capable of dispersing throughout a given region and, therefore, the absence or low abundance of a species in a specific location reflects the action of selective filters characteristic of a habitat that can be defined at any scale (Tonn et al. Reference Tonn, Magnuson, Rask and Toivonen1990). This set of filters define the community ‘assembly rules’, a term first introduced by Diamond (Reference Diamond, Cody and Diamond1975). These rules select species that have similar characteristics that allow them to survive and reproduce effectively in a given environment (Fox & Brown Reference Fox and Brown1993). Conversely, ecological niche theory (Elton Reference Elton1927) considers that species co-occurrence is only possible if the species involved have distinct characteristics; in other words, show low niche overlap. If so, species with very similar characteristics would be excluded through competition (Funk et al. Reference Funk, Cleland, Suding and Zavaleta2008).
Community development on a local scale results from interactions between local and regional factors, both abiotic and biotic (Menge & Olson Reference Menge and Olson1990, Ricklefs & Schluter Reference Ricklefs, Schluter, Ricklefs and Schluter1993, Hildrew & Giller Reference Hildrew, Giller, Giller, Hildrew and Raffaelli1994). The structure of the filters can facilitate understanding of how communities are assembled and how they respond to environmental changes (Keddy Reference Keddy1992). Thus, considering the selective action of habitat filters at multiple scales can increase our understanding and the predictive capacity of the ecological dynamics of communities (Feio & Dolédec Reference Feio and Dolédec2012). Belyea & Lancaster (Reference Belyea and Lancaster1999) considered three main groups of factors influencing community development: dispersal restrictions, environmental restrictions and biotic interactions.
Dispersal restrictions determine which species reach a given location (Booth & Swanton Reference Booth and Swanton2002). They provide biotic regulation of ecosystem services in Antarctica's ice-free soils (Pertierra et al. Reference Pertierra, Santos-Martin, Hughes, Avila, Caceres and De Filippo2021). Dispersal capacity is linked to the mechanism of dispersal, propagule size, connectivity between habitats and habitat quality (De Bie et al. Reference De Bie, De Meester, Brendonck, Martens and Goddeeris2012). Long-range dispersal at continental or larger scales can operate over centuries and millennia, and even longer timescales, such as that underlying the migration of species before and after the Pleistocene glaciation (Buck & Goffinet Reference Buck, Goffinet, Goffient and Shaw2000, Biersma et al. Reference Biersma, Jackson, Hyvönen, Koskinen, Linse, Griffiths and Convey.2017). With their typically numerous small spores, bryophytes are considered more capable of utilizing wind dispersal than vascular plants on a continental scale (During & Lloret Reference During and Lloret2001, Muñoz Reference Muñoz, Felicísimo, Cabezas, Burgaz and Martínez2004), although in Antarctica in particular sporophyte production is much reduced or absent in many (but not all) species (Smith & Convey Reference Smith and Convey2002).
Abiotic factors, such as soil temperature and humidity, freeze-thaw cycling, periglacial processes affecting soil stability, soil or rock properties and type, permafrost active-layer properties, pedogeomorphological conditions and wind erosion, strongly influence the occurrence and development of vegetation (Thomas et al. Reference Thomas, Fogg, Convey, Fritsen, Gilli and Gradinger2008, Michel et al. Reference Michel, Schaefer, Poelking, Simas, Fernandes Filho and Bockheim2012). While Antarctica's chronically low temperatures are widely appreciated, the most important influence on its biodiversity is through the availability of liquid water (Kennedy Reference Kennedy1993, Convey et al. Reference Convey, Chown, Clarke, Barnes, Bokhorst and Cummings2014). Many studies have shown that the distribution of Antarctic moss communities is strongly correlated with the availability of water (e.g. Matsuda Reference Matsuda1963, Reference Matsuda1968, Kobayashi Reference Kobayashi1974, Nakanishi Reference Nakanishi1977, Shimizu Reference Shimizu1977, Yamanaka & Sato Reference Yamanaka and Sato1977, Robinson et al. Reference Robinson, Wasley, Popp and Lovelock2000).
Various topographical factors favour some vegetation species and hinder the proliferation of others, playing an essential regulatory role in vegetation distribution. Higher-altitude soils have lower levels of soil humidity in comparison with other areas due to the drying action of strong winds and the lack of nutrient contributions from other geomorphological units (Ruiz-Fernández et al. Reference Ruiz-Fernández, Oliva and García-Hernández2017). Exposure to wind directly influences water loss in bryophytes, and many acrocarp mosses grow as ‘tight cushions’, reducing the surface area/volume ratio as well as taking advantage of the surface boundary layer and, hence, reducing water loss (Glime Reference Glime and Glime2017).
Biotic factors also influence vegetation development, such as interactions with the soil microbiota (Hogg et al. Reference Hogg, Cary, Convey, Newsham, O'Donnell and Adams2006), the contained invertebrate community (Shortlidge et al. Reference Shortlidge, Carey, Payton, McDaniel, Rosenstiel and Eppley2021) and the transfer of nutrients from the marine environment in sea spray and by marine bird and mammal communities (Mendonça et al. Reference Mendonça, La Scala, Panosso, Simas and Schaefer2010, Bokhorst et al. Reference Bokhorst, Convey and Aerts2019). Animal influences on vegetation can be both positive, such as through fertilization, and negative, such as through trampling and intense local pollution from guano (Smith Reference Smith1972). The distribution of plant communities on King George Island, as elsewhere in Antarctica, shows evidence of zonality, such as along altitudinal gradients or with distance from the coast and from sources of nutrients such as bird and mammal colonies (Kozeretska et al. Reference Kozeretska, Parnikoza, Mustafa, Tyschenko, Korsun and Convey2010).
Admiralty Bay is a large embayment on the southern coast of King George Island and includes several ice-free peninsulas with varied geology and some of the best-developed and most diverse vegetation in the Maritime Antarctic. It includes the important Antarctic Specially Protected Area (ASPA) No. 128 Western Shore of Admiralty Bay. This study set out to document in detail the diversity and distribution of bryophytes in Admiralty Bay and thereby enable the identification of patterns in local diversity and their possible drivers.
Methodology
Study area
The study was conducted in Admiralty Bay (62.09'S, 58.28'W), which is located on the southern coast of King George Island in the South Shetland Islands archipelago, north-west of the Antarctic Peninsula in the Maritime Antarctic (Fig. 1). With the thermal buffering provided by the Southern Ocean, the Maritime Antarctic experiences relatively low variation in atmospheric temperature throughout the year compared to Continental Antarctica (Convey Reference Convey2017). The climate of the South Shetland Islands is characterized by the frequent passage of cyclonic systems, with considerable cloud cover, strong winds and precipitation (Rakusa-Suszczewski et al. Reference Rakusa-Suszczewski, Mietus, Piasecki and Rakusa-Suszczewski1993, Wen et al. Reference Wen, Kang, Xie, Han and Lluberas1994, Bintanja Reference Bintanja and Bintanja1995).
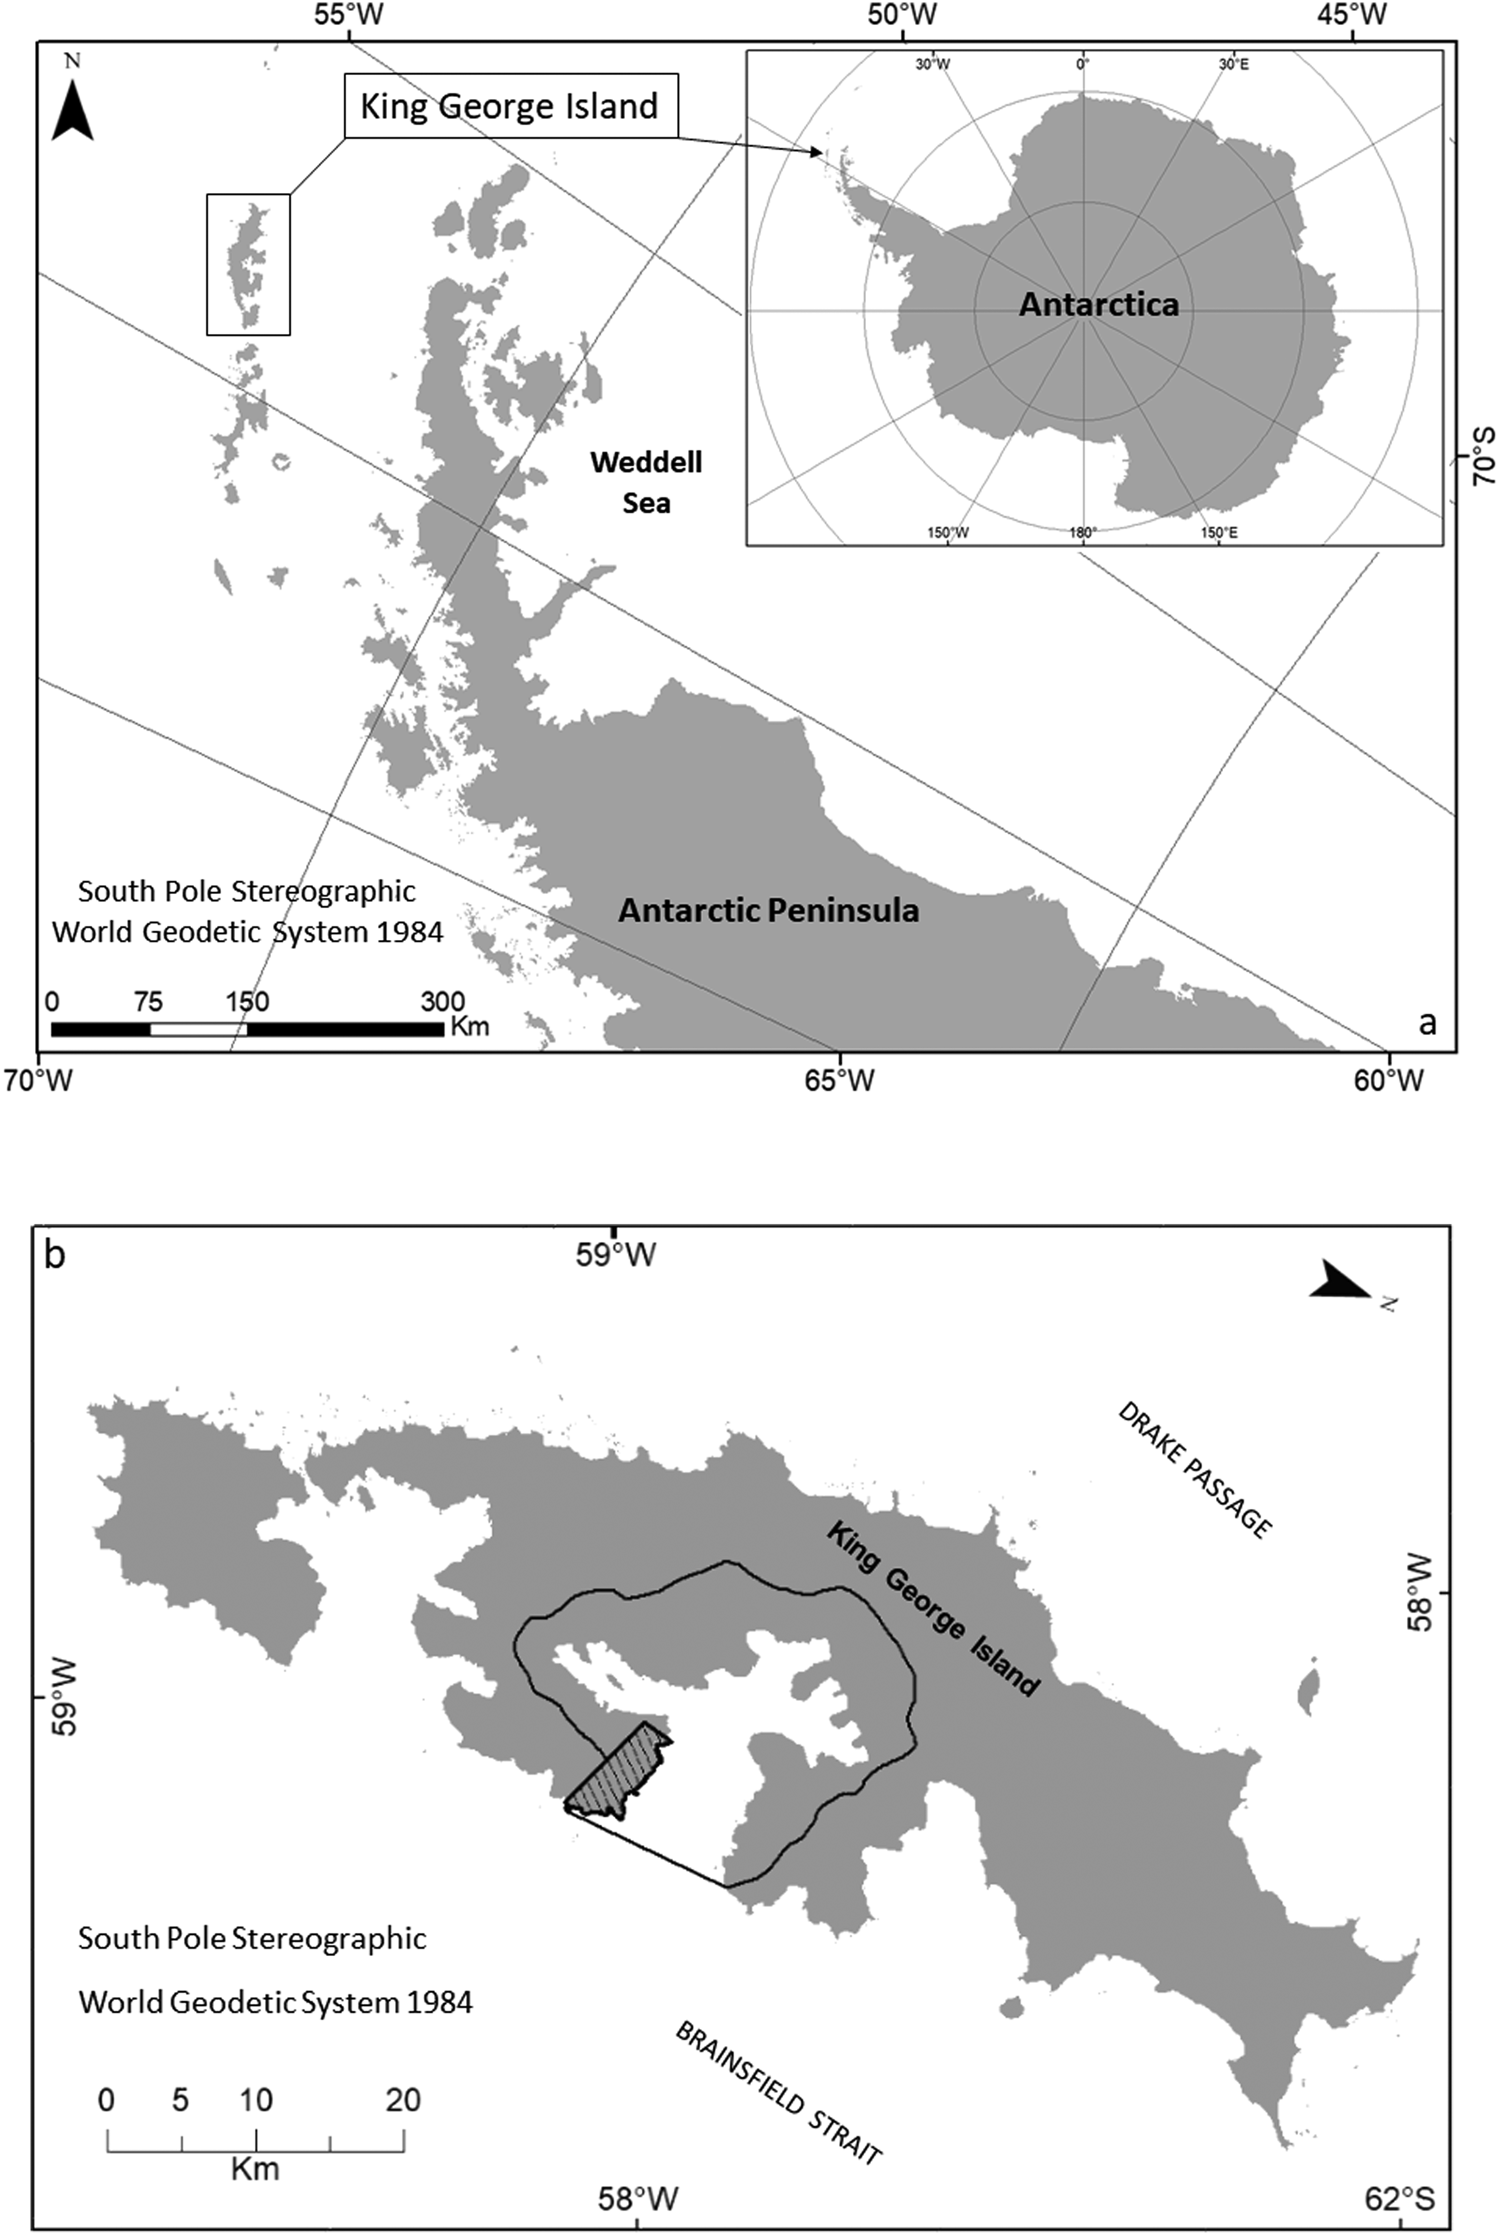
Fig. 1. a. Location of King George Island, situated in the South Shetland Islands archipelago. b. Delimitation of Antarctic Specially Managed Area (ASMA) No. 1 Admiralty Bay (solid line) and Antarctic Specially Protected Area (ASPA) No. 128 - Western Shore of Admiralty Bay (hatched area).
King George Island has a cold oceanic climate and an average annual temperature of -1.88°C to -1.68°C, relative humidity of 89%, precipitation of 437.6 mm water equivalent and 92.7% of its surface is covered by permanent ice (Simões et al. Reference Simões, Bremer, Aquino and Ferron1999). Ice-free areas of limited extent are present only around the island's margins (Croxall Reference Croxall and Laws1984, Moll et al. Reference Moll, Braun and Luberas2005). Admiralty Bay is the largest of the bays on King George Island, with a surface area of 122.08 km2 and coastline of 83.4 km (Rakusa-Suszczewski Reference Rakusa-Suszczewski1980a, Reference Rakusa-Suszczewski1980b, Reference Rakusa-Suszczewski1987, Marsz & Rakusa-Suszczewski Reference Marsz and Rakusa-Suszczewski1987). The degree of shelter provided in the bay results in a very distinct microclimate in comparison with other parts of the island, especially in relation to wind exposure (Smith Reference Smith1972, Putzke & Pereira Reference Putzke and Pereira2001).
Admiralty Bay includes two areas protected through the Convention on Environmental Protection to the Antarctic Treaty: ASPA No. 128 Western Shore of Admiralty Bay and Antarctic Specially Managed Area (ASMA) No. 1 - Admiralty Bay.
Sampling
The data used in this study were obtained from the published literature, in particular Ochyra et al. (Reference Ochyra, Smith and Bednarek-Ochyra2008), from herbarium databases (AAS - British Antarctic Survey, UB - University of Brasilia, KRAM - W. Szafer Institute of Botany, Polish Academy of Sciences), from ‘speciesLink’ (http://splink.cria.org.br/) and from new material collected in Admiralty Bay during the summers of 2013 to 2019 and subsequently deposited in the herbarium UB. A total of 1398 specimens were studied and identified to species level following Ochyra et al. (Reference Ochyra, Smith and Bednarek-Ochyra2008).
A spreadsheet was compiled from all records, including information about family, species, scientific name, collector, collection number, location, latitude and longitude. Data were quality controlled, whenever possible validating coordinates using Google Earth Pro v. 7.1.8 software. Records lacking identifiable locations and duplicate records were excluded. For taxonomic validation of newly collected specimens a search was made in recent publications and synonyms were validated using Tropicos (www.tropicos.org).
Data analyses
The data were overlain on a map using the software QGis ® v. 3.0.3 to visualize the distribution of records in Admiralty Bay. This allowed for identification of areas that were deficient in sampling, which were then specifically targeted in fieldwork during the summer of 2019.
Using DIVA-GIS v. 7.5 (www.diva-gis.org), a grid of 0.01° × 0.01° was created, giving a grid cell area of ~1 km2 and a total of 116 grid cells. This is consistent with the spatial resolution recommended by Chapman et al. (Reference Chapman, Muñoz and Koch2005) for the analysis of environmental models. A linear regression between the number of collections (records) and species richness was computed to identify any relationship between the two. To assess the number of moss species records available across the 116 identified grid cells in Admiralty Bay, five categories were adopted. These categories documented, respectively, confirmed records in 1–18 grid cells, followed by 19–36, 37–53, 54–71 and 72–89. Moss species richness in individual grid cells was also classified into five categories, these being: ‘very low’ (1–4 species per cell), ‘low’ (5–9), ‘medium’ (10–13), ‘high’ (14–18) and ‘very high’ (19–22).
For the purposes of this study, Admiralty Bay was separated into four geological areas, following Barton (Reference Barton1965) (Fig. 2). These were characterized as 1) the ‘black’ group, with the occurrence of Jurassic volcanic rocks, 2) the ‘red’ group, with the occurrence of Cenozoic lavas (andesites), 3) the ‘blue’ group, also with the occurrence of Cenozoic lavas (andesites), and 4) the ‘green’ group, with olivine-basaltic rocks. These groups are characterized by their age of formation, with the black group originating in the Upper Jurassic, the red group in the Miocene, the blue group in the Upper Cretaceous and the green group in the Pleistocene.
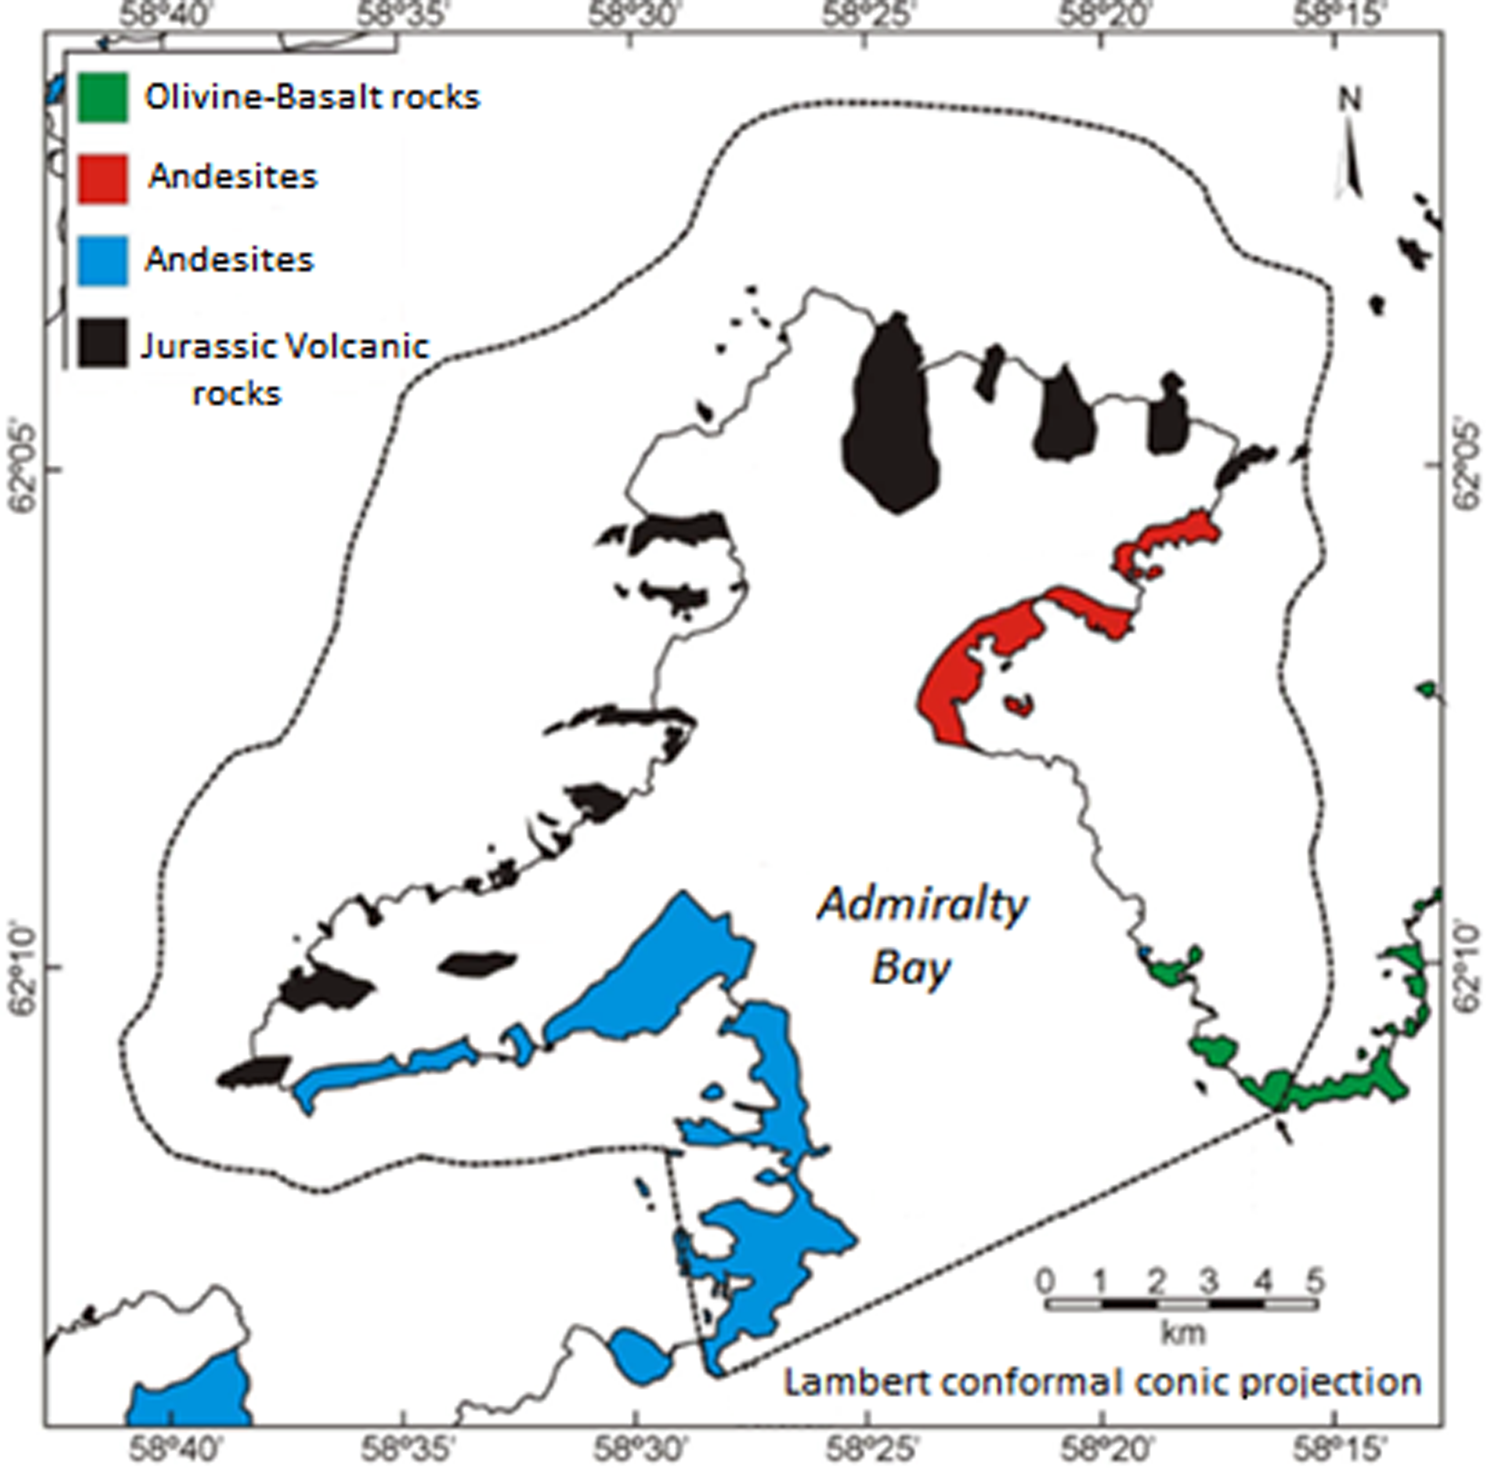
Fig. 2. Geological map of Antarctic Specially Managed Area (ASMA) No. 1 Admiralty Bay. The ASMA boundary is indicated by the dotted line. Map based on Barton (Reference Barton1965) and Birkenmajer (Reference Birkenmajer1980).
To analyse floristic diversity patterns within Admiralty Bay, a matrix was constructed based on the presence (1) or absence (0) of each recorded species in each grid cell. We defined areas that were similar based on abiotic characteristics (geology) and biotic influence (presence of penguin colonies). For the similarity analysis based on geology, four areas within the bay were defined, assigned codes area 1 (G1) to area 4 (G4), based on the geological regions described above (Barton Reference Barton1965) (Fig. 2). For the similarity analysis based on the presence or absence of penguin influence, two areas were defined: A1 (biotic influence) and A2 (no influence), which were delimited from the Operational Land Image (OLI)/Thermal Infrared Sensor (TIRS) image Landsat 8/2014 RGB (bands 5 4 3 infrared composite) (Sotille et al. Reference Sotille, Bremer, Vieira, Vehlo, Petsch and Simões2020), where the colouring reflected from this composition was used to locate the area of the penguin influence using QGis® v 3.0.3 software. In addition, the area of penguin influence was also visually identified during the field survey, corroborating the RGB composition. Cluster analysis was then performed in order to identify any relationship between species composition and the biotic and abiotic factors, first using the Sørensen coefficient, which gives more weight to shared species (Magurran Reference Magurran2011), and then using the method of the group of pairs using weighted arithmetic means in order to create a dendrogram using the weighted pair group method with arithmetic mean (WPGMA) (Valentin Reference Valentin2012) with R software (R Development Core Team 2013) and the following packages: 1) Vegan (https://CRAN.R-project.org/package=vegan) for the ordering of communities and vegetation, 2) APE (Paradis et al. Reference Paradis, Claude and Strimmer2004), which uses functions for reading and plotting dendrogram trees, 3) ade4 (Dray & Dufour Reference Dray and Dufour2007), which provides tools for multivariate data analysis, iv) phangorn (Schliep Reference Schliep2010), which contains methods for the estimation of dendrogram trees, v) ggdendro (de Vries & Ripley Reference De Vries and Ripley2015), to extract the plot data for dendrograms, and vi) ggplot2 (Wickham Reference Wickham2016), which is a system for creating graphics using the ‘McQuitty’ method (McQuitty Reference McQuitty1964), which is the average of the cluster's distances, not considering the number of points in that cluster.
Results
Floristic survey
Combining data extracted from the literature, herbarium databases, speciesLink and surveys and collections carried out in Admiralty Bay between 2013 and 2018, as well as the targeted surveys of locations with low sampling intensity in 2019, a total of 1398 individual species records were identified from Admiralty Bay (Fig. 3 & Table I), representing 63 moss species (Table II).
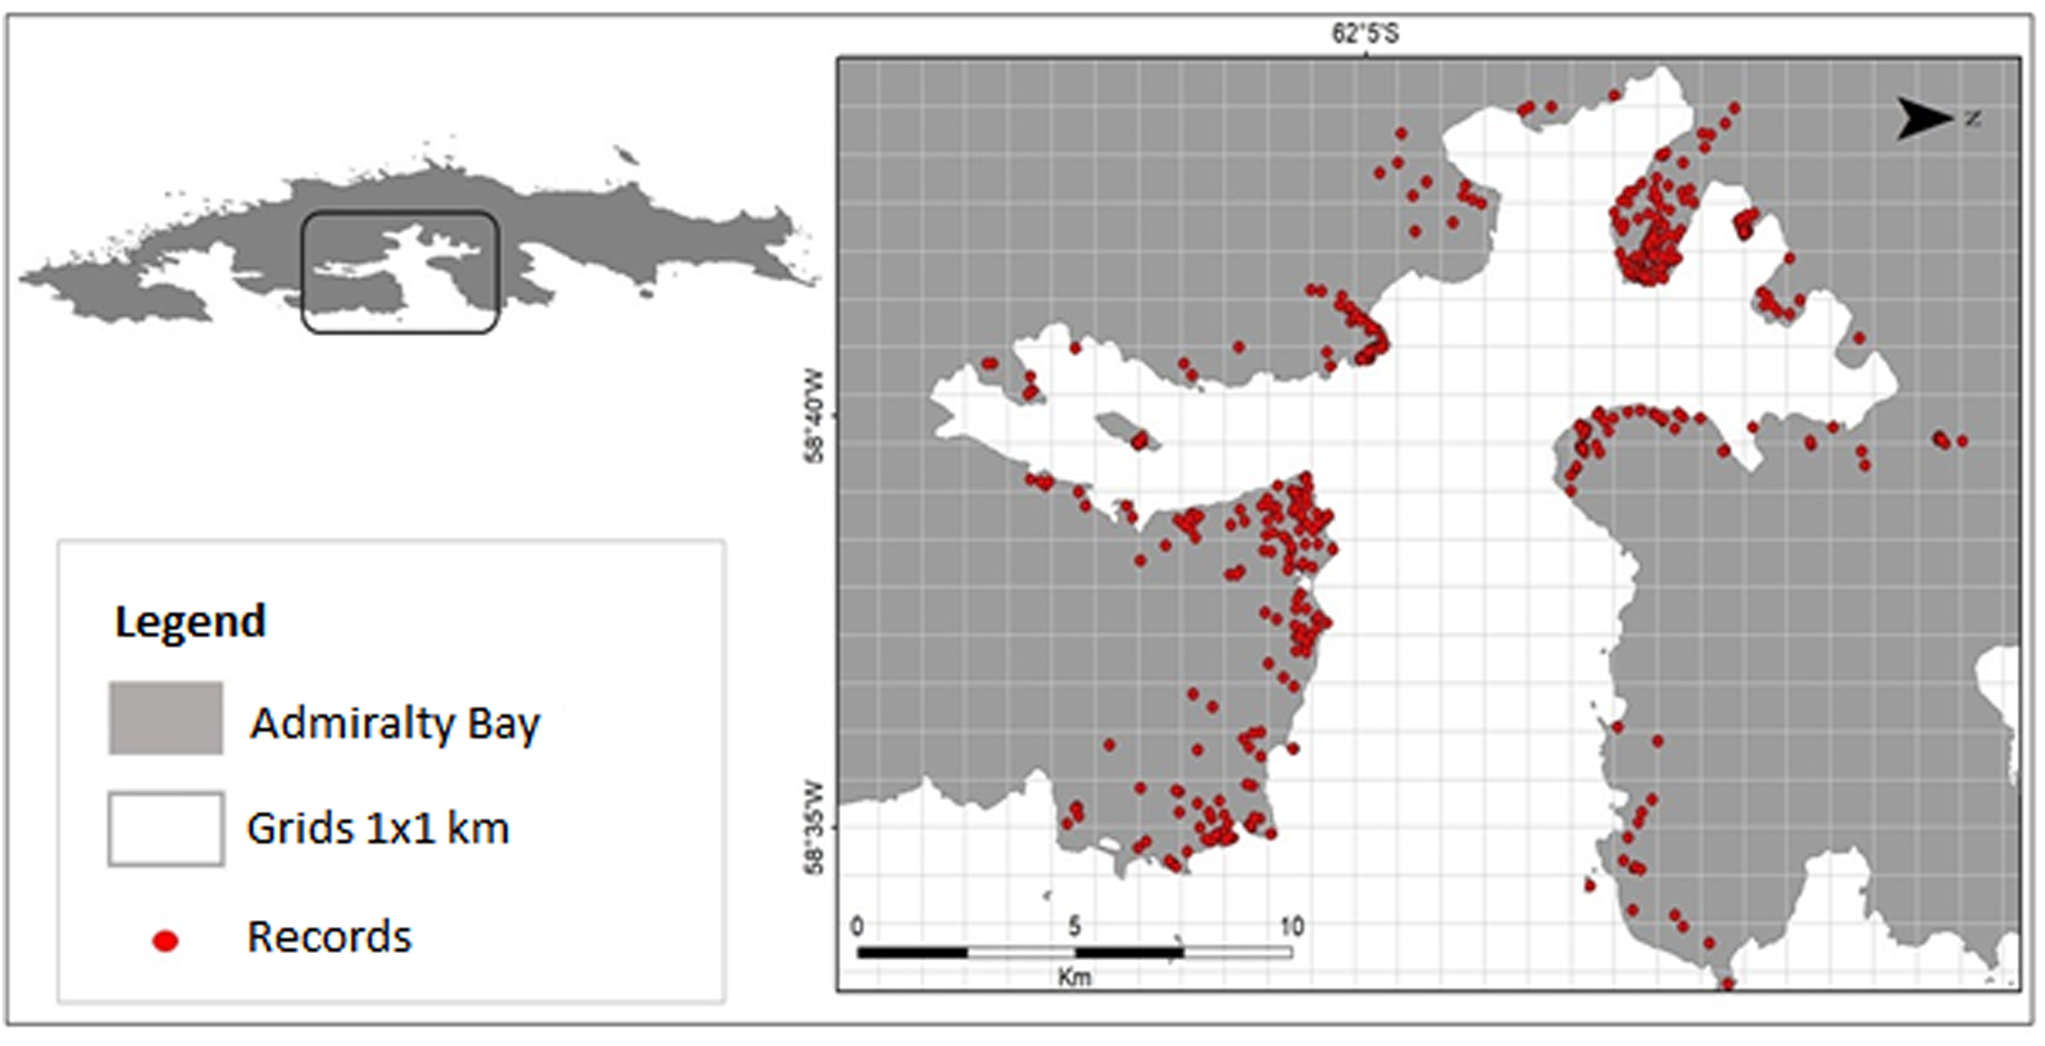
Fig. 3. Locations of moss records identified in Admiralty Bay.
Table I. Numbers of moss records from Admiralty Bay obtained from the different sources examined.
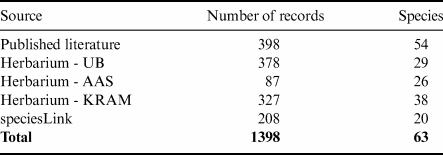
AAS = British Antarctic Survey; KRAM = W. Szafer Institute of Botany, Polish Academy of Sciences; UB = University of Brasilia.
Table II. List of moss species recorded in Admiralty Bay and the number of grid cells (maximum = 116) within which each species was recorded. Species are ranked in order of the number of occupied grid cells.

a New species record for Admiralty Bay.
Of the species recorded, Sanionia uncinata was the most widespread, being recorded in 42 of the 116 grid cells, closely followed by Syntrichia magellanica, Bryum pseudotriquetrum, Andreaea gainii, Bartramia patens and Polytrichastrum alpinum. In an intermediate frequency range (19–6 grid cells), 21 species were found. Of these, Roaldia revoluta was recorded in 19 cells, closely followed by Hennediella antarctica, Andreaea depressinervis, Chorisodontium aciphyllum and Pohlia cruda. Twenty-eight species were rarely recorded (5–1 grid cells), with Pohlia drummondii recorded in five grid cells, closely followed by Pohlia wahlenbergii, Bryum argenteum, Schistidium lewis-smithii and Dicranella campylophylla. Of the 63 species recorded, ~44% (28 species) were present in five or fewer grid cells and ~19% (12 species) were present in only a single cell. A relatively large proportion of species recorded (26/63) were rare or sporadically recorded in Admiralty Bay.
The previous literature included records of 54 moss species from Admiralty Bay, while the ASMA management plan refers to ~58 species. The current study has therefore increased the total number of species recorded to 63 species, representing 34 genera and 17 families present in ASMA 1 (Tables I & II).
The progressive increase in the number of species recorded reflects the increasing extent of survey work completed and the compilation of robust inventories. Of the 63 species present in the ASMA, 55% (~35 species) are present within the ASPA limits.
Species richness
Of the 116 grid cells, 92 represented the first category of species richness, 16 the second, 2 the third, 2 the fourth and 4 the fifth. Of the four cells that were assessed as having the maximum number of moss records (i.e. 72–89), three were located close to the Brazilian ‘Commandante Ferraz’ station and one was located close to the Polish ‘Arctowski’ station (Fig. 4).
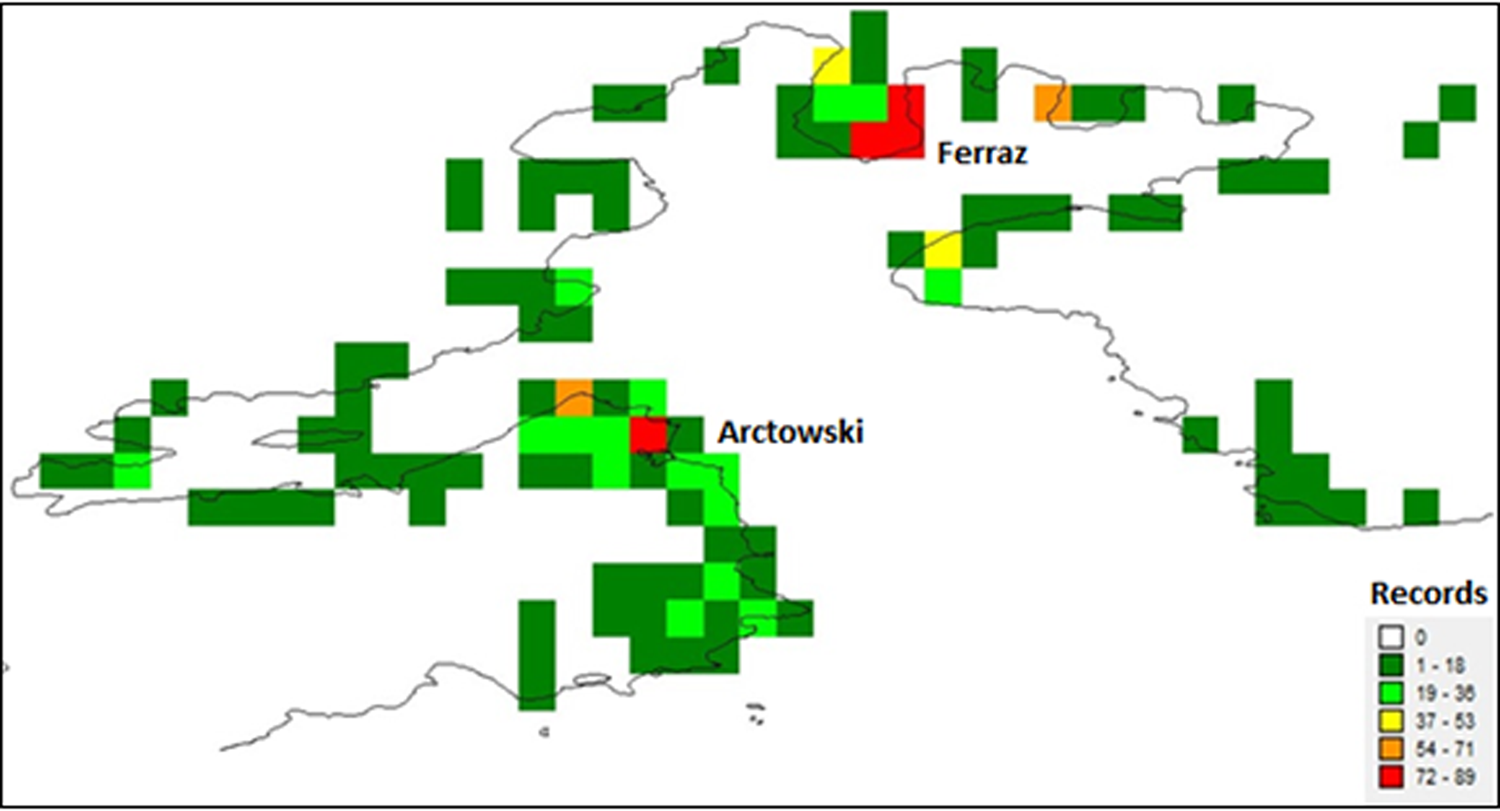
Fig. 4. Quantitative analysis of records per grid cell for Admiralty Bay.
The very low species richness category applied to the majority (64/116) of grid cells. Very high species richness was identified in four grid cells: one on the Keller Peninsula close to the Brazilian Commandante Ferraz station, one at Hennequin Point and the remaining two at Jardine Peak, Ezcurra Inlet, close to the Polish Arctowski station (Fig. 5).
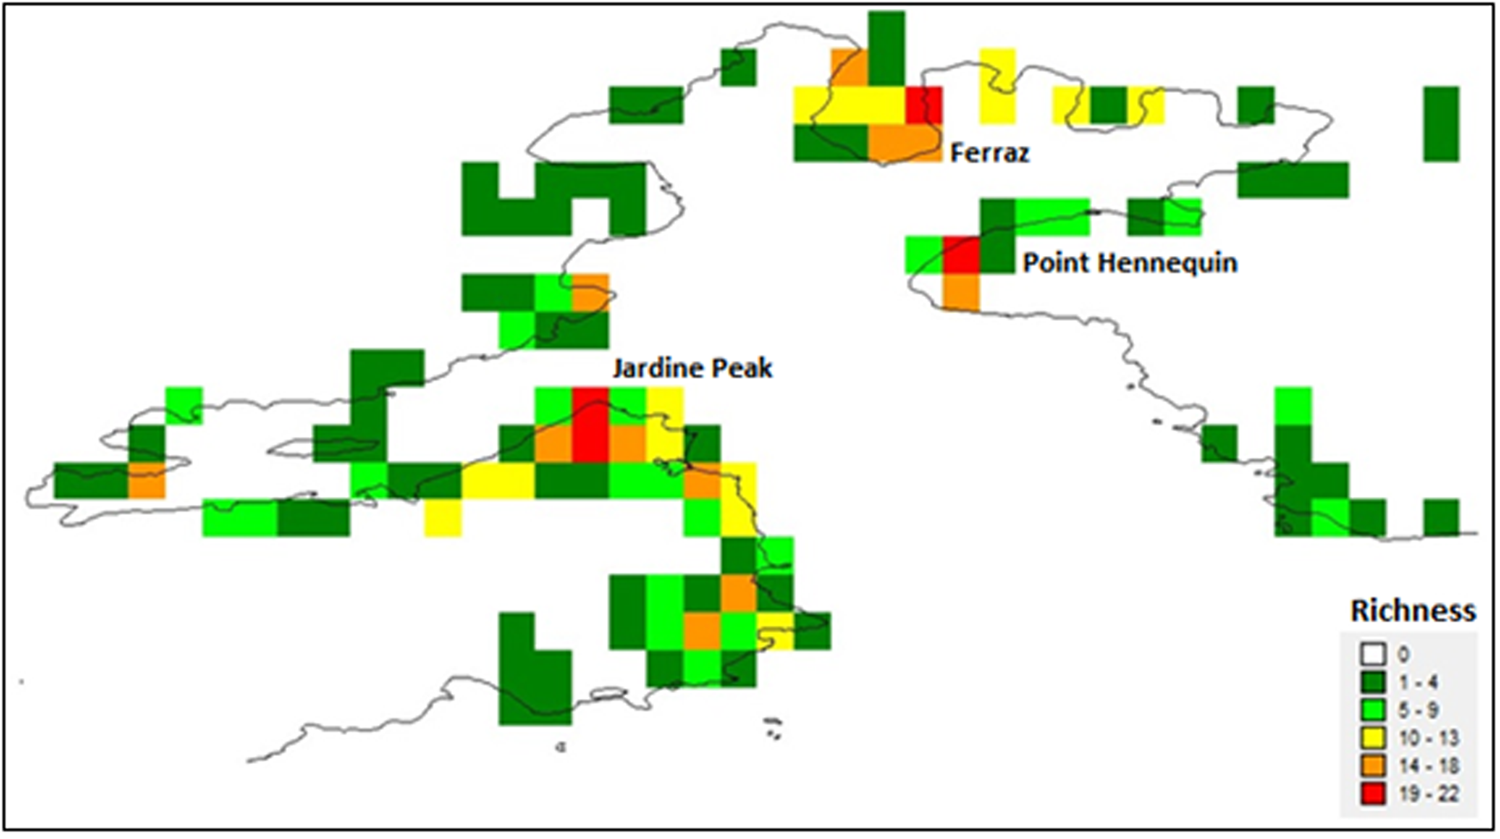
Fig. 5. Quantitative analysis of richness for Admiralty Bay.
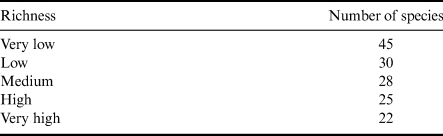
Based on the 63 species recorded in this study, the four cells with very high species richness contained a total of 22 species, ~35% of the total species richness recorded in Admiralty Bay. This highlights that the overall moss diversity was not simply concentrated in only the most species-rich locations, but was more widely dispersed around the bay (Table III).
Table III. Total number of moss species found in the cells classified for each richness group and the cumulative total of species.
Sample sufficiency
The correlation between the number of records and the observed richness for the entire bay is shown in Fig. 6. The R 2 value represents the proportion of variability in the dependent variable (Richness) that is explained by the independent variable (Records). The logarithmic regression showed an R 2 value of 0.75 (Fig. 6).
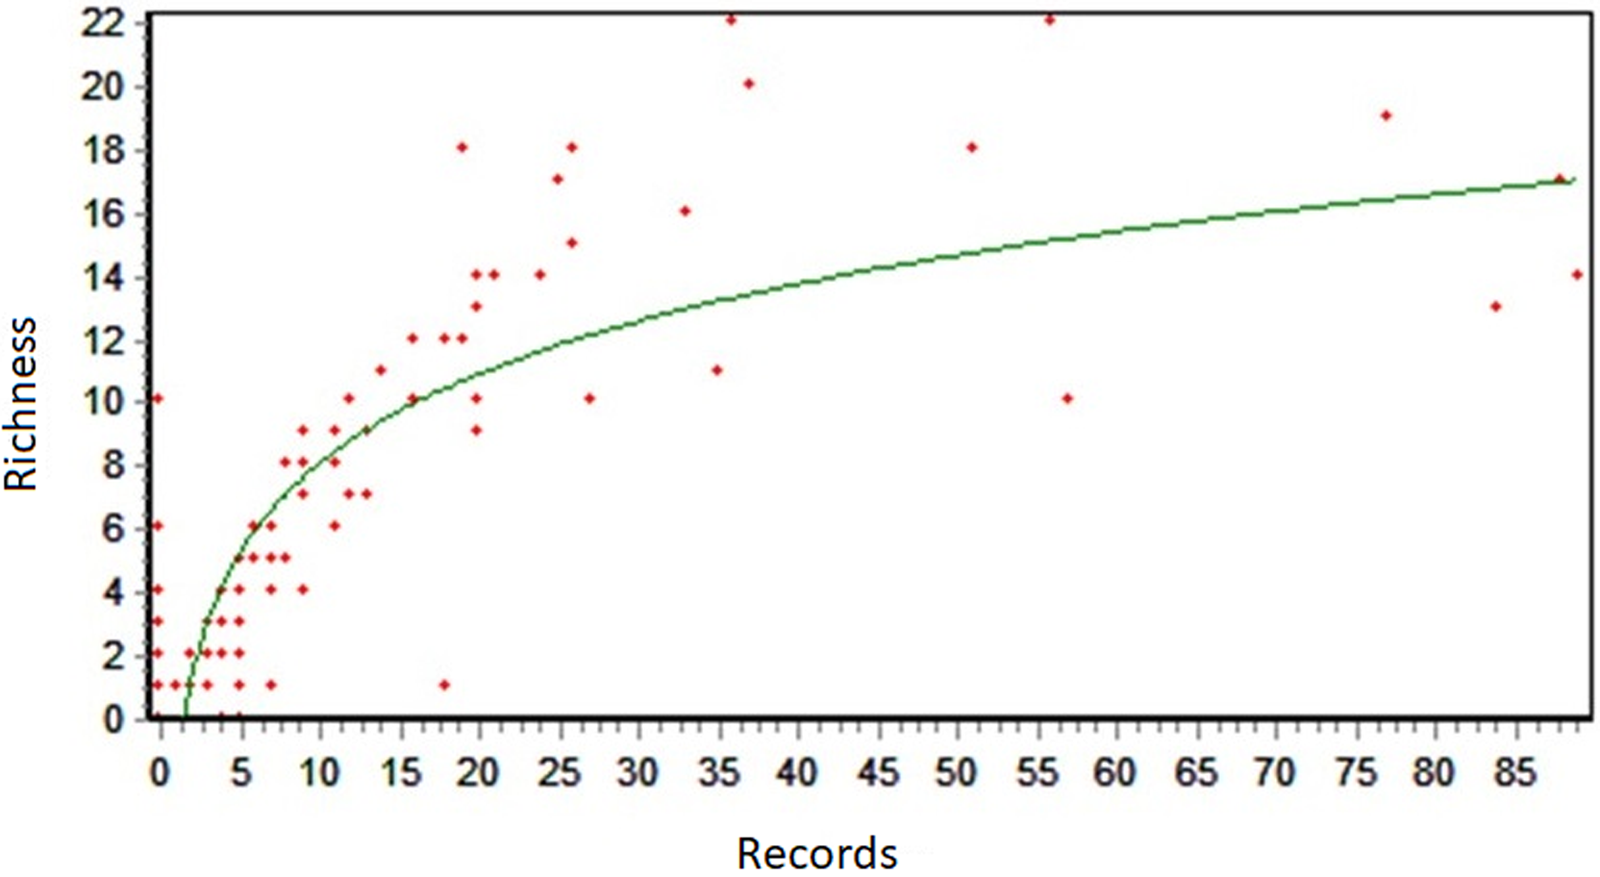
Fig. 6. Logarithmic regression between the number of collections (records) and the observed richness.
The regressions performed between the number of records and the estimated richness are below the curve, and in some cases there is no relationship between the number of records collected and the highest estimated richness for the bay. This affirmation can be confirmed by the results from the analysis of records (Fig. 4), where some grids that obtained maximum registration did not present ‘high’ or ‘very high’ richness.
Similarity analysis of moss species diversity in relation to underlying geology and ornithogenic influence
To assess whether the presence of penguins influenced moss species diversity in grid cells, two areas were defined. Area 1 was characterized by the presence of penguins (ornithogenic influence) and area 2 was characterized by the absence of penguins, as indicated by the RGB composition (infrared) 5 4 3 from the satellite image Landsat 8/OLI/2014 (Operational Terra Imager) shown in Fig. 7.
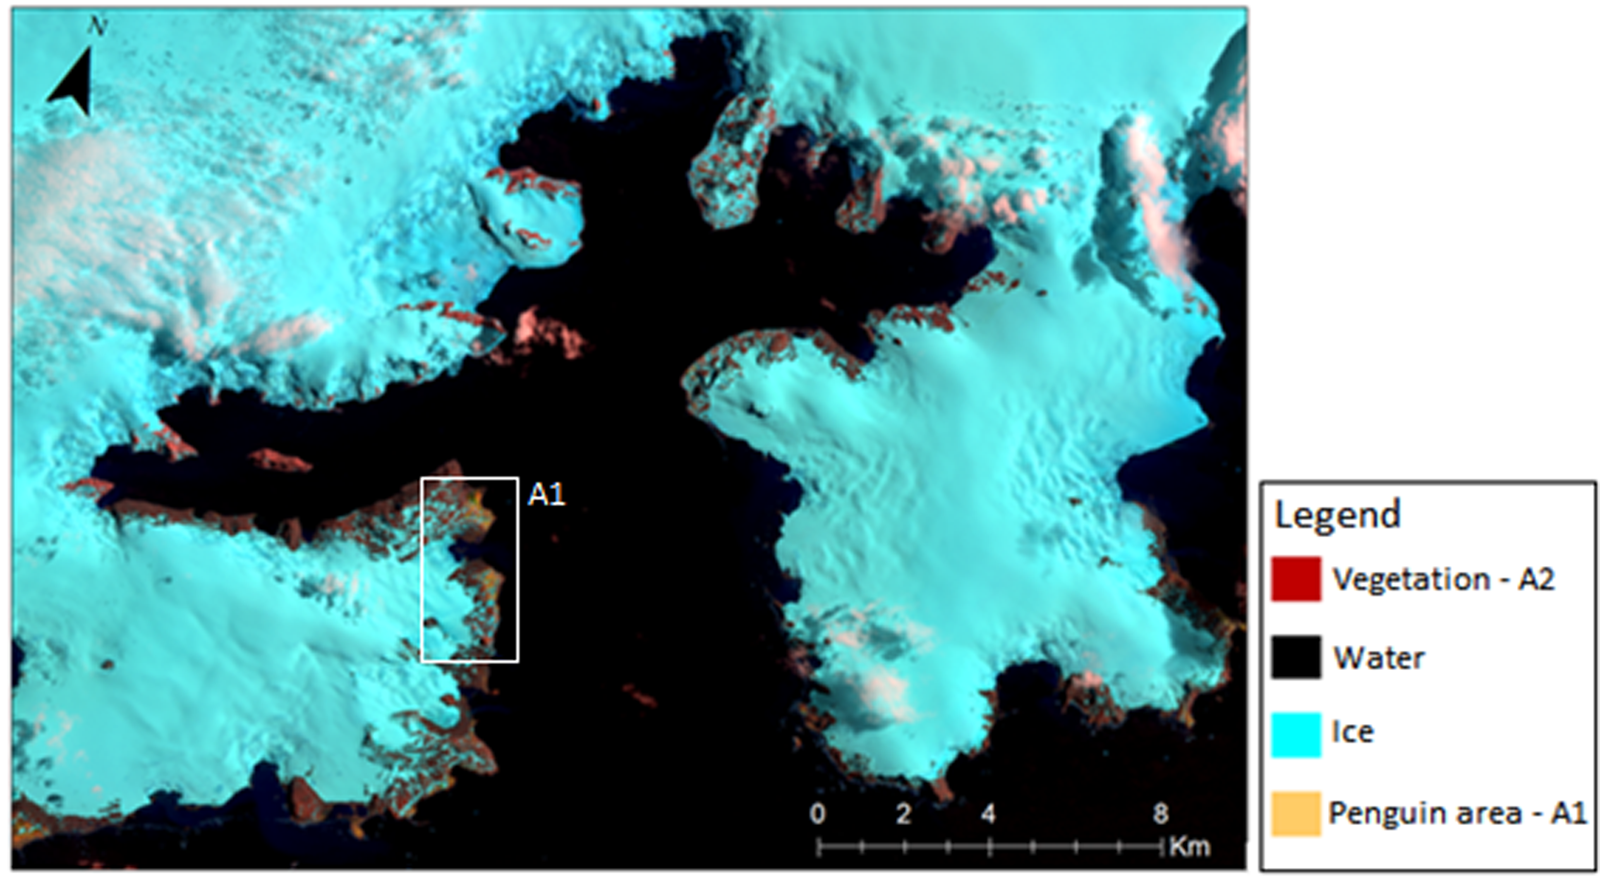
Fig. 7. Infrared RGB composition 5 4 3 for Admiralty Bay - Landsat 8/OLI/2014.
Of the 116 grid cells with at least one moss species record, 24 cells were penguin-influenced (A1) and 92 cells were not penguin-influenced (A2). The Sørensen index was < 0.6, indicating that the two groups of cells shared < 60% of the species recorded in this study. This indicates that there was heterogeneity of the vegetation in relation to ornithogenic influence. From the analysis of similarity between the sample areas based on the composition of moss species, the dendrogram showed a cophenetic correlation coefficient of 0.744, both for similarity analysis based on penguin influence (Fig. 8) and for geological areas (Fig. 9).
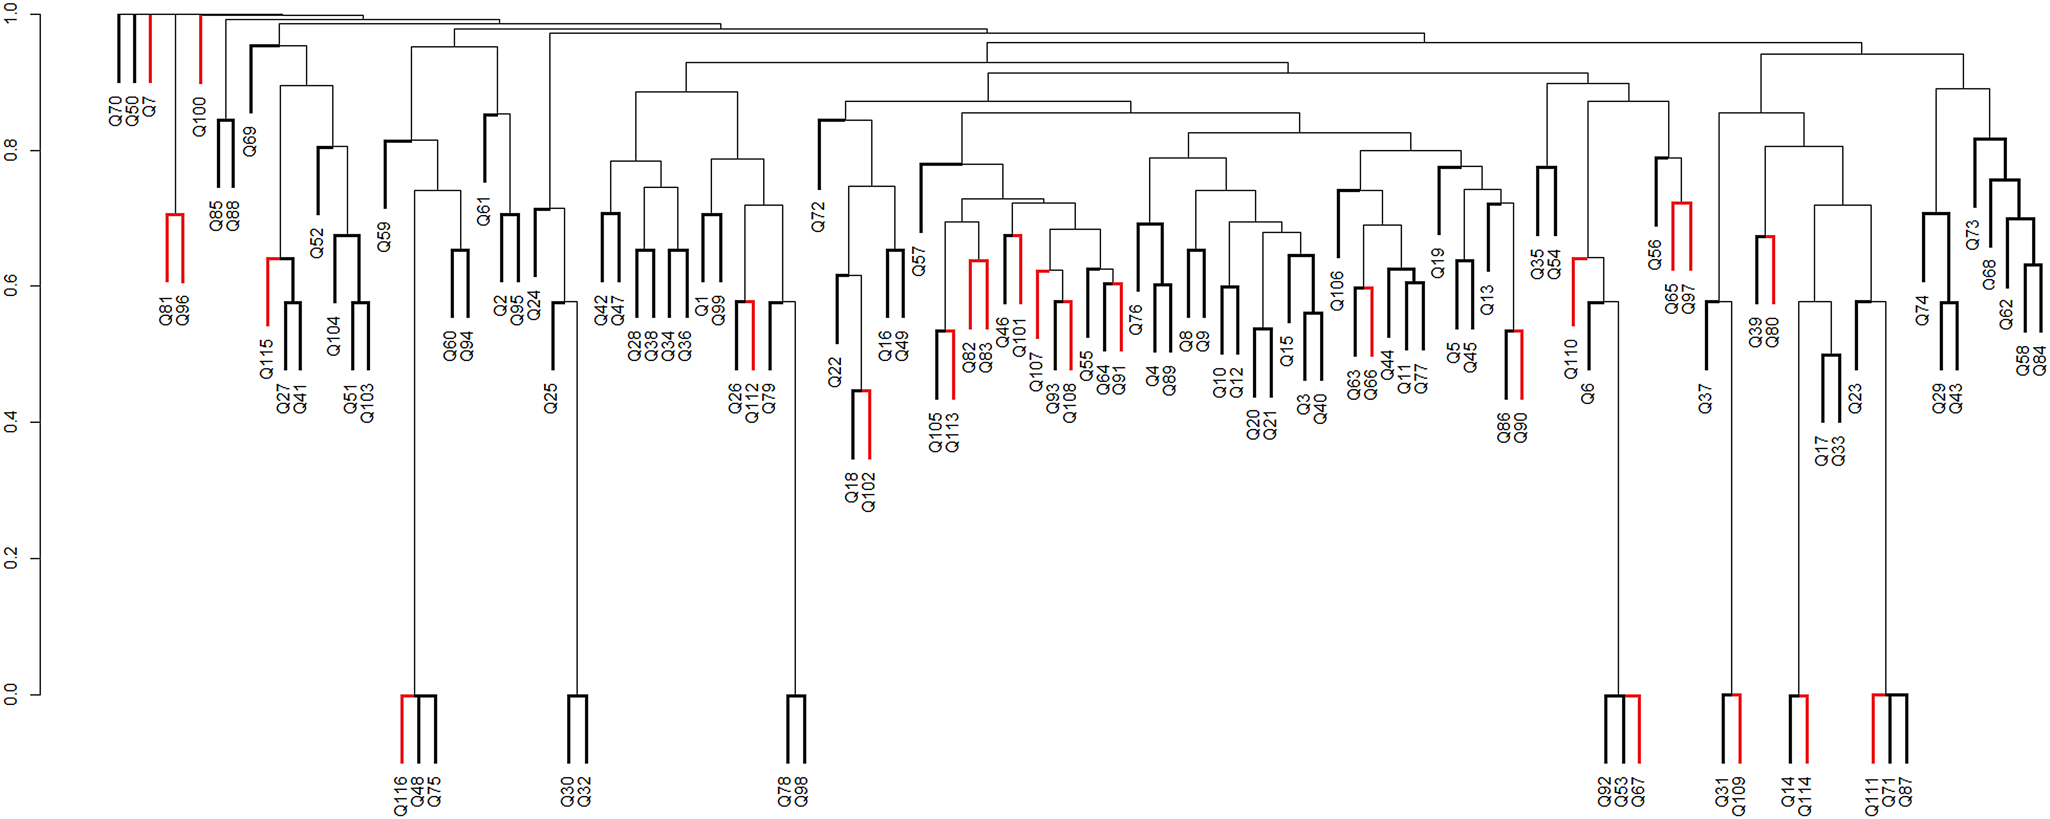
Fig. 8. Dendrogram of similarity between areas influenced by penguins (A1 - termination coloured in red) and those not influenced by penguins (A2 - termination coloured in black), according to species composition per grid cell, using the Sørensen coefficient and the peer group method using weighted arithmetic means (WPGMA). Q (1–116): grid cells filled with species. Cophenetic correlation coefficient: 0.744.
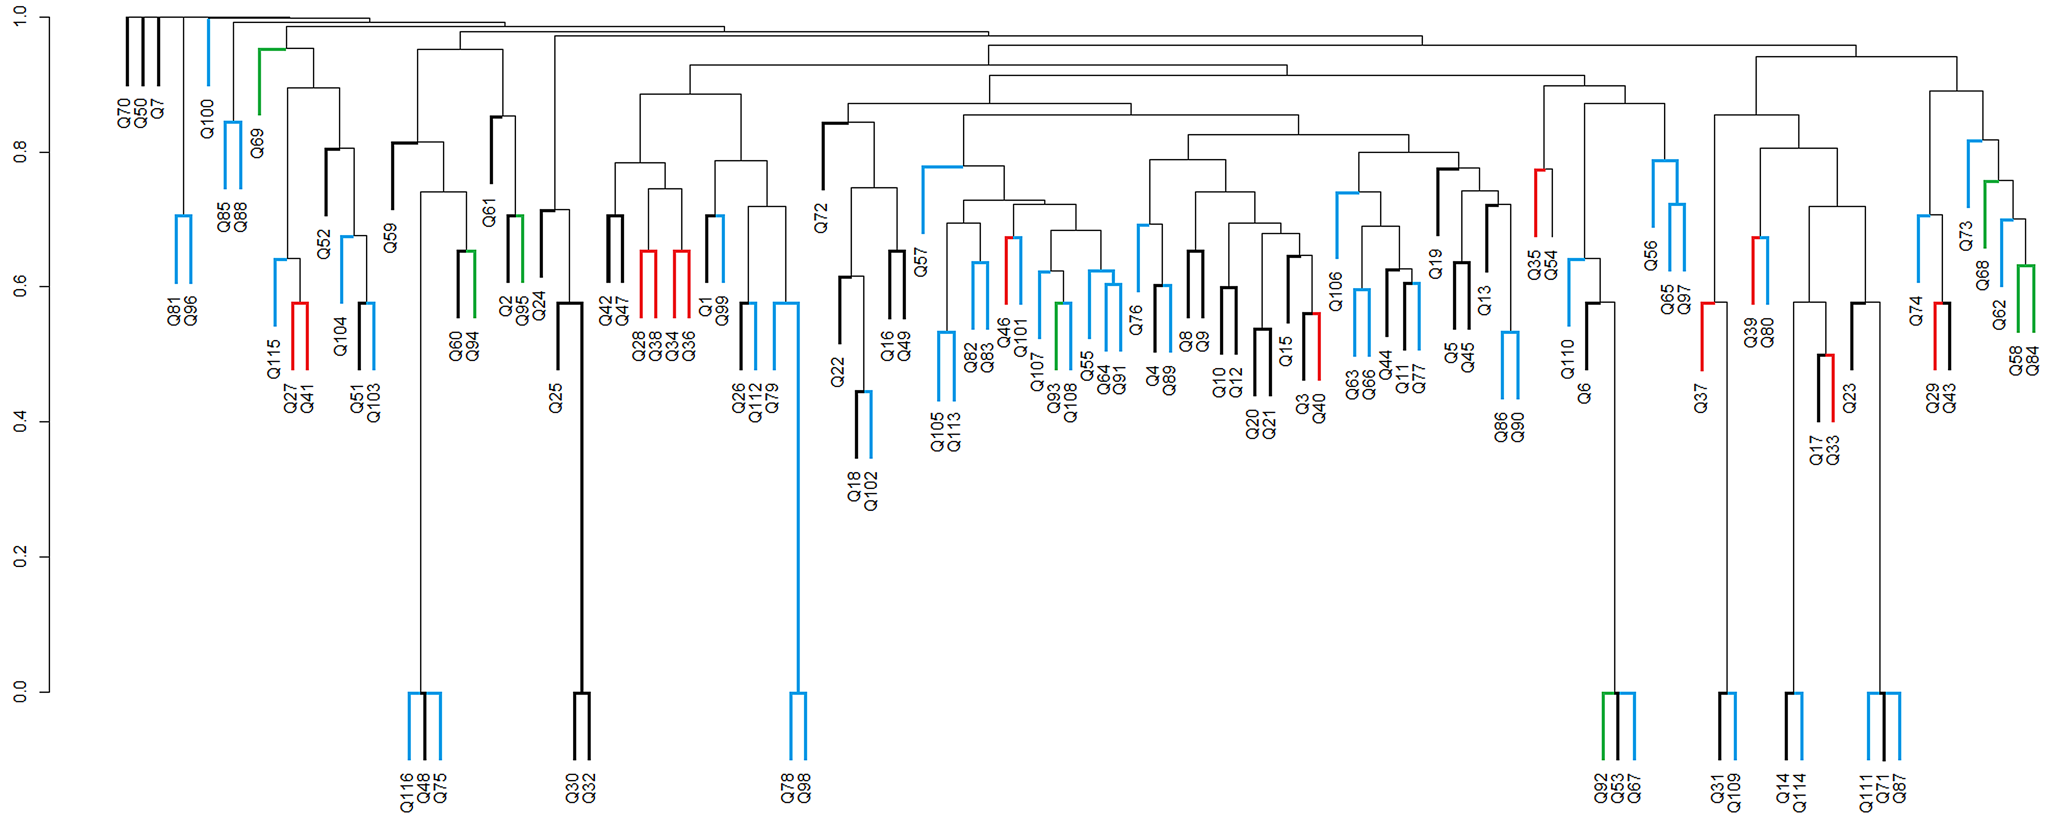
Fig. 9. Dendrogram of similarity between geological areas G1 ('black'), G2 ('red'), G3 ('blue') and G4 ('green') based on moss species presence in each grid cell (Q1–Q116), using the Sørensen coefficient and the peer group method using weighted arithmetic means (WPGMA). Q (1–116): grid cells filled with species. Cophenetic correlation coefficient: 0.744. G1 = Jurassic volcanic rocks; G2 = Cenozoic lavas (andesites); G3 = Cenozoic lavas (andesites); G4 = olivine-basalt rocks.
When assessing the influence of underlying geology on moss species records in grid cells (Fig. 9), among the 116 cells with at least one moss species record, 46 cells represented area G1 ('black’ group), 13 represented G2 ('red’ group), 8 represented G3 ('green’ group) and 49 represented G4 ('blue’ group). There was again a low Sørensen index (0.6) across the four groups, indicating that the moss species were not grouped according to the underlying geology in Admiralty Bay.
Discussion
Floristic survey
The most widely recorded species are unsurprisingly consistent with previous general assessments of the regional moss flora. S. uncinata is considered the most abundant moss on King George Island (Ochyra Reference Ochyra1998). It is a bipolar and alpine species that is widely distributed in Antarctica (Ochyra Reference Ochyra1998), where it occurs in a wide variety of habitats including exposed rocky surfaces, wet locations near streams (Nakatsubo & Ohtani Reference Nakatsubo and Ohtani1992), substrates rich in organic matter, on beaches and coastal terraces and close to bird colonies (Putzke & Pereira Reference Putzke and Pereira2001).
B. pseudotriquetrum is particularly associated with drainage lines formed by seasonal snowmelt in the summer months (Allison & Smith Reference Allison and Smith1973, Kanda Reference Kanda1986). Bryum pallescens has similar habitat requirements to B. pseudotriquetrum but was present in only one grid cell in this study (Kanda & Ohtani Reference Kanda and Ohtani1991). Species such as A. depressinervis, B. patens and Schistidium antarctici are generally found in epilithic habitats, where they may be subject to displacement, either by rock fragmentation (exacerbated by freeze-thaw action) or wind abrasion (Longton Reference Longton1988).
Turner et al. (Reference Turner, Lu, White, King, Phillips and Hosking2016) noted that there was an increase in atmospheric temperature of up to +0.56°C per decade in the western sector of the Antarctic Peninsula during the latter half of the twentieth century. This was accompanied by retreat of ice fronts, increased generation of icebergs, changes in the pattern of precipitation and reductions in seasonal sea ice (Arigony-Neto et al. Reference Arigony-Neto2006). As a result, the availability of liquid water and new ice-free areas increased and, consequently, new areas suitable for colonization by moss species have become available in Admiralty Bay.
Species richness
Grid cells containing very high richness in Admiralty Bay included varied rocky outcrops, characteristic of the initial stages of vegetation succession (Pereira et al. Reference Pereira, Spielmann, Martins and Francelino2007). Antarctic mosses primarily grow on damp soils or rock and can be grouped according to their substrate and hydration preferences (Smith Reference Smith1972, Longton Reference Longton1988). The very high species richness found in grid cells close to the Brazilian and Polish research stations perhaps highlights the general observation that human activities in Antarctica, such as the construction of research stations, tend to focus on the most favourable areas, which are often characterized by higher diversity, thus providing a further human pressure on Antarctic biodiversity (Hughes & Convey Reference Hughes, Convey, Ziska and Dukes2014, Hughes et al. Reference Hughes, Convey, Vega, Aragón, Olalla-Tárraga and Pertierra2019).
Admiralty Bay is a region of great environmental, historical, scientific and aesthetic value. As with many parts of Antarctica, but particularly the region of the north-west Antarctic Peninsula and South Shetland Islands, human presence and activity have increased in recent years. Various studies have warned of the potential negative impacts of increasing scientific and tourism activity, further facilitated by synergy with rapid regional climate change, with vegetation being particularly sensitive to destruction (Tin et al. Reference Tin, Fleming, Hughes, Ainley, Convey and Moreno2009, Chown et al. Reference Chown, Huiskes, Gremmen, Lee, Terauds and Crosbie2012, Tejedo et al. Reference Tejedo, Pertierra, Benayas, Convey, Justel and Quesada2012, Convey & Peck Reference Convey and Peck2019). This damage derives from various mechanisms, including direct trampling (Pertierra et al. Reference Pertierra, Lara, Tejedo, Quesada and Benayas2013), the overall scale of the footprint of human activity (Pertierra et al. Reference Pertierra, Hughes, Vega and Olalla-Tárraga2017) and the areal extent of the built environment directly incorporated within stations (Brooks et al. Reference Brooks, Jabour, van den Hoff and Bergstrom2019). Furthermore, low rates of energy flow and nutrient cycling, associated with the slow development of moss communities, exacerbate the sensitivity of these ecosystems to disturbance (Walker et al. Reference Walker, Reid, Arnould and Croxall1997), leading to extended recovery times and highlighting the need for conservation not only within protected area boundaries but throughout the entire bay.
Similarity analysis of moss species diversity in relation to underlying geology and ornithogenic influence
Penguins, other seabirds and marine mammals deposit large amounts of faeces (guano) and other biological materials into the terrestrial environment, influencing soils throughout the Maritime Antarctic (Guo et al. Reference Guo, Wang, Li, Rosas, Zang and Ma2018, Bokhorst et al. Reference Bokhorst, Convey and Aerts2019). These soils are characterized by high organic matter content in a mineral matrix rich in phosphate (Michel et al. Reference Michel, Schaefer, Poelking, Simas, Fernandes Filho and Bockheim2012). They have a pH that varies from 3.8 to 5.8, and they also have high levels of nitrogen (Michel et al. Reference Michel, Schaefer, Poelking, Simas, Fernandes Filho and Bockheim2012). The levels of trampling and over-fertilization within vertebrate concentrations such as penguin colonies typically preclude vegetation development, although such areas can promote the growth of ornithocoprophilous species that are tolerant to the concentrated supply of guano such as the foliose alga Prasiola crispa (Lightfoot) Menegh. (Chlorophyta) (Longton Reference Longton1988). Less impacted areas adjacent to colonies and previous colony areas that have been abandoned can support strong vegetation development, which can lead to almost complete ground cover (Tatur Reference Tatur1989, Rakusa-Suszczewski et al. Reference Rakusa-Suszczewski, Jażdżewski, Myrcha and Olech1998). Bokhorst et al. (Reference Bokhorst, Convey and Aerts2019) suggest that the detectable influence of marine vertebrate fertilization on terrestrial biodiversity can extend at least several hundred metres from colony boundaries.
Accepting that the moss diversity currently present in Admiralty Bay has successfully overcome the environmental filters controlling colonization and establishment, it is probable that the species present share characteristics that allow them to survive and reproduce effectively in this environment (Belyea & Lancaster Reference Belyea and Lancaster1999, Funk et al. Reference Funk, Cleland, Suding and Zavaleta2008). However, our data suggest that two potentially important environmental influences (ornithogenic influence and underlying geology) in practice exert limited influence on the moss community assembly in Admiralty Bay.
Ecological niche theory predicts that the co-occurrence of species that use resources in a closely similar way is improbable (Funk et al. Reference Funk, Cleland, Suding and Zavaleta2008). However, it is thought that bryophytes need few resources (water and small amounts of nutrients) to colonize a given environment (Buck & Goffinet Reference Buck, Goffinet, Goffient and Shaw2000). Therefore, it may be assumed that inter-specific competition between mosses (Grace & Tilman Reference Grace and Tilman1990) in Maritime Antarctic habitats such as those of Admiralty Bay is low, meaning that competitive exclusion is improbable. It has previously been noted that Antarctic plant communities do not show features of classical succession processes (Smith Reference Smith and Laws1984, Longton Reference Longton1988), and, more generally, abiotic constraints are considered to exert far greater influence on biological processes and biodiversity than do biotic features such as competition (Convey Reference Convey1996, Hogg et al. Reference Hogg, Cary, Convey, Newsham, O'Donnell and Adams2006, Convey et al. Reference Convey, Chown, Clarke, Barnes, Bokhorst and Cummings2014).
A range of other environmental factors can act as filters that considerably restrict the occurrence of vegetation, such as soil temperature and water content, the length of summer thaw and winter freeze periods, snow cover and its influence on microhabitat conditions and pedogeomorphological conditions, such as surface stability, soil type and wind abrasion (Michel et al. Reference Michel, Schaefer, Poelking, Simas, Fernandes Filho and Bockheim2012, Convey et al. Reference Convey, Coulson, Worland and Sjöblom2018). A key abiotic driver of Antarctic terrestrial biodiversity is the availability of liquid water (Rudolph Reference Rudolph and Quam1971, Kennedy Reference Kennedy1993, Convey et al. Reference Convey, Chown, Clarke, Barnes, Bokhorst and Cummings2014). According to Simas et al. (Reference Simas, Schaefer, Albuquerque Filho, Francelino, Fernandes Filho and da Costa2008), in a study of the soils of Admiralty Bay, recognized four different types of soils, characterized as basaltic/andesitic soils, acid sulphate soils, weakly ornithogenic and ornithogenic. The distribution of these soils across different parts of Admiralty Bay highlights the habitat heterogeneity present in the bay.
Conclusion
The data obtained in this study did not support a hypothesis that the potential selective filters tested (ornithogenic influence, underlying geology) would be important drivers of community assembly in Admiralty Bay, leading us to conclude that other environmental factors and their interactions are more significant. Future research will also need to further consider the spatial scale of the survey and environmental data available for identifying distribution patterns.
The data obtained in the current study emphasize the importance of a properly formulated network of representative ASPAs with a focus on vegetation, in this case confirming that ASPA 128 includes > 55% of the moss species recorded throughout Admiralty Bay. Furthermore, 54% of the known moss diversity of Antarctica is present within ASMA 1. Although the Antarctic bryoflora is generally reasonably well known, the quality and even existence of survey information is spatially very variable, even for a highly visited island such as King George Island or at the scale of Admiralty Bay. Detailed knowledge of the local diversity and distribution is a key requirement for the development of effective environmental protection focused on vegetation.
To enable effective management of ASMA 1, ASPA 128 and other protected/managed areas, robust assessments of the local ecosystems and all elements of their biodiversity are necessary to assist in the decision-making processes mandated under the Antarctic Treaty System, one of whose founding principles is the preservation of the Antarctic ecosystem.
Supplemental material
Two supplemental tables will be found at https://doi.org/10.1017/S0954102021000614.
Acknowledgements
We thank the botany postgraduate programme at the University of Brasilia and the Brazilian Antarctic Program (PROANTAR) for the opportunity to conduct research in the Antarctic, the Brazilian Navy for logistical support and the personnel of the Polish ‘Arctowski’ Antarctic station and Brazilian ‘Commandante Ferraz’ station for supporting the research team. We thank Dr Luis R. Pertierra and an anonymous reviewer for their constructive suggestions.
Financial support
This project was funded by CNPq (Conselho Nacional de Pesquisa – Brazil; MEC/MCTI/CAPES/CNPq/FAPs).
Author contributions
BGCS, ETA, MC-S, PEASC: fieldwork. BGCS, ETA: analysis of spatial data. BGCS, PC, ETA: manuscript writing. PEASC, MC-S, JP, PC: manuscript revision.


