INTRODUCTION
The Turkish Straits System (TSS) consists of the Istanbul Strait (Bosphorus), the Marmara Sea and the Canakkale Strait (Dardanelles). It serves as a biological corridor, as well as a barrier and/or an acclimatization zone for marine animals in the Black and Mediterranean Seas (Öztürk & Öztürk, Reference Öztürk and Öztürk1996). There are seasonal migrations of pelagic fish, such as anchovies and horse mackerel, between the Black Sea and the Aegean Sea through the TSS (Kocataş et al., Reference Kocatas, Koray, Kaya and Kara1993; Öztürk, Reference Öztürk1995).
There are three cetacean species found in the Strait, namely harbour porpoise (Phocoena phocoena), common dolphin (Delphinus delphis) and bottlenose dolphin (Tursiops truncatus). However, due to the heavy marine traffic and other ecological stressors such as industrial and domestic pollution, overfishing, exotic species, marine accidents, noise and vessel originated pollution in the Istanbul Strait, their migration does not occur regularly (Öztürk & Öztürk, Reference Öztürk and Öztürk1996; Öztürk et al., Reference Öztürk, Öztürk, Algan, Öztürk and Algan2001). Being the only waterway connecting the Black Sea to the Aegean and Mediterranean Seas, the TSS has been proposed as an important cetacean area by ACCOBAMS (Notarbartolo di Sciara & Birkun, Reference Notarbartolo di Sciara and Birkun2010). Furthermore, it has been suggested that Mediterranean common dolphin migrate through the Marmara Sea and the Istanbul Strait into the Black Sea each spring and back to Aegean in autumn (Berkes, Reference Berkes1977). All three cetacean species have been observed in the TSS mostly in spring and autumn months (Öztürk & Öztürk, Reference Öztürk, Öztürk, Evans, Parsons and Clark1997).
Based on shipboard visual surveys, Dede (Reference Dede1999) provided the first estimates for the abundance of the bottlenose dolphins and common dolphins in the TSS. These were 495 (203–1197: 95% confidence interval (CI)) in October 1997 and 168 (184–1186: 95% CI) in August 1998 for bottlenose dolphin, and 773 (292–2050: 95% CI) and 994 (390–2531: 95% CI), at the same times, respectively, for the common dolphin (Dede, Reference Dede1999). More recent shipboard surveys conducted in the Istanbul Strait during 2006–2008 indicated higher sighting rates for all three species in spring months than the rest of the year (Dede et al., Reference Dede, Öztürk, Tonay, Pierce, Philips and Lick2008). Sightings of the above three species were also most frequent in the northern part of the Strait, near the Black Sea exit, where less traffic and a lower human population presumably causes less disturbance for cetaceans (Dede et al., Reference Dede, Öztürk, Tonay, Pierce, Philips and Lick2008; Öztürk et al., Reference Öztürk, Dede, Tonay and Öztürk2009). Dede et al. (Reference Dede, Öztürk, Tonay, Pierce, Philips and Lick2008) reported 387 sightings in 2006 (March–December), with the harbour porpoise being the most commonly observed species (42%), followed by the bottlenose dolphin (39%) and finally the common dolphin (19%). In contrast, bottlenose dolphin was the most frequently observed species (52%) in the 139 sightings between March 2007 and June 2008 reported by Öztürk et al. (Reference Öztürk, Dede, Tonay and Öztürk2009), followed by harbour porpoise (39%) and then common dolphin (9%). Both studies indicated that cetacean sightings were most frequent in spring and autumn.
Effective visual observations are limited to the daytime. Weather conditions such as waves, fog and glare, as well as the direction of sunlight, also have considerable effect on the ability of observers to see the animals. Long-term continuous visual observation can also be very difficult and costly, particularly under the low-density conditions of endangered species (Kimura et al., Reference Kimura, Akamatsu, Wang, Wang, Li, Dong and Arai2009). On the other hand, passive acoustic monitoring is a powerful way to detect presence of many odontocetes (Mellinger et al., Reference Mellinger, Stafford, Moore, Dziak and Matsumoto2007). This is because most species of delphinids and phocoenids frequently produce ultrasonic signals for biosonar, especially during foraging (Au, Reference Au1993; Akamatsu et al., Reference Akamatsu, Teilmann, Miller, Tougaard, Dietz, Wang, Wang, Siebert and Naito2007; Verfuss et al., Reference Verfuss, Miller, Pilz and Schnitzler2009; Rasmussen et al., Reference Rasmussen, Akamatsu, Teilmann, Vikingsson and Miller2012).
Accordingly, a fixed stereo passive acoustic monitoring system was deployed in the Strait half way between the Black and Marmara Seas to monitor the presence of odontocetes in the TSS over a 15-month period. This is the first study to use passive acoustic monitoring for detecting odontocetes in the TSS. The aim of this research was to provide additional information regarding the distribution of odontocetes in the Istanbul Strait, including any seasonal and/or diel patterns in their movements.
MATERIALS AND METHODS
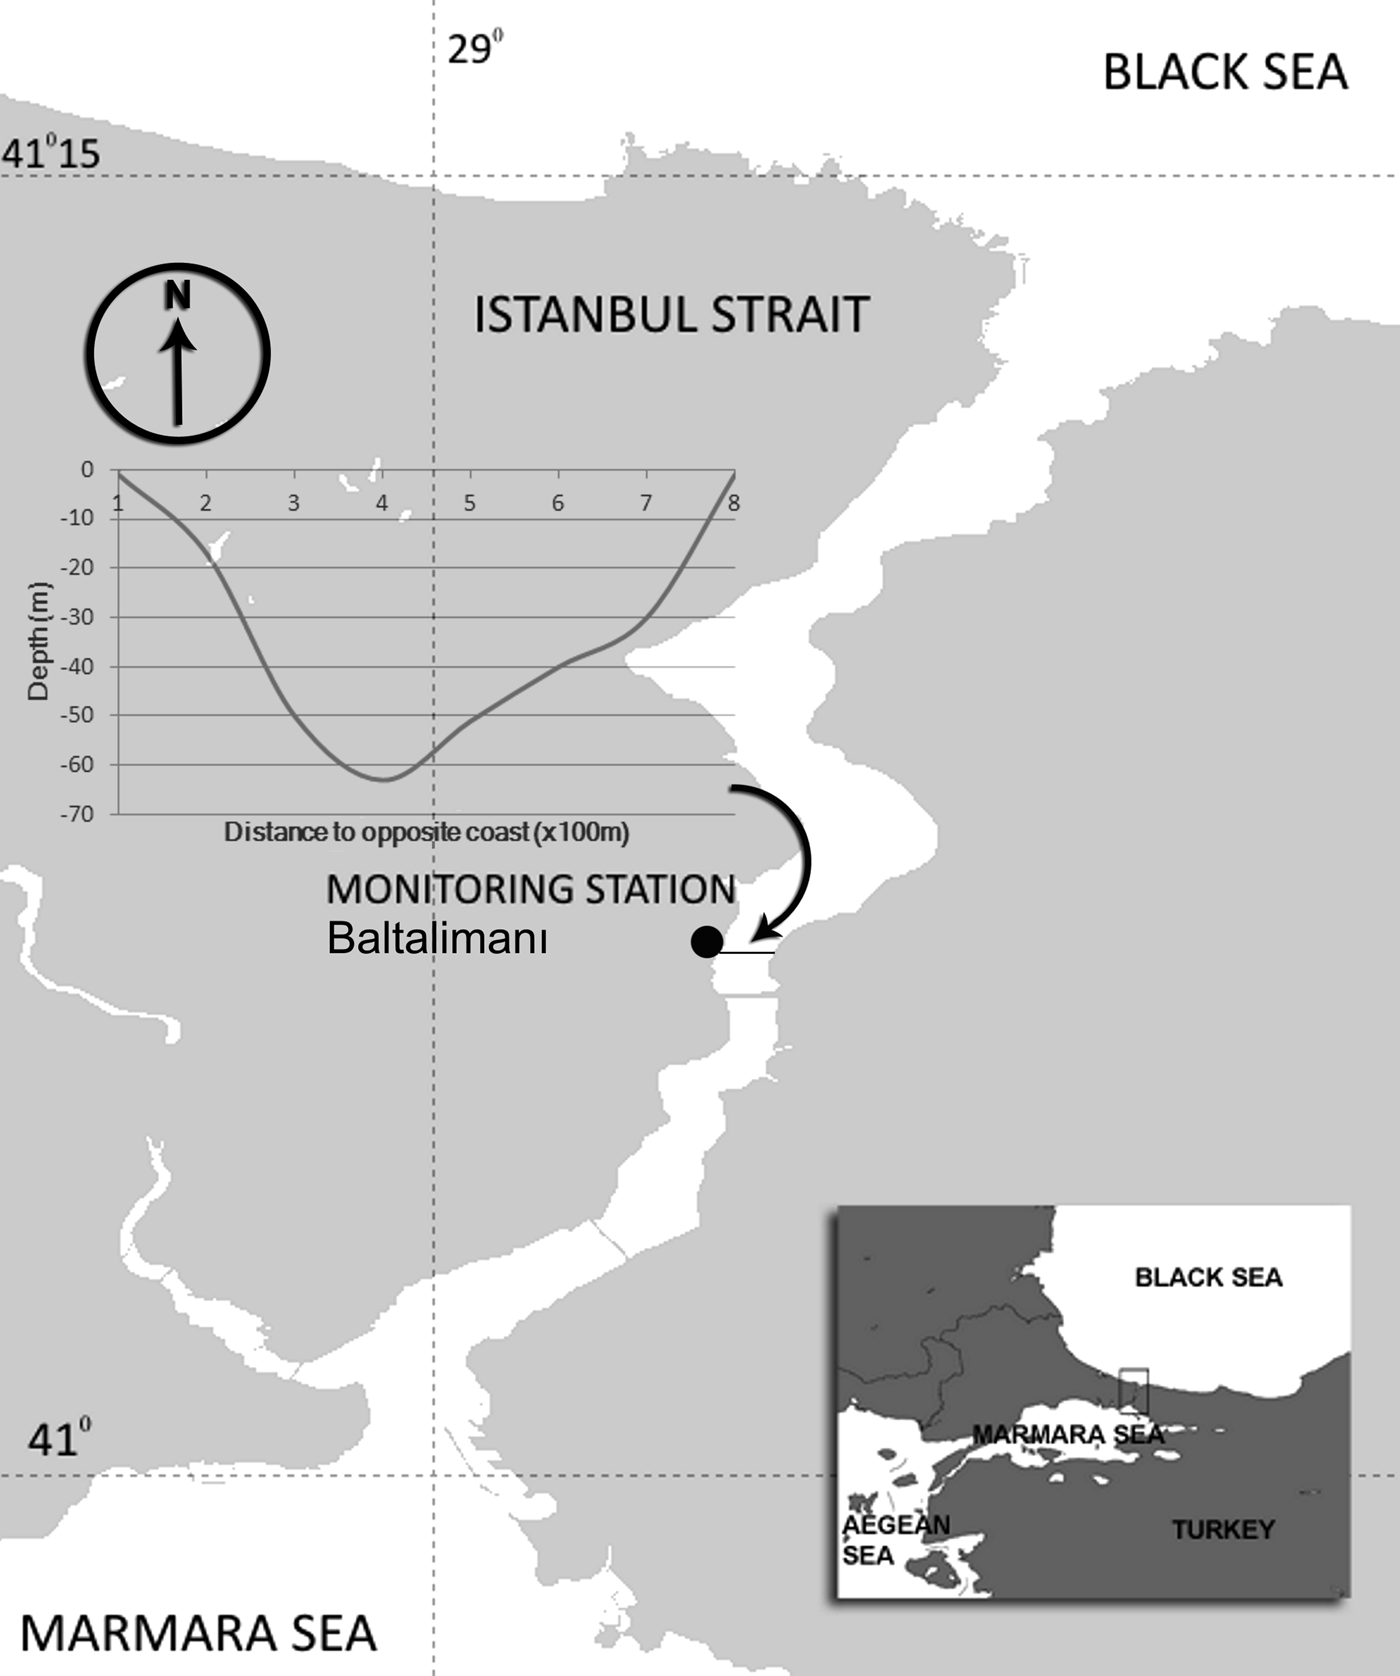
A stereo acoustic event recorder (A-tag: Marine Micro Technology, Saitama, Japan) was deployed from 20 July 2009 to 30 September 2010 at Baltalimanı, Istanbul, Turkey (41°05.835′N, 29°03.264′E) (Figure 1). The A-tag was statically mounted on a small pier wall on the coast about 90 cm below the surface in water approximately 1.25 m deep, both depending upon tidal levels. A-tag has a 60 cm bar which is positioning parallel to the opposite coast. The sea-floor at the deployment site consisted of stone and gravel, with a partial sandy–muddy covering. The distance from the tag to the opposite coast was about 800 m, and the maximum depth between the two coasts of the Strait was 63 m, according to a bathymetry map of the Istanbul Strait. The deepest part of the channel has a sandy–muddy bottom with some gravel and stones.

Fig. 1. The acoustic monitoring station at Baltalimanı, located roughly half-way between the Marmara and Black Seas in the narrowest part (approximately 800 m in width), of the Istanbul Strait, between 41°05′N and 41°06′N latitudes. The cross-section of the Strait at Baltalimanı is shown on the left.
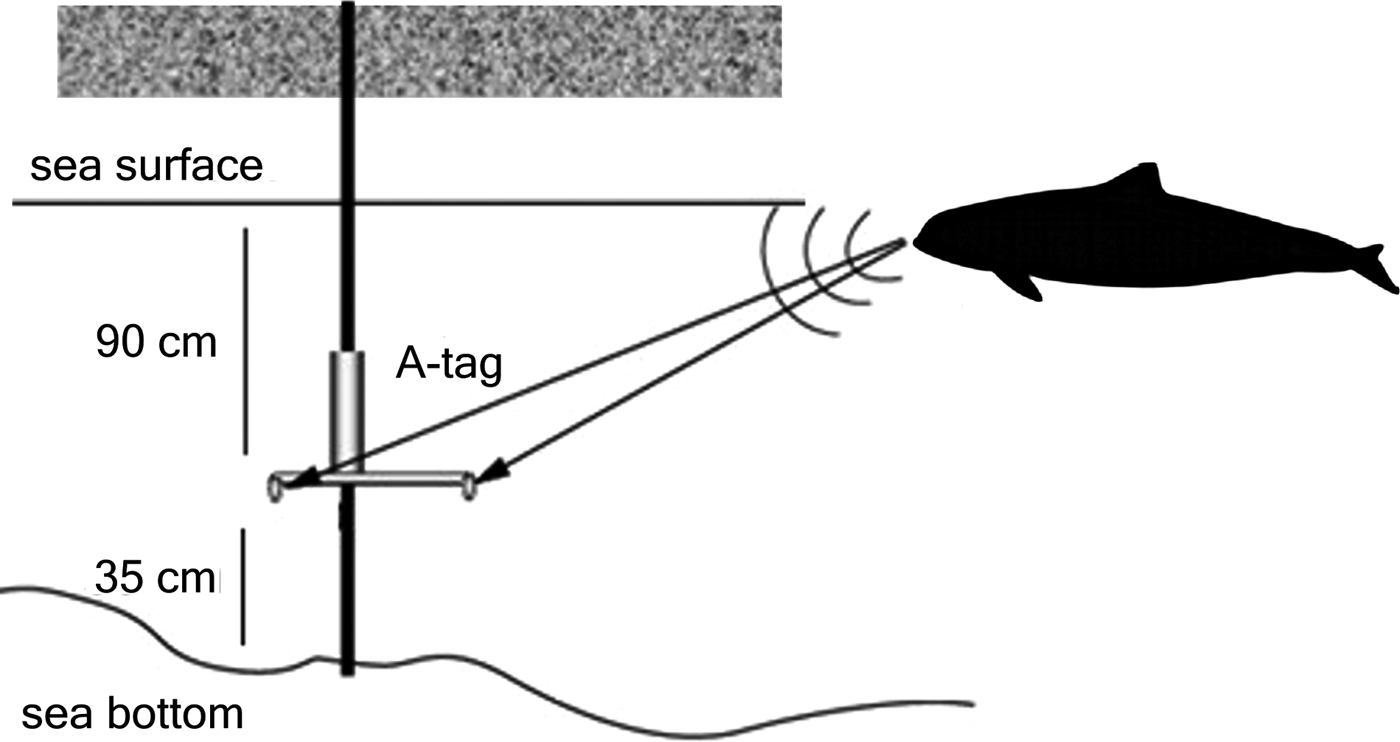
The A-tag is an acoustic event recorder, storing sound pressure levels of received sounds (but not waveform), as well as the time arrival difference of sounds between two hydrophones, which provides sound source direction relative to the baseline of the stereo hydrophone (Figure 2). The hydrophone sensitivity of the A-tag was −201 dB re 1 µPa/V at 120 kHz. The frequency response of the hydrophone of A-tag was flat from 100 to 160 kHz within 5 dB. All smaller odontocetes of interest here had signals incorporating substantial energy at frequencies within the most sensitive bandwidth of the A-tag. Every 2 ms the A-tag recorded the highest intensity of received pulses within a 2 ms time window, provided the amplitude of any received sound is larger than pre-fixed threshold level. This is achieved through use of an electronic circuit built around a capacitor, which accumulates the input sound energy after the preamplification during 2 ms. The highest and likely only prominent pulse within this 2 ms contribute most of the energy accumulated in the capacitor, as most of the background noise is expected to be lower than the preset detection threshold level. The two hydrophones were fixed to an aluminium bar, exactly 60 cm apart, to record the difference in the arrival time of each pulse with a resolution of 1085 ns. A sound travels between the stereo hydrophones within 400 μs along the 60 cm. The resolution of time arrival difference is 1.085 ns, which correspond to ±380 counts range (±400/1.085) of relative bearing angle. Details of the specifications and mechanism of A-tag can be found at http://cse.fra.affrc.go.jp/akamatsu/A-tag/index.html. The dynamic range of the stored data was 138–166 dB re 1 µPa pp. The A-tag was powered by two UM1 (LR20) batteries to extend lifetime up to one month. It was thus replaced monthly with another A-tag in an identical set-up, so that the recordings could be made continuously. Detection distance of the system described here was estimated as 500 m calculated by using source level of animals and the detection threshold of the system.

Fig. 2. A-tag placed on an iron bar which is mounted to a small pier wall on the coastline.
A custom-made script in Igor Pro (version 6.11, Wavemetrics Inc., USA) was used to detect click trains present in the data and analyse their characteristics in terms of duration, amplitude structure and other acoustic parameters. The beginning and the end of a click train was delimited by inter-click intervals that were longer than 200 ms, which is the same criterion as has been used in many previous studies (e.g. Akamatsu et al., Reference Akamatsu, Wang, Wang and Naito2005a). Approximately 90% of inter-click intervals in free-ranging porpoises are shorter than 276 ms (Akamatsu et al., Reference Akamatsu, Wang, Nakamura and Wang1998), which means that pulse intervals longer than 200 ms occur relatively frequently. In addition, the duration of received click trains are very short for fixed-type passive acoustic monitoring system compared to when tags are mounted on the animal, because the highly directional beam of clicks prevents continuous recording from an animal. Accordingly, use of the 200 ms interval to separate different click trains was highly unlikely to split single click trains during the analyses.
Biosonar signals were extracted by reducing noise components, according to the following procedure. Firstly, low-intensity clicks below 8.3 Pa peak-to-peak (138 dB re 1 µPa pp) were eliminated from the data set. This threshold was set slightly higher than the internal noise level of the A-tag (which is equal to an acoustic signal of received level 7.9 Pa after passing the amplifier of the tag). Secondly, click trains containing fewer than six clicks were also discounted (Akamatsu et al., Reference Akamatsu, Matsuda, Suzuki, Wang, Wang, Suzuki, Muramoto, Sugiyama and Oota2005b), as echolocating porpoises usually produce a sequence of ultrasonic pulses (Au, Reference Au1993). Thus, it is reasonable to assume that any shorter pulse sequences likely originate from other biological or mechanical sources. Finally, randomly changing inter-click intervals were also considered to be noise, with randomness defined as a large standard deviation of the inter-click interval within a click train. Click trains with the standard deviation of the inter-click interval larger than 30% of the average inter-click interval were eliminated and were not used for the future analysis. The average, maximum, minimum and standard deviations of the inter-click interval were calculated for each click train.
Visual observations were made at the same location during the daytime. Time, species, group size, direction of movement and distance to the station were recorded for each sighting. Presence, direction and cetaceans detected acoustically were also matched with visual observations during the daytime.
RESULTS
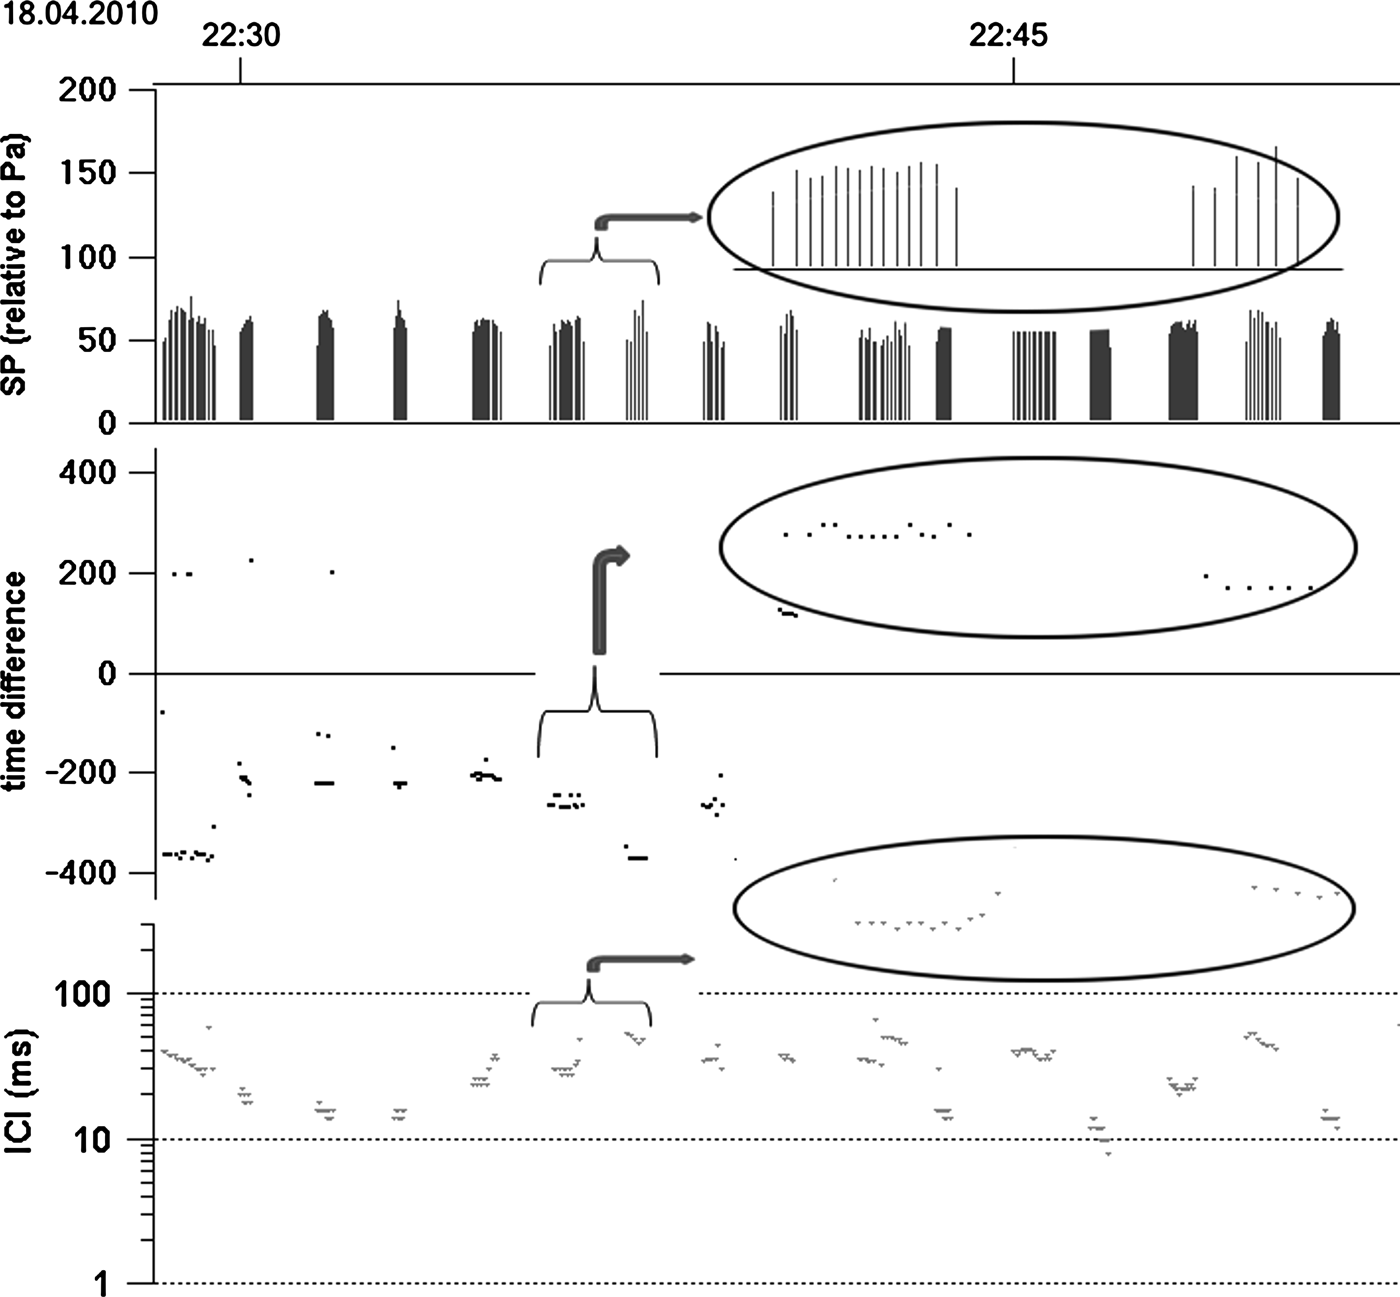
In total, 26,814 click trains (Figure 3, 256,852 clicks) were recorded during 438 days monitoring (from 20 July 2009 to 30 September 2010).

Fig. 3. Click trains recorded by A-tag: top, sound pressure; middle, time difference of sound arrival; bottom, inter-click interval.
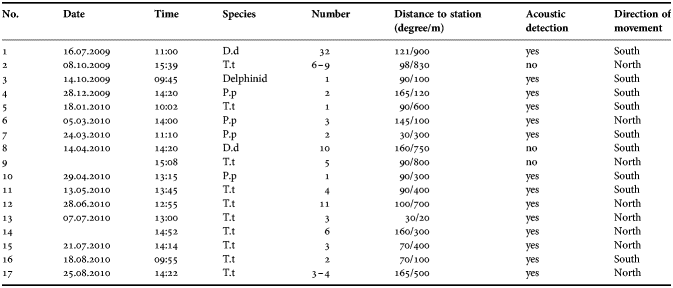
Visual observations were made twice in a week at the same monitoring site, totally 98 days (580 hours), with an average of 5.9 hour per day. There were only 17 sightings that occurred on 15 days of survey. Fourteen out of the 17 sightings were associated with acoustic detections, while the three long distance observations (over 750 m) were not associated with acoustic detections (Table 1).
Table 1. Visual sightings of cetaceans at the Baltalimanı monitoring station.

D.d, Delphinus delphis; T.t, Tursiops truncatus; P.p, Phocoena phocoena.
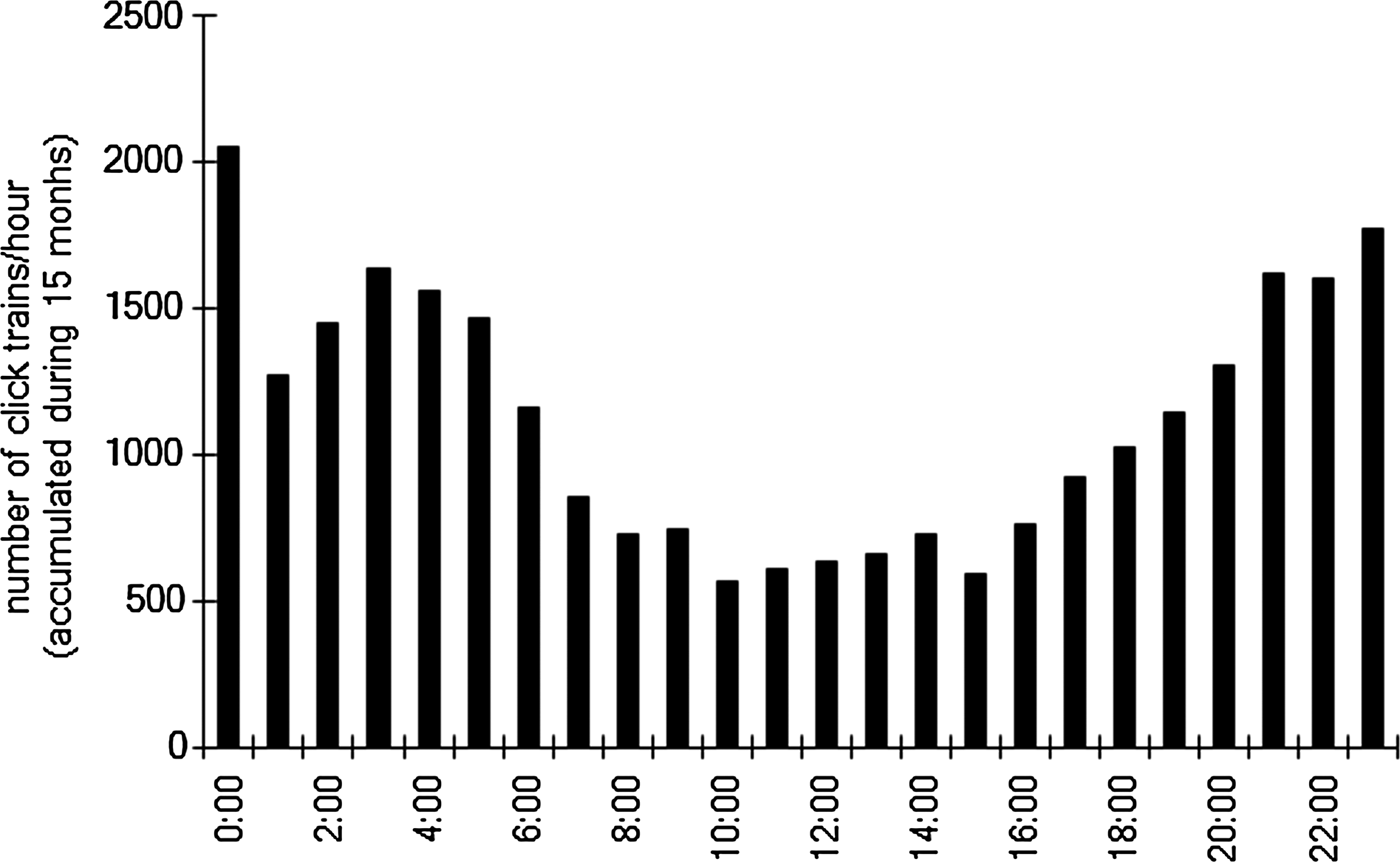
More click trains were detected during night than daytime (Figure 4). Clear diel pattern of biosonar signals presence was indicated. Note that the number of click trains/hour is a mean from data pooled across the entire observation period.

Fig. 4. Diel pattern of click trains (per hour) detected at the monitoring station. The data were pooled across the entire period of observation from 20 July 2009 to 30 September 2010.
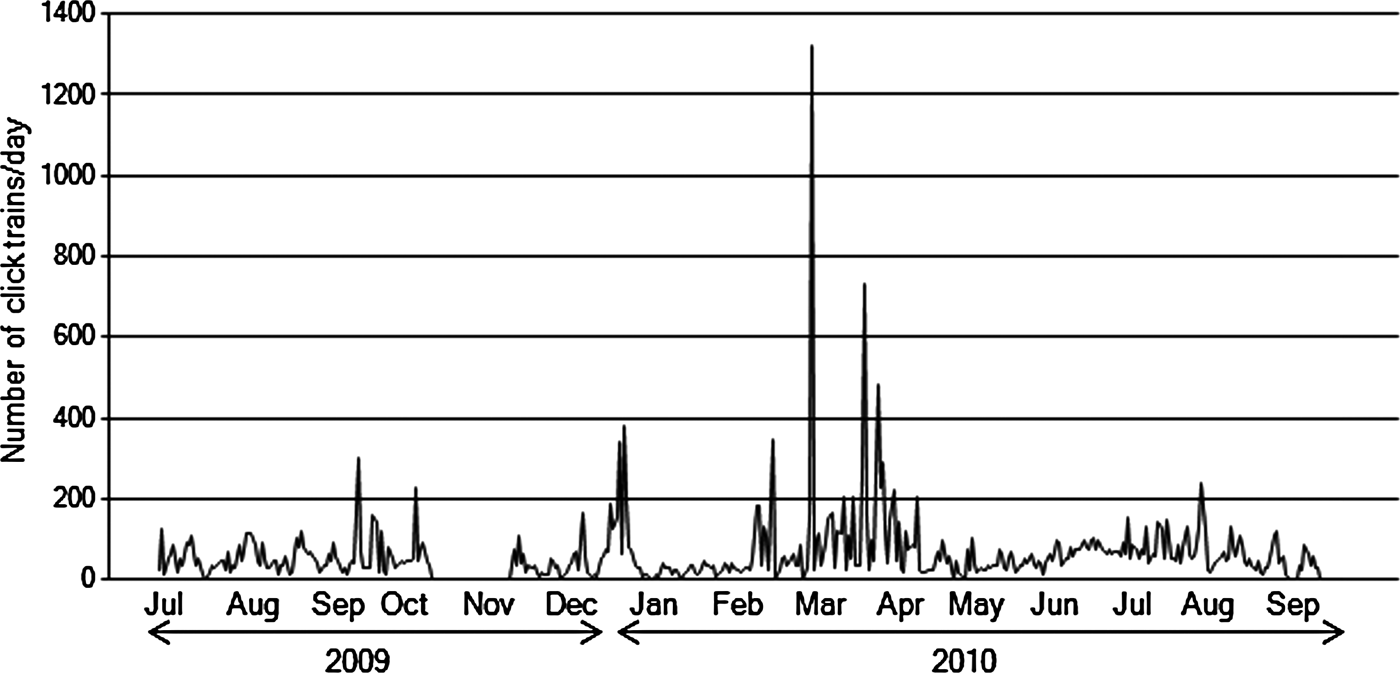
There was high variability in the daily number of click trains. However, large numbers of click trains were detected in the spring months, March and April (Figure 5). Days with a high number of click trains tended to be followed by other high-click train days. This was especially true in the spring (March and April), when click trains were detected almost everyday. In comparison, the number of detected click trains was relatively low during the rest of the year, from summer to winter. All data obtained during November 2009 were excluded from these analyses due to the heavy noise contamination present that month.

Fig. 5. Monthly change in count of click trains per day from 20 July 2009 to 30 September 2010 detected from Baltalimanı monitoring station.
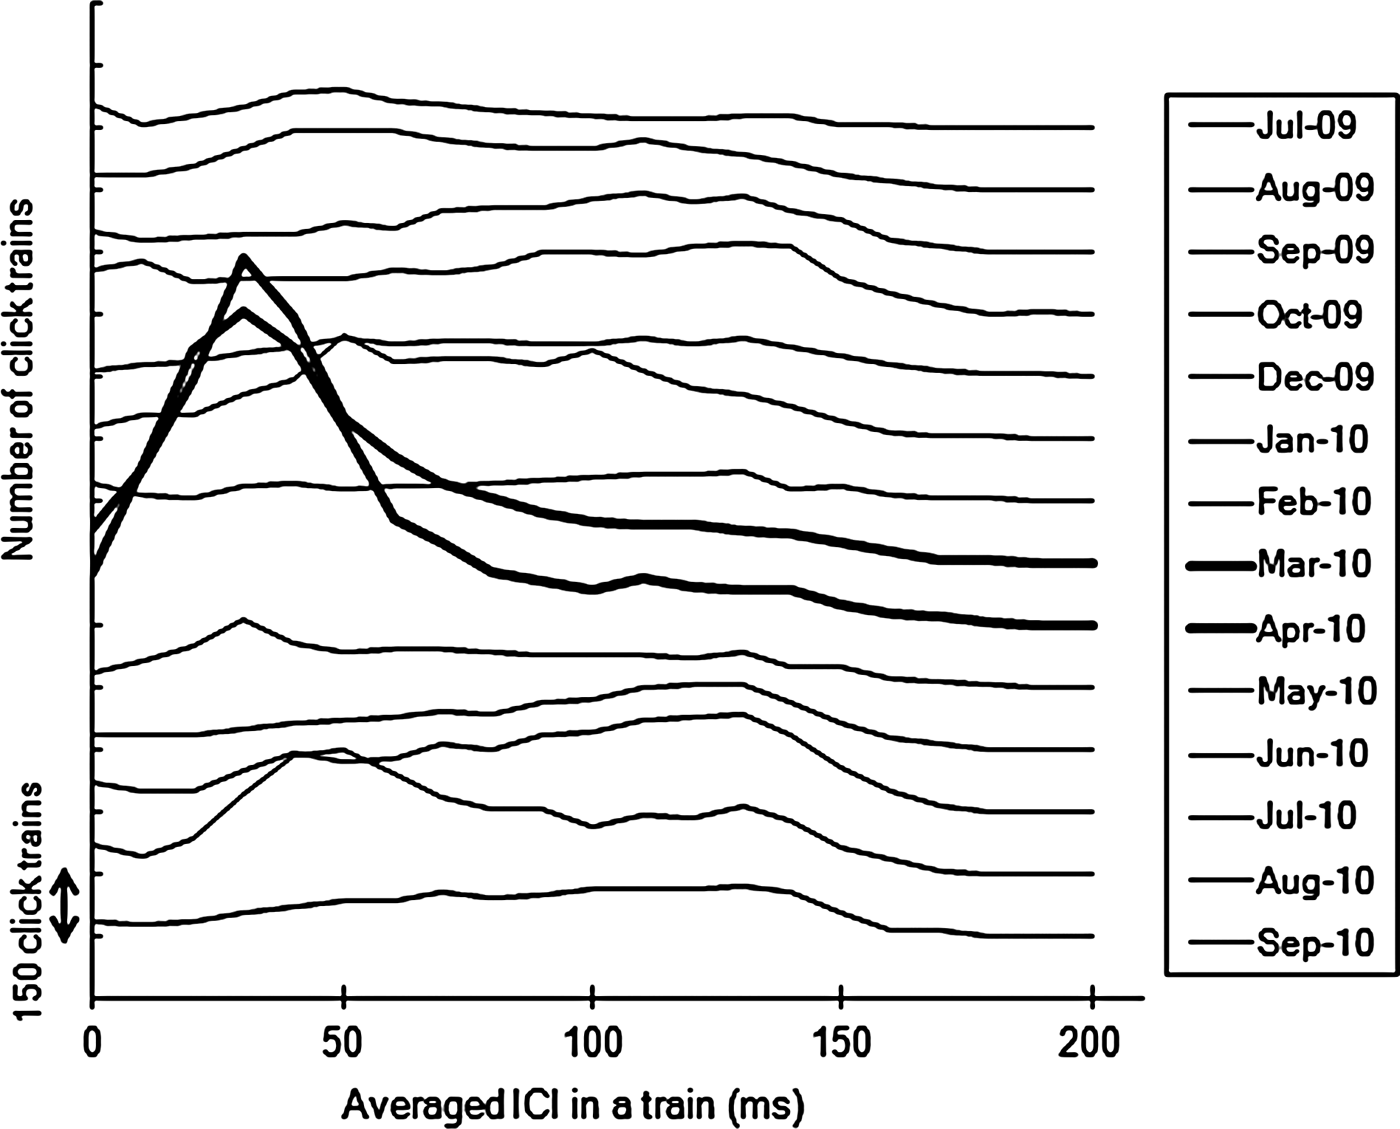
The mean ICI for each click train were examined across different seasons (Figure 6). The ICIs were shorter during March and April than the other months. Distribution showed most frequent ICIs were 30 ms in March and April. In contrast, no clear peaks appeared in other months.

Fig. 6. Frequency of click trains grouped by mean inter-click interval (ICI) over 10 ms bins by each month. Shorter mean ICI was observed in March and April 2010 than seen in other months.
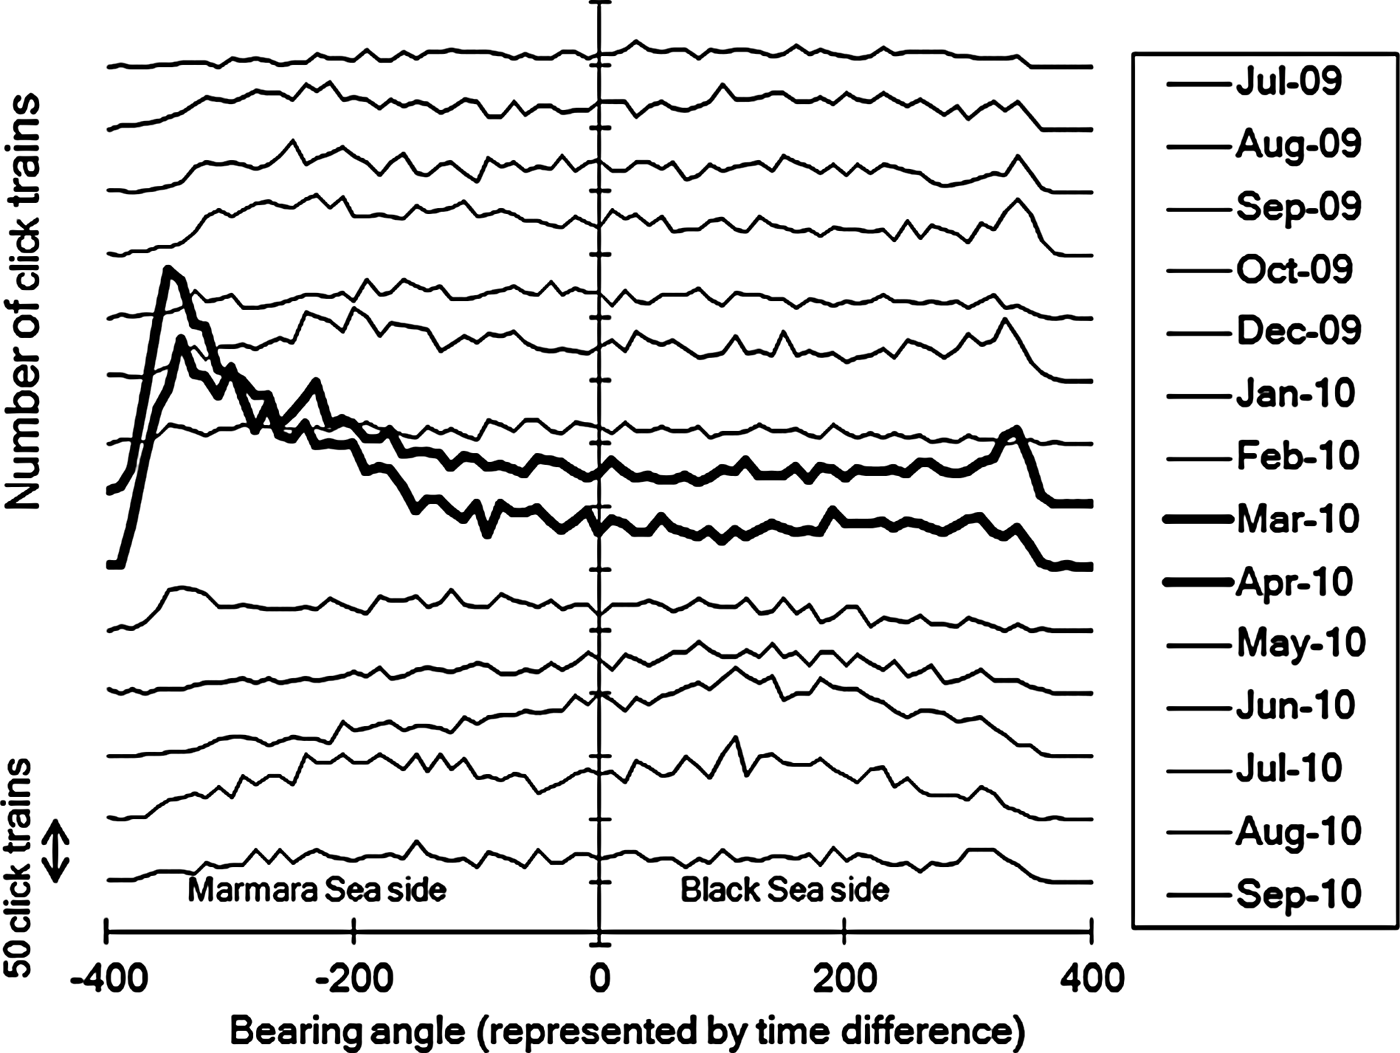
Direction of the biosonar signal sources were also compared monthly (Figure 7). In March and April, signals were detected predominantly with a negative time difference of signal arrival to two hydrophones, which means the sound source was located on the Marmara Sea side of the station. In other months, signals came from all directions and no prominent direction was observed.

Fig. 7. Monthly change in bearing angle of the sound source from Baltalimanı monitoring station. In March and April, the cetaceans localized within specific direction from the fixed point. In contrast, they were detected from all directions in other months.
DISCUSSION
Cetaceans in the Istanbul Strait detected visually within the detection range (<750 m) during the daytime were well matched to the acoustic detections. Fixed acoustic monitoring methods thus seemed to work effectively to observe the presence of odontocetes in the Strait. It follows that the occurrence of cetaceans could be represented by the number of detected click trains that were collected by the A-tag. The detection range is assumed to be around 750 m, although this will vary depending upon the orientation of the animal and thus also the direction of the echolocation sound beam.
Most of the click trains detected in this study were recorded during the night time (Figure 4). Once they appeared, click trains then tended to be detected successively for two or more consecutive days before disappearing from the record again. In March and April 2010 the number of trains detected were typically higher and the mean ICI for each train tended to be lower, which indicates that short-range sonar signals were frequently observed (Figure 6). Finally, during spring time cetaceans were localized more often to the south of the monitoring station in comparison to other months.
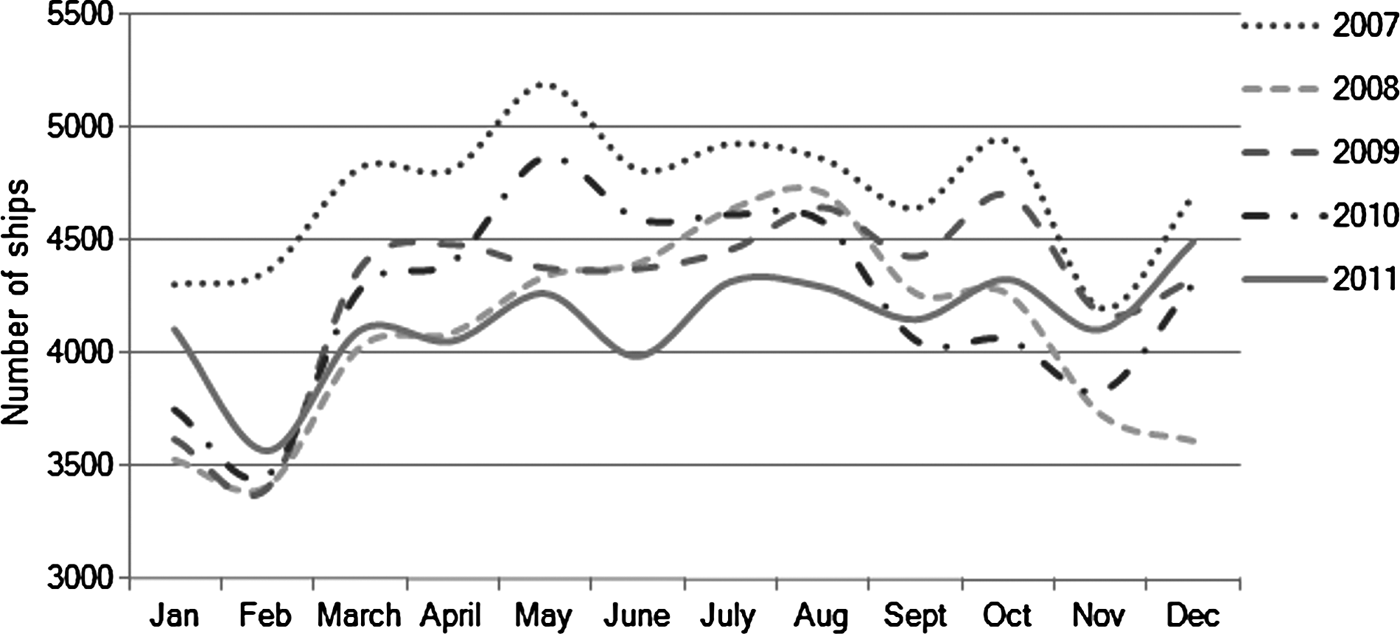
There are several factors that could potentially contribute to this pattern of cetacean presence in the Istanbul Strait. With regards to the diel pattern ship traffic is a definite possibility, as heavy traffic of commuting boats between the European and Asian sides of the Strait during the daytime is a likely stressor for cetaceans. The commuter traffic is much reduced during the night time, thus it may be easier for cetaceans to enter the Strait. This possibility is supported by previous shipboard surveys (Dede et al., Reference Dede, Öztürk, Tonay, Pierce, Philips and Lick2008; Öztürk et al., Reference Öztürk, Dede, Tonay and Öztürk2009) that observed higher sighting frequencies in the northern part of the Strait away from the heaviest ship traffic in and near to the south entrance. As shown in Figure 8, there is less traffic of commercial ships in winter but the traffic level is stable for other seasons. Thus this factor is unlikely to provide an explanation for the seasonal change in the presence of cetaceans.

Fig. 8. Monthly variation in the number of commercial ships travelling through the Istanbul Strait. Slightly lower traffic is present over the winter, but it is about standard for the rest of the year (source: Turkish Ministry of Transportation, Maritime Affairs and Communication, www.denizcilik.gov.tr).
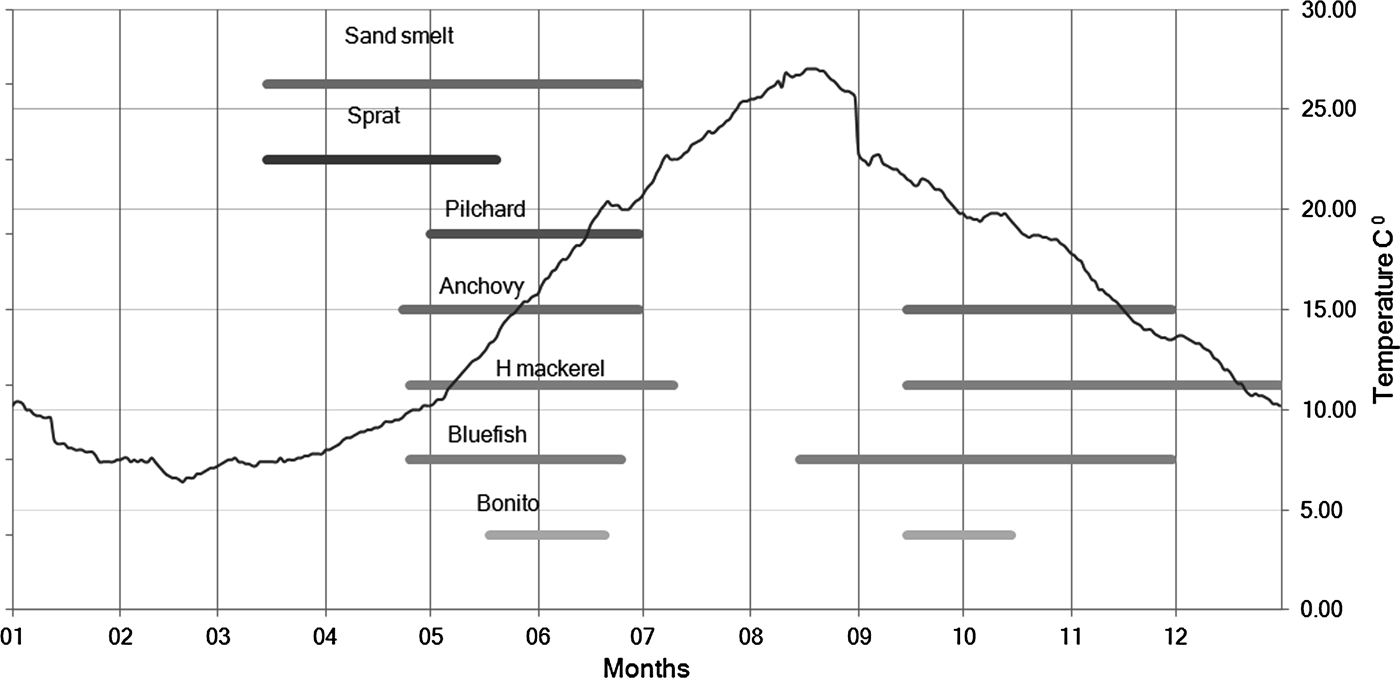
The most likely factor affecting the seasonal occurrence of odontocetes in the area is prey availability. Many fish change habitat diely, seasonally, and some from year to year (Freon et al., Reference Fréon, Gerlotto and Misund1993). Such changes in fish distribution could affect dolphins movements or presence. Tonay et al. (Reference Tonay, Dede and Öztürk2007a) found horse mackerel (Trachurus trachurus) and sprat (Sprattus sprattus) in the stomach contents of stranded harbour porpoises from the Marmara Sea and Tonay et al. (Reference Tonay, Dede, Öztürk and Öztürk2007b) found sprat and anchovy (Engraulis encrasicolus) from the stomach of harbour porpoises in the western Black Sea. Figure 9 shows the migration periods of several pelagic fish species in the Istanbul Strait. Sand smelt (Atherina boyeri) and sprat start their migration from the Marmara Sea to the Black Sea in March and April.

Fig. 9. Seasonal pattern of the surface water temperature and fish migration in the Istanbul Strait. Presence pattern of fish species derived from the information gathered from the catch statistics of Bostancı (south of the Istanbul Strait) and Rumelifeneri fisheries cooperatives (north of the Istanbul Strait) and Fil Cape fish trap (north of the Istanbul Strait). The data of sea surface water temperature were obtained by the Office of Navigation, Hydrography and Oceanography, Turkish Naval Forces and the Turkish State Meteorological Service.
Although these pelagic fish are prey for dolphins and porpoises and they are known to migrate through the Strait in spring, there is no information on night-time movements of migratory fish species in the Strait. Slastenenko (Reference Slastenenko1956), however, indicated that mullets stopped their movements at night, while anchovies moved close to the surface, which may make them more easily caught by cetaceans. According to stomach content analyses, sprats are feeding mostly on mesozooplankton (Avşar, Reference Avşar1994; Tičina et al., Reference Tičina, Vidjak and Kačič2000) and sand smelts primarily feeding on nocturnal zooplankton (Bartulovic et al., Reference Bartulovic, Lucic, Conides, Glamuzina, Dulcic, Hafner and Batistic2004). Furthermore, clupeoids usually perform diel vertical migrations that seem mainly related to the similar vertical movements of the deep scattering layer that is, in turn, driven by light intensity preferendum (Blaxter & Hunter, Reference Blaxter and Hunter1982). Both of the examples showed the diel movement of the predator is strongly affected by the prey availability. It is thus possible that the nocturnal activity of odontocetes in the Strait may thus also be related to the movement of prey fish. Some additional support for this is found in the lower ICI indicative of the use of short range sonar for short distance sensing and thus also potentially prey capture attempts (for example Verfuss et al., Reference Verfuss, Miller, Pilz and Schnitzler2009; Akamatsu et al., Reference Akamatsu, Wang, Wang, Li and Dong2010) that was seen during the night time (Figure 6).
The acoustic activity was high in the Marmara side or the southern side of the Baltalimanı monitoring station in March and April, whereas it was located in all directions in other months (Figure 7). This suggests that cetaceans just passed by the monitoring station throughout the majority of the year, except for March and April, when they were recorded more often from the south-bound direction. This may be because the Fatih Sultan Mehmet Bridge is nearby on the southern, Marmara side of the study site. The lighting of the bridge illuminates the water surface at night and pelagic fish may be attracted by this illumination during darkness. Another possibility is found in the topography of the area. The maximum depth on the Marmara side of the monitoring station is about 60 m, but this changes rapidly to around 5 m just south of the study site. The resulting wall creates upwelling and counter currents. Finally, cetaceans may use this area to prey on small pelagic fish before they can disperse in the wider parts of the Strait, or that may be resting in the area. For example, local fishermen have mentioned that the narrow passage is used as a shelter by pelagic fish during their migration season.
As for the possible influence of the fisheries themselves, large-scale commercial fishing operations, such as purse seining, are carried out in the Strait for migratory pelagic fish, especially during autumn and early winter, until mid-April, after which all commercial fishing is banned in the Turkish water. Regardless, commercial fishing activities are completely prohibited in the middle section of the Istanbul Strait, including this study site, even during the fishing season. Cetaceans should thus not be affected by fishing activities there, although intense fishing activity is present further to the north of the Istanbul Strait during the fishing season. Dede et al. (Reference Dede, Öztürk, Tonay, Pierce, Philips and Lick2008) reported decreasing sighting frequencies in the northern part of the Strait in autumn months and suggested that dolphins do not seem to follow prey fish at this time of year (in contrast to their behaviour in the spring) due to this intense large scale fishing activity. The result of our study suggests that fisheries did not affect the entrance of the cetaceans into the Strait, although it remains possible that access to feeding grounds in autumn months may still be limited.
In conclusion, the acoustic preliminary observations presented here of odontocetes in the central area of the Istanbul Strait are consistent with the hypothesis that these cetaceans use the area for feeding in spring, mostly during the night, because prey fish such as sprats are migrating from the Marmara Sea to the Black Sea during the same period. Despite this, there were large temporal variations in the presence of odontocetes in the study area. This may indicate that the distribution of the animals is not only governed by prey distribution, but also by other factors such as the need for resting and socializing. Either natural or anthropological factors (such as shipping) could be the drivers of these fluctuations. Several other more fundamental questions about these populations also remain. For example, it is not clear why the cetaceans do not remain in our study area for the whole period of fish migration in both spring and autumn. Similarly, it remains unknown if these odontocetes pass entirely through the Strait from the Black Sea to the Marmara Sea. Longer-term and range-wide monitoring of these species, as well as local fish distributions, will be necessary to elucidate these unsolved questions regarding cetacean presence and activities in the Istanbul Strait.
ACKNOWLEDGEMENTS
The authors give thanks to Mr Adnan Sümer for helping the A tag deployment, Mr Mustafa Kılınç, Mr Celal Şen for fish catch data, Dr Andrew Wright for reviewing our draft, Ms Aylin Akkaya for stationary observations, Istanbul University, Baltalimanı Strait Monitoring Station where the study conducted and WaveMetrics, Inc., USA, for providing their software Igor Pro.
FINANCIAL SUPPORT
This study was partly supported by Grants-in-aid for Scientific Research B under Grant No. 19405005 from the Japanese Research and Development Program for New Bioindustry Initiatives and Turkish Marine Research Foundation (TUDAV).


