


Different experimental paradigms (e.g., inattentional blindness, change blindness, repetition blindness, etc.) have tested the limitations of the attentional system. Among them, we find the Attentional blink (AB) paradigm, first described by Raymond et al., (Reference Raymond, Shapiro and Arnell1992), which is related to the selection of information under conditions of time pressure. The standard AB effect occurs when participants have to identify a first target (T1) in a rapid serial visual presentation (RSVP), and fail to detect a second target (T2) among a series of distractors. This attentional failure (blink during a refractory period) happens when among the first and the second target there is a gap between 180–400 ms (Duncan et al., Reference Duncan, Ward and Shapiro1994). The common explanation of AB effect holds that attention resources are not enough to process all elements of the series within the RSVP. The AB can be modulated by highlighting physical properties as increased contrast in luminance (Chua, Reference Chua2005) or color (Shih & Reeves, Reference Shih and Reeves2007), and by affective variables. For example, it has been found that negative valence or high emotional intensity stimuli presented as T2, reduce the AB effect (Anderson & Phelps, Reference Anderson and Phelps2001; Keil & Ihssen, Reference Keil and Ihseen2004). Also, people with high anxiety-trait scores show attenuated AB when T1 is a negative word compared to when it is neutral (Arend & Botella, Reference Arend and Botella2002).
Especially interesting for the research presented in this article, there is a variant of the AB paradigm known as emotional attentional blink (EAB). Most et al. (Reference Most, Chun, Widders and Zald2005) provided an early description of the EAB and established the term emotion-induced blindness, a model paradigm for understanding stimulus-driven influences of emotion on attention. The EAB is a phenomenon in which the brief presentation of an emotionally laden image (irrelevant to the task) as a previous distractor (it works as T1) in a RSVP, captures the observer’s attention, to the point that individuals cannot detect a target (Tg) presented a several hundred ms after the emotional stimulus (McHugo et al., Reference McHugo, Olatunji and Zald2013). It has been noted that in the time course of the EAB, the attentional blindness can be observed very early, even in lag 1 (100 ms), but it decays greatly if we move beyond lag 2 (200 ms). Overall, the temporary effects of the emotion-induced blindness are similar to those of AB. The EAB has been found in negative and aversive images (Most et al., Reference Most, Chun, Widders and Zald2005) but also with positive and arousing stimuli as erotica, with EAB effects even larger than the produced by aversive images (Ciesielski et al., Reference Ciesielski, Armstrong, Zald and Olatunji2010; Most et al., Reference Most, Smith, Cooter, Levy and Zald2007). Several factors that can modulate the EAB have been studied, such as the meaning of a distractor (Smith et al., Reference Smith, Most, Newsome and Zald2006), or its value in motivational terms (Piech et al., Reference Piech, Pastorino and Zald2010). As McHugo et al. (Reference McHugo, Olatunji and Zald2013) state, these modulations are relatively modest compared to the large magnitude of attentional capture by aversive or erotic pictures but may enable the use of the EAB as a measure of dynamic changes in stimulus valuation; i.e., the emotional stimulus exerts an influence capable of modifying, controlling or varying the strength of the EAB effect.
To the best of our knowledge, to date no research has been done on the extent to which emotional stimuli linked to strong beliefs, such as patriotism or religious beliefs, can affect or modulate the strength of the EAB.
This study aims to explore whether the implicit processing of emotional symbols related to patriotic feeling may exert effects in attention. Nathanson (Reference Nathanson1993) defines patriotism as involving (a) special affection for one’s own country, (b) a sense of personal identification with the country, (c) special concern for the well-being of the country and (d) willingness to sacrifice to promote the country’s good. Patriotism is the attachment that in-group members develop for their group and the country in which they reside (Bar-Tal, Reference Bar-Tal1993; Kosterman & Feshbach, Reference Kosterman and Feshbach1989). This internalized belief or ideology fulfils important functions for the individuals. It often provides them with a sense of security (Druckman, Reference Druckman1994; Mack, Reference Mack1983), but also a sense of belonging and self-esteem (Bar-Tal, Reference Bar-Tal1993; Mack, Reference Mack1983). It also helps to build group unity that enhances group cohesiveness and activates people to act in ways that will favor their group and their country (Bar-Tal, Reference Bar-Tal1993). By contrast, nationalism dictates that a certain political organization of a national group that of the nation-state is necessary for the social cultural and economic functioning of the people (Bar-Tal, Reference Bar-Tal1993; Kelman, Reference Kelman, Bar-Tal and Straub1997). Some researchers consider that the main feature of nationalism is an orientation towards national dominance and the derogation of other national groups (Druckman, Reference Druckman1994; Kosterman & Feshbach, Reference Kosterman and Feshbach1989). Kosterman and Feshbach (Reference Kosterman and Feshbach1989) tried to identify the factors linked to patriotism and nationalism and concluded that both are functionally different attitudinal dimensions. Other researchers working on attitudes claim that patriotism and nationalism are positively correlated but introduce the distinction between “blind” and “constructive” patriotism when studying national sentiments (Schatz & Staub, Reference Schatz, Staub, Bar-Tal and Straub1997). For these authors “blind” patriotism is an attachment to country characterized by unquestioning positive evaluation, loyalty, and intolerance of criticism. While “constructive” patriotism is an attachment to country characterized by support for questioning and criticism of current group practices that are intended to result in positive change. We see that conceptions of patriotism differ according to places and times, but also the practices that accompany them are very diverse (Baker, Reference Baker2012). On the other hand, the sociology of patriotism (Daucé et al., Reference Daucé, Le Huérou and Rousselet2013) has revealed two forms of patriotism: The bottom-up or grassroots patriotism (developed by individuals as an awareness of identity and feeling of belonging to a nation) and top-down patriotism, that is imposed from a state order (the prevailing official discourse).
Although a person may live without being or feeling patriotic, patriotism-nationalism allows the individual to feel part of a group, which in psychosocial terms is highly adaptive. Our concern is whether the emotionality linked to patriotism represented by national flags can cause attentional blindness to detect a neutral stimulus in RSVP, as happens with other type of emotionally valence and arousing stimuli. Indirectly, if the intensity of the affection linked to this kind of symbols (flags) depends on the strength of the patriotic belief, we wondered if it would be possible measuring patriotic strength by using cognitive (attentional) and neurophysiological measures.
To elucidate these issues, we have conducted an experiment using two types of interrelated tasks. On the one hand, we use flags with different meanings to participants for measuring the strength of EAB within a RSVP paradigm. In our autonomous community (Catalonia, Spain) there has recently been a significant rise in separatist feeling (Catalan nationalism) in approximately half the population, as opposed to the unionist sentiment (Spanish constitutionalism) of approximately the other half of the population (Oller et al., Reference Oller, Satorra and Tobeña2019; see also Tobeña, Reference Tobeña2018). This division allows us to use flags as an emotionally laden symbol that represent each patriotic subgroup of participants. On the other hand, we use a “congruency judgments” subjective test, where we confront participants to judge the affinity or congruence between pairs of leaders (pro-independence and pro-union politicians) and flags of different sign (pro-independence and pro-union), while recording two physiological measures, Heart Rate Variance (HRV), and Galvanic Skin Response (GSR), to evaluate the emotional fluctuations provoked by that confrontation. To date, the assessment of the possible impact on the strength of the EAB of a more or less radical political thought or ideological concept, fanaticism (e.g., nationalist or religious) and extremist ideas remains unknown. Demonstrating the influence of certain beliefs that underpin national pride, patriotism or nationalism on EAB would have both practical and theoretical implications.
Our prediction in the AB task is that emotionally laden flags will provoke EAB effects, while those same effects should not be found with neutral (control) flags. If this is the case, the participants’ patriotic feeling should play a critical role. In the second task, participants must make a subjective assessment on the congruence between a politician and a flag while electrophysiological measures were taken. In both, politicians and flags, we have three levels or categories that cover up the pro-independence, pro-unionist and neutral spectrum. Our predictions are that the emotional reaction recorded by objective measures will be maximized when the relation between a politician and a flag is inconsistent from the point of view of one or another type of patriotism (pro-independence or pro-unionist).
Method
The experiment conducted in this study was divided in two parts (1A and 1B) in each of which a different task was performed: 1A) Emotional Attentional- Blink task; and 1B) Congruency judgments task. The first task aims to assess the extent to which flags used as symbols representing patriotism are capable of generating EAB effects. The second task aims to confront participants to couples of political leaders and flags in order to subjectively assess their compatibility, while their HRV and GSR are recorded. Upon completion of the first task, participants value their affinity with each of the three flags that appeared as distractors in the experiment, allowing them to be classified into three distinct groups of “patriotism”: Pro-independence, pro-union, and neutral. The two tasks were carried out in different experimental sessions.
Experiment 1A
Participants
Fifty-three students (95% women) of the University of Barcelona between 18 and 52 years old (M = 21.16; SD = 7.34), with normal (or corrected to normal) visual acuity (20/20), volunteered for the experiment to gain course credits. The sample size was determined by the availability of voluntary subjects. According to their place of birth participants were distributed as follows: Catalonia (83%); Catalan-speaking regions (5.6%), Hispano-America region (3.8%); China (3.8%); Morocco (1.9%), Romania (1.9%). All participants signed an informed consent form before participating in the research. The experiments were approved by the University of Barcelona Bio-ethics’ committee and conducted in accordance with the Declaration of Helsinki of 1975 (as revised in Fortaleza, Brazil, October 2013).
Stimuli, Task and Apparatus
The stimuli were 18 color drawings of everyday objects composing a rapid serial visual presentation (RSVP). Pictures belong to the FoodCast Research Image Database within the category “artificial objects” (FRIDa; Foroni et al., Reference Foroni, Pergola, Argiris and Rumiati2013). The selection of images was based on information related to both physical properties (size: Figure-background ratio, mean brightness and high spatial frequency power) and validation data (valence, familiarity, typicality, ambiguity and arousal), which were provided by the FRIDa images database. Then, we selected those images whose differences between each of these variables were not significant. Finally, the emotional stimulus (flags) were matched in the physical properties, being equivalent to those of the other distractors. The stimuli were presented on a 22-inch LED Samsung screen with spatial resolution of 1920x1080 pixels, against a white background (104 cd/m2). The visual angle in the retina was 7 degrees. The temporal frame rate of the screen was 144 Hz and the temporal frequency of presentation of images 11.95 Hz. The task was performed using 4 PCs Intel Core i7 and a GeForce GTX 1050 graphic card supporting the OpenGL mode. Experimental trials consisted of a RSVP of 18 images (organized in different experimental conditions), each of them presented for 83 ms.
Visual Conditions and Characteristics of the Series in the RSVP
Three visual conditions were designed to examine the impact of the emotional stimuli or critical distractor (CD) on the AB. In the pro-independence condition, the CD was the Catalan independence flag. In the pro-unionist condition, the CD was the Spanish constitutional flag. Finally, in the neutral condition, the CD was the European Union flag.
The task consisted of 384 series that differed in the combination (presence/absence) of the emotional distractor (CD) and target (Tg): 48 series without CD nor Tg; 48 series with CD without Tg; 144 series with Tg without CD, and 144 series with both, CD and Tg. According to the EAB paradigm, the emotional stimulus (CD) could appear in positions 5, 9 or 13, and the target (Tg) in positions +1, +2, +3 or +4 in respect to CD (lags 1 to 4). Therefore, in trials with critical distractor and target, Tg was always preceded by CD in a variable delay (Lag 1 = 83 ms, Lag 2 = 166 ms, Lag 3 = 249 ms, and Lag 4 = 332 ms). The 18 images of each trial appeared in random order within the series, except for CD and Tg, whose positions were defined. The four types of series were matched in number, in order to make them equally probable and not affecting the “a priori” probabilities that could be estimated by subjects. On the other hand, the series type “no CD & no Tg” and the series “only Tg” revealed that the subjects do not respond at random, since the hit rate in these trials was 93.5% and 94.2% respectively.
The experiment was conducted in two blocks of 192 series separated by an adaptable resting time (at least 1 min). Thus, the complete test lasted 28 minutes in average. All series were presented in random order and no feedback was given to the response of the participants. Prior to performing the task, participants underwent a training period involving three series, thereby enabling them to practice the buttons associated with the two possible responses. Instructions emphasized that the target would always be a light bulb that could appear vertically or rotated, and their mission was trying to correctly respond whether appeared or not in each trial.
Participants did the task in individual computers in one of the four boxes of the lab. Each of them was located 50 cm of distance from the screen. Each trial started with a fixation point (see Figure 1) presented in the center of the screen and ended with the presentation of a question mark (“?”) that lasted 2.5 seconds. At the end of each trial, a question mark appeared, and participants pressed either the left (yes response) or right button of the mouse. The display of each series took around 4 seconds (Fixation + 18 images + question mark).
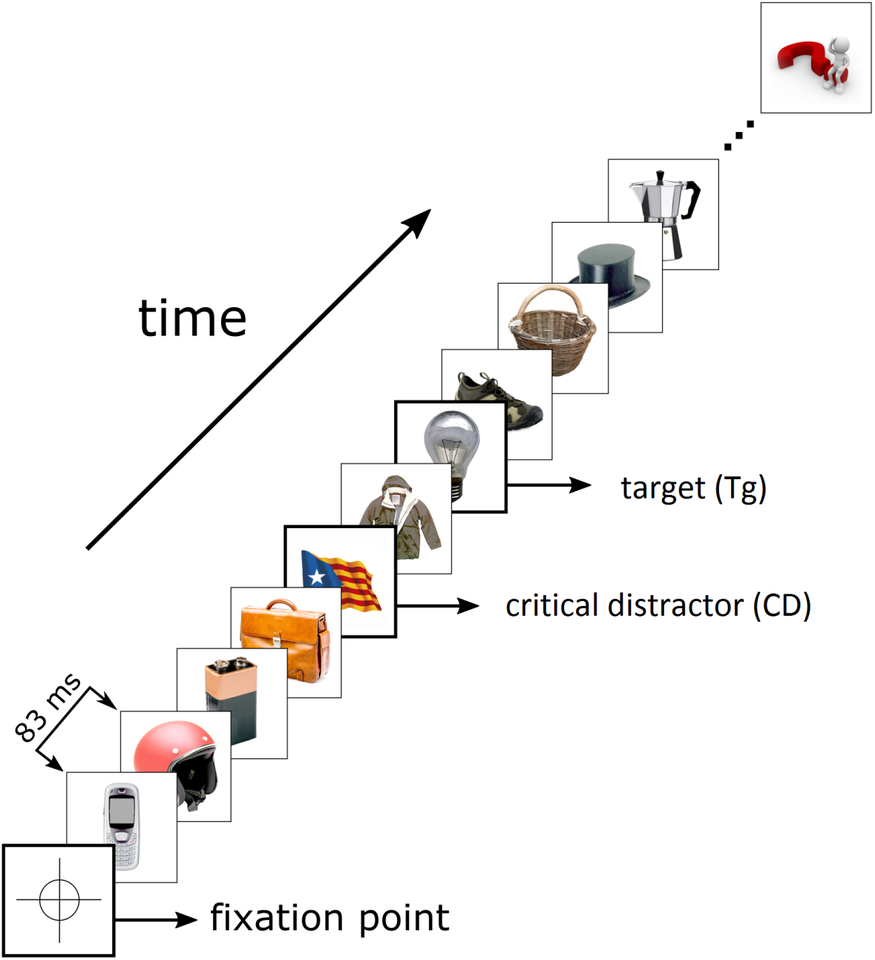
Figure 1. Example of RSVP Experimental Trial (Series of 18 Images) with the Emotional Distractor (CD) in Position 5, and the Target (Tg) in Position +2 (Lag 2).
Data analysis
All repeated-measures ANOVA were performed with the Greenhouse–Geisser correction for sphericity departures, which was applied when appropriate. The F value, the corrected degrees of freedom, the probability level following correction, and the η2 effect size index are reported. The effect size was interpreted as intermediate; according to the Richardson’s criterion (small, medium or large when partial η2 was around .01, .06, or .14, respectively, Richardson, Reference Richardson2011). Whenever a main effect reached significance, pairwise comparisons were conducted using Bonferroni tests. Tests of simple effects were calculated in the presence of a significant interaction.
Results and Discussion
Analysis of the EAB Effect Depending on the Flag (Emotional Stimulus)
In order to verify whether the flags (country symbols) have the capacity to induce EAB, a repeated measures ANOVA taking Flags (3) x Lags (5) as within factors was conducted. The dependent variable was the proportion of correct detections in the RSVP. Results showed that both simple effects of Flags, F(1.860, 96.718) = 7.434; p < .001; ηp2 = .125; and Lags, F(2.608, 135.611) = 4.225; p < .010; ηp2 = .075, were significant. But also the interaction Flags x Lags, F(6.305, 327.854) = 2.165; p < .043; ηp2 = .040. A posteriori paired T-tests were conducted to contrast if the percentage of correct detections decreased significantly in Lag–1. We compared hit rates from “only Tg” series with “CD + Tg” series in Lag–1 position (83 ms distance between CD and Tg). The tests were separately run for each of the three critical distractors (Catalan, Spanish and Neutral flags). For the single condition, in which only the target stimulus was presented, we computed the overall mean proportion of correct responses. For the double condition, in which both the CD and the Tg stimulus were presented, we considered the mean proportion of correct responses separately for each of the four lags. The Tg hit rate in the series that include any of the emotional stimulus (flags) provides the standard measure of the EAB effect.
Additionally, post hoc analysis revealed that no significant differences were found in the detection of Tg (target only) between the three conditions (types of flags). Figure 2 shows that in the series in which the Catalan independence flag was presented as CD, the proportion of correct detections decreases significantly when presenting the CD preceding the presentation of the Tg with a delay of Lag 1 (83 ms), t(52) = .67; p = .049, with respect to that obtained when only the target was presented. However, detections increase progressively in Lag 2 and 3, and the emotional induced blindness disappears in Lag 4, where the percentage of hits equals statistically the one obtained in the single condition (only target). Therefore, the symbol that represents Catalan patriotism is able to provoke an EAB effect.
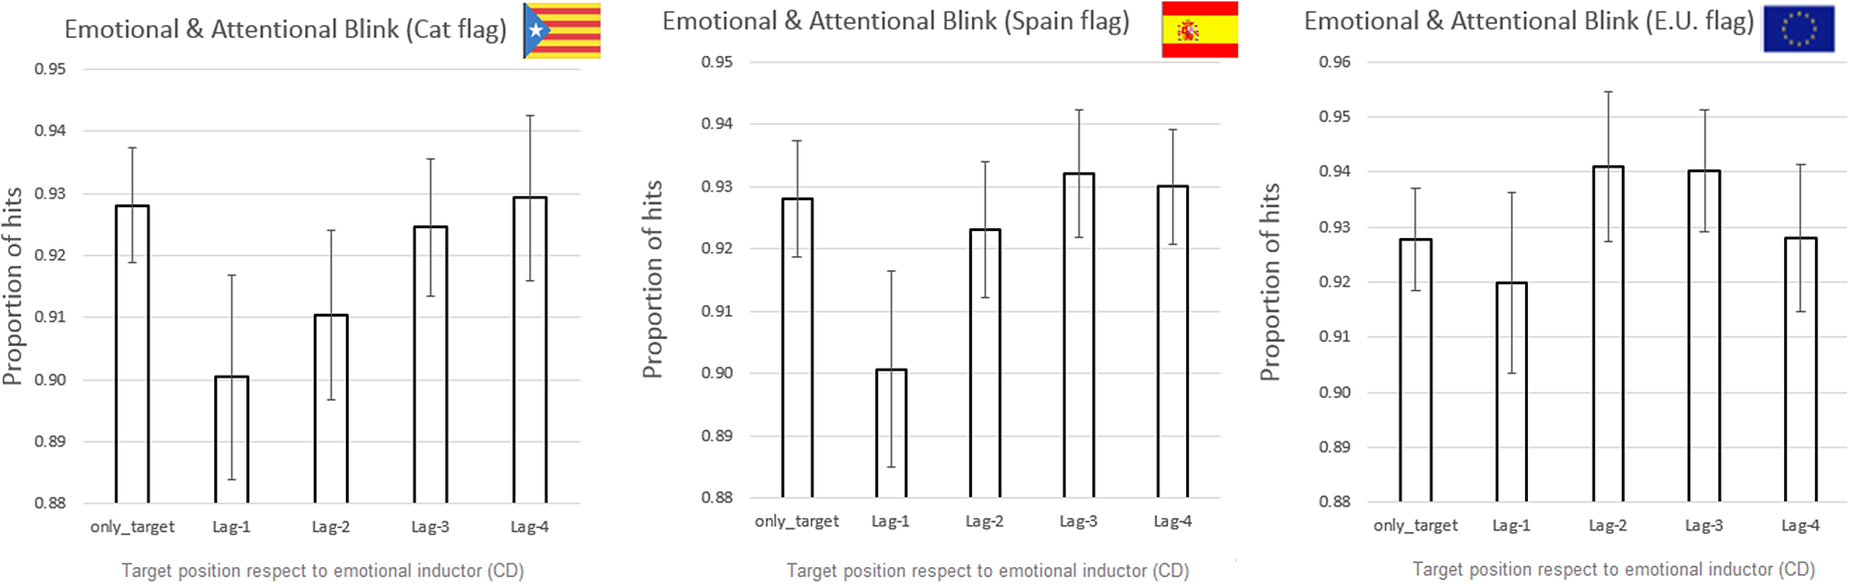
Figure 2. Graphs of the EAB Effect for Each Type of Flag The Catalan independence and Spanish constitutional flag were used as emotional stimuli, and the European flag as a neutral stimulus (Control). Bars are 2 * Standard Error Mean (SEM).
Analogously, it can be observed that the Spanish constitutional flag is also able to provoke emotion induced blindness when Tg appeared in Lag 1, t(52) = .67; p = .05. However, the data of the series that included the neutral European flag do not show EAB. In this case, the difference between the single condition (only target) and presenting Tg preceded by CD in lag 1 was not significant, t(52) = –.38; p = .708.
Analysis of the EAB Strength as a Function of the Flag and Patriotism
To fully interpret the results of the experiment, at the end of the first session we collected four additional data in a post-experimental questionnaire: Age, gender, place of birth. We also asked participants to rate (in 0–10 range) their affinity with the three flags presented as CD in experiment 1A. The self-reported affinity to the flags allowed us to classify the participants in one of the three patriotism categories previously defined (pro-independence, pro-union, and neutral). For each participant, we calculated an index of patriotism (IP: 0 ≤ IP ≤ 1) based on flags affinity self-reported scores. More specifically:
Index of Patriotism = affinity score to Catalan flag / affinity score to Spanish flag.
Participants were assigned to one of the three groups according to the cut-off of the quartile distribution of the IP value (Q2 = .84 and Q3 = 1.20). Thus, when IP > 1.2, participants were labelled as Catalan patriotism (pro-independence group), when .84 < IP < 1.199 were labelled as Neutral patriotism, and when IP < .839, they were labelled as Spanish patriotism (pro-unionist group). Previously, we computed the strength of the EAB by subtracting the hit rate for series appearing only the target (but not the CD) minus the hit rate for series where both the CD and the Tg in Lag–1 were presented. This is a common way of calculating subjects’ performance decline subsequent to the presentation of the emotional stimulus (e.g., see Nieuwenhuis & de Kleijn, Reference Nieuwenhuis and Kleijn2011; Sergent & Dehaene, Reference Sergent and Dehaene2004).
A two-way mixed factorial ANOVA was conducted to examine the main effects and interaction of flags (F-Cat, F-Spain and F-Neutral) and patriotism (P-Cat, P-Neutral and P-Spain) factors on EAB strength, being both “flags” and “patriotism” a three-level within subjects variables. When an effect was significant, Bonferroni tests were conducted. Results did not show significant differences between P- Spain and P-Neutral in the strength of the EAB. Thus, in order to simplify the analyses, given the proximity of the scores and the absence of significant differences between the two, participants with the greatest affinity to the Spanish flag and to the Neutral flag were grouped as Spanish patriotism. Therefore, the ideological affinity of the sample of participants was distributed as follows: 32 subjects (60.4%) were labelled as Catalan patriotism and 21 subjects (39.6%) were labelled as Spanish patriotism.
This ANOVA showed that none of the simple effects reached the established significance (α = .05). However, the interaction between flag and patriotism was significant using quadratic polynomial contrasts, F(1, 51) = 4.62; p = .036; ηp2 = .083. Figure 3 shows that the EAB effect depends on both, the patriotic affinity and the type of flag presented in RSVP.
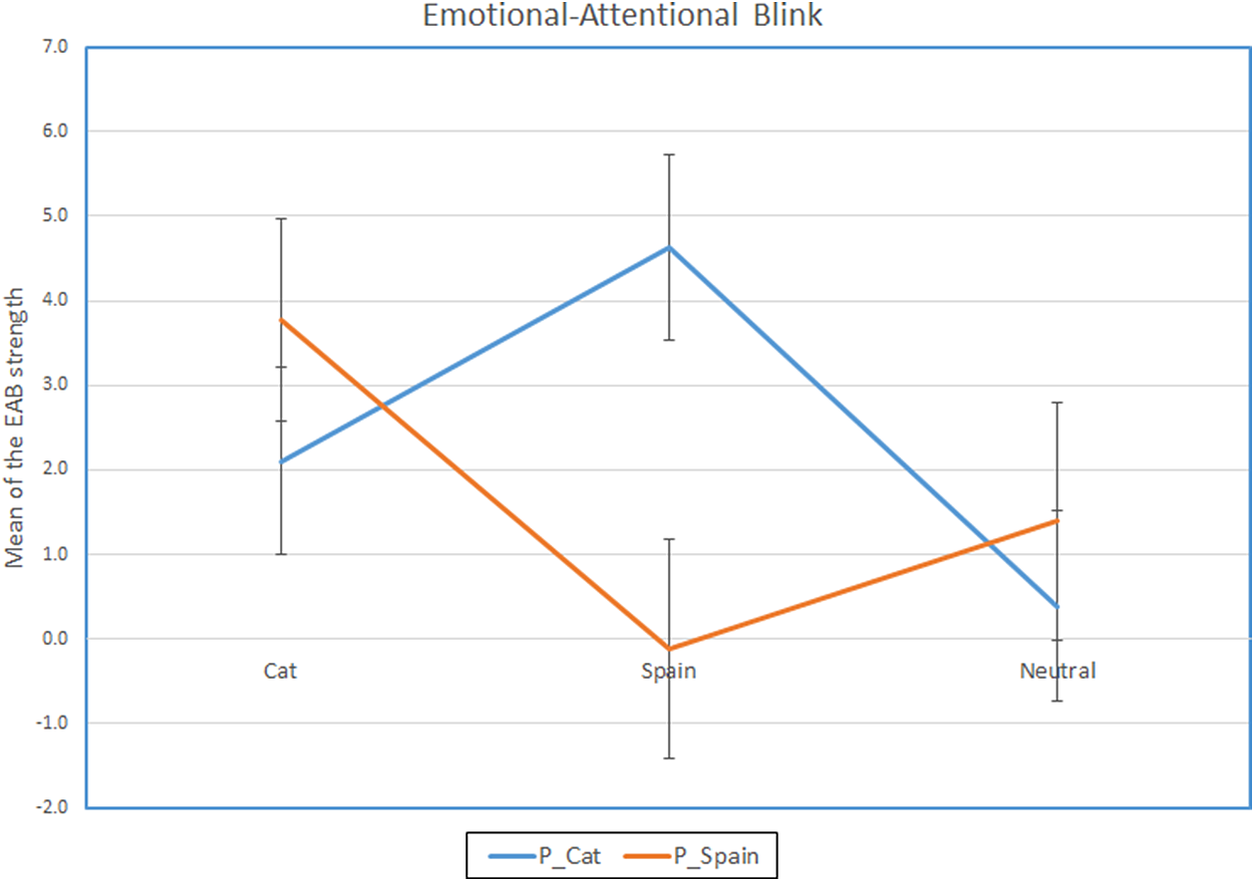
Figure 3. Flag by Patriotism Interaction, Using as a Measure the Mean of the Strength of the EAB Effect. Mixed factorial design: Flags (3) x Patriotism (2). Error bars indicate 2*SEM.
Post hoc contrast tests (Bonferroni) revealed that when the Catalan flag was shown to Catalan pro-independence and to Spanish pro-unionist participants, the EAB effect did not differ significantly. However, when presented with the Spanish flag both groups differed significantly (p = .02). From these results, it can be concluded that the Spanish flag influenced in a different way according to participants’ patriotism, causing a greater EAB effect in the Catalan patriots than in the Spanish ones. However, in the case of the neutral (EU) flag, the effect of EAB was not significant for either patriotic subgroup (Catalan or Spanish).
The hypothesis that some emotional stimuli can capture a large part of the attentional resources, and thus reduce the participant’s performance (detection rate of Tg), has been validated. In the past, most of the studies using emotional stimuli within the AB paradigm (Anderson & Phelps, Reference Anderson and Phelps2001; Keil & Ihssen, Reference Keil and Ihseen2004) have observed that, conditioned to the prior presentation of this type of emotional inductor stimuli, the strength of the AB is weakened until it even becomes annulated. Our results agree those of Vaquero et al. (Reference Vaquero, Frese, Lupiáñez, Megías and Acosta2006), who presented the subjects with RSVP series, showing the extent to which emotional words influenced the effect of AB in the condition of double detection task (detecting T1 and T2). However, this performance deterioration only occurred when T1 consisted of words of negative meaning. Similarly, our results converge with those obtained by other authors (Ciesielski et al., Reference Ciesielski, Armstrong, Zald and Olatunji2010; Most et al., Reference Most, Chun, Widders and Zald2005, Reference Most, Smith, Cooter, Levy and Zald2007) that used the same EAB experimental paradigm. Our emotionally laden stimuli (flags) were capable of provoking EAB as aversive and erotic stimuli did in pioneering studies. In addition, we have verified that the EAB effect can be modulated by the combined action of two factors: Patriotism (IP) and the symbol that represents it (flags). The latter seems to operate as a stimulus that triggers the emotional physiological response, which is capable of causing the EAB effect. In fact, the flag is a symbol with a different meaning according to the sign of participant’s patriotism (Catalan or Spanish).
In short, the analyses of experiment 1A show that flags have the property of inducing participants to make an affective-emotional assessment. Although they were not aware of the influence of the symbol, the flag involuntarily directed their behavior. Results also revealed that participants should have accessed the meaning of the symbol (implicit perception) to make an assessment in emotional terms. This shows how a symbol with emotional meaning can trigger the activity of top-down processing circuits by cancelling (inhibiting, attenuating) the stimulus-driven processing that the task demanded: detecting the light bulb (Tg).
Experiment 1B
Experiment 1A has shown that the emotional stimulus (CD) has the capacity to capture subjects’ attention, despite its irrelevance to respond to the demands of the task (to detect the Tg in the RSVP). In other words, the flags (emotional symbols related to countries) can cause EAB effect. However, the strength of the EAB effect could serve as a cognitive marker of the degree of patriotism if, in addition, it is demonstrated that there is a link between EAB strength and other measures provided by an independent task; informing about the ideological membership of participants. With this aim we have designed experiment 1B, in which we ask participants to make judgments of congruence between pairs of images (political leaders vs flags) while we record their HRV and GSR. The leaders belong to two rival political tendencies (pro-independence vs. pro-unionism) and the flags can be of three types: Local, state or neutral.
Method
Participants
The fifty-three students that participated in Experiment 1A were invited to participate in the second part of the experiment. Of these, only 36 took part in Experiment 1B. In this case, their ages ranged between 18 and 37 years old (M = 20.8; SD = 6.27). According to flag affinity data collected in the previous questionnaire, of the total of 36 participants, 20 (55%) belonged to the Catalan patriotism subgroup, while 16 (45%) belonged to the Spanish patriotism subgroup. Note that we maintain the dichotomous grouping of patriotism (P-Cat vs. P-Spain), dividing the distribution of subjects’ patriotism index into two halves.
Stimuli, Task and Apparatus
The congruency judgments task conducted in the second part of the experiment consisted of pairs of stimuli politicians-flags that participants had to evaluate. On the one hand, we prepared six photographs of well-known local (Catalonia community) and state (Spain) politician’s faces. The three local politicians (C1, C2 and C3, see Figure 4) are leaders pro-independence, while the three state politicians (S1, S2 and S3, see Figure 4) defend to a greater or lesser extent the Spanish constitution. On the other hand, we included six photographs of flags that correspond to the three categories established for the EAB task: Pro-independence, pro-union, and neutral. Each category included two flags, which could promote different emotional intensity (see Figure 4 for details). All images were matched in physical properties (size: 512 x 256 pixels, mean brightness and high spatial frequency power). Thus, as Figure 4 shows, the linear combination of politicians and flags results in 36 pairs of politician-flag stimuli. The couples of stimuli were presented on the same 22-inch LED Samsung screen with spatial resolution of 1920 x 1080 pixels against a white background (104 cd/m2). The task was performed using 4 PCs Intel Core i7 and a GeForce GTX 1050 graphic card supporting the OpenGL mode.
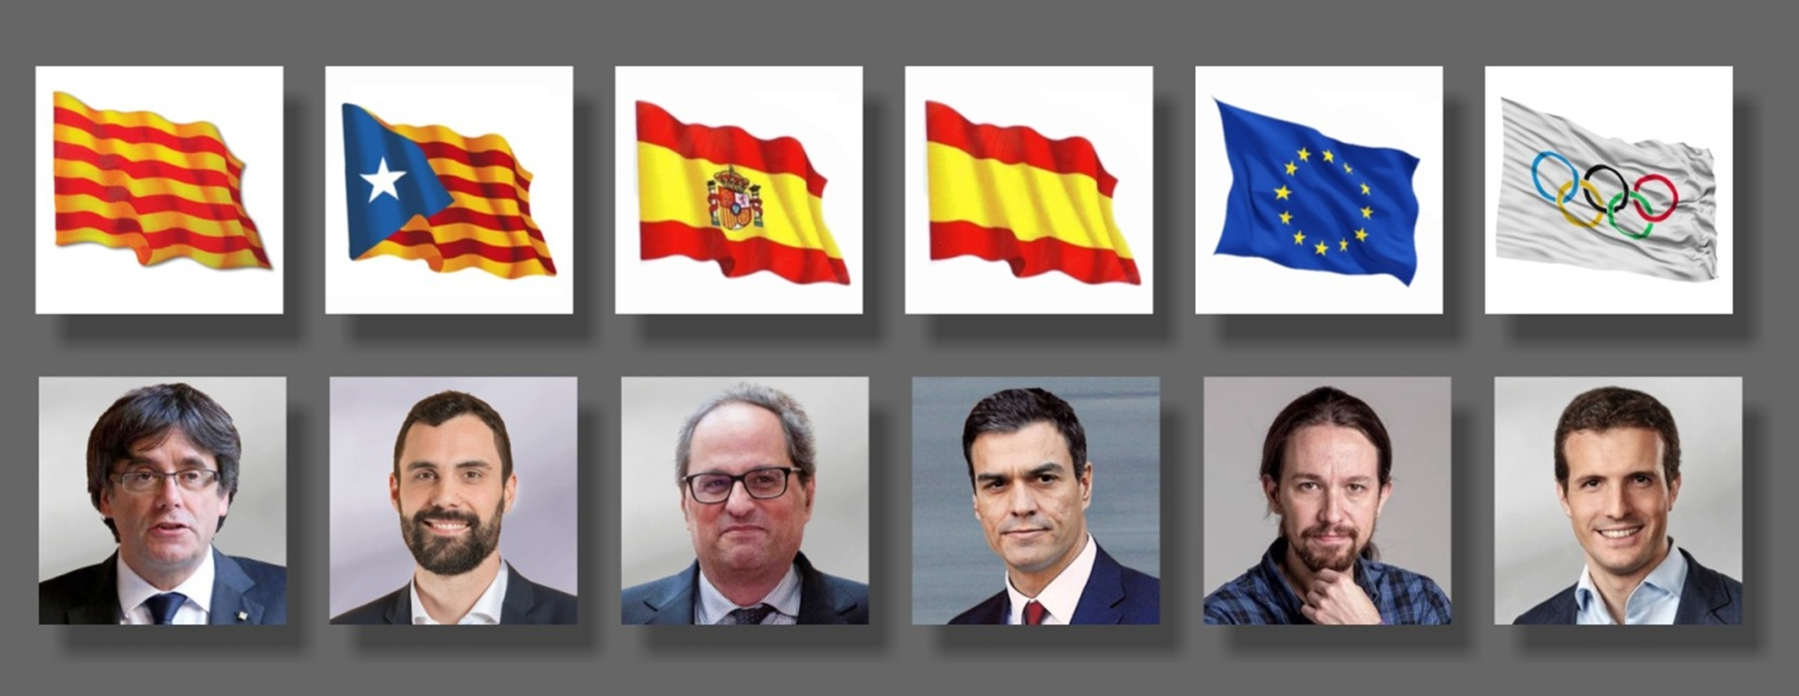
Figure 4. Images of the Six Flags and the Six Politicians Used in the Congruency Test. The three on the left are Catalan politicians, while the three on the right are Spanish politicians. Flags from left to right: Catalonia (autonomous community, independence), Spain (constitutional, non-constitutional), Neutral (EU, Olympic Games).
In order to quantify subjects’ emotional-physiological response to stimuli, two electrophysiological recording devices were used, which measure: (a) the Heart Rate Variation (HRV) and the (b) Galvanic Skin Response (GSR). For that purpose, an open-source optical heart rate sensorFootnote 1 and an open-source GSR sensorFootnote 2 were connected to an analogue-to-digital 16 bits converter (AD1115 Texas Instruments) to improve resolution. Both sensors were connected to a microcontroller board (Arduino-UNO) for data acquisition.
Procedure for the Congruence Judgments Task
Participants were tested in the same lab by using the same boxes and computers than in the EAB task. Firstly, we recorded for 5 minutes the baseline of the electrophysiological parameters while the subjects listened to a relaxing audio. Secondly, participants performed the congruence judgment test with the 36 pairs of politicians-flags, which were randomly presented. While performing this test, HRV and GSR were recorded. Each participant had an HR monitor connected to the index finger and two electrodes to the middle and ring fingers of the non-dominant hand. The test began with a fixation point presented for 1 second in the center of the screen, and immediately after, the coupled stimulus (Leader-Flag) was presented. Participants had to score the degree of congruence between the flag and the ideology that they attributed to the politician. To this end, participants had to drag a Windows-bar graduated in 11 points (0–10), where “0” means a minimum (null) congruence, “5” means a medium (moderate) congruence and “10” a maximum (complete) congruence. Each image was displayed on the screen for 5 sec, during which the physiological measures (GSR and HRV) of participants were recorded. Specific instructions were given to subjects prior the task started. The response stage lasted around 15 seconds in average. Thus, participants spent approximately 12–15 min.
Results and Discussion
Analysis of the Congruence Test Based on Judgments of Leader-flag Pairs
To analyze the consistency of participants’ responses, according to the Leader-Flag pair and the patriotism index, a three-way mixed factorial analysis of variance was conducted. We used Leaders (C1–Puigdemont, C2–Torrent, C3–Torra, S1–Sánchez, S2–Iglesias and S3–Casado) and FlagsFootnote 3 (F-Cat, F-Spain and F-Neutral) as within subjects factors, and the “Index of patriotism” (pro-independence, pro-unionism) as a between subjects factor. As dependent variables, firstly we used the congruence value for each pair of stimuli, and then, the electrophysiological measures, which will be analyzed in the next section.
Results in the congruence test revealed significant main effects for Leaders, F(3.657, 125.204) = 56.83; p < .001; ηp2 = .626), and Flags, F(1, 170) = 16.61; p < .001; ηp2 = .328). The main effect of Patriotism was not significant (p > .438), neither the second order interaction “Leaders x Flags x Patriotism”. However, the “Leaders x Flags” interaction was significant, F(3.682, 125.204) = 53.55; p < .001; ηp2 = .612). This means that depending on the Leader-Flag pair presented, participants assigned a higher or lower score. These results are summarized in Figure 5. Therefore, the trends of greater/lesser affinity towards the leaders were analogous for both types of patriotism as reflected in Figure 5. In addition, the analysis shows that there is some informational redundancy among politicians, in such a way that the three Catalan leaders were perceived with greater affinity to the Catalan flag and lower affinity to the Spanish flag. On the contrary, the three Spanish leaders were perceived with greater affinity to the Spanish flag and lower affinity to the Catalan flag; although, in the case of S1–Sánchez, these differences are smaller. Thus, it seems appropriate to reduce the analysis to the two leaders who maximize the affinity scores perceived by the participants. That is why, only two leaders, C3–Torra and S3–Casado will be computed in subsequent analyses. We realize that restricting the analysis to only the most antagonistic Leader-Flag cases increases the probability of committing Type I error. However, we have assumed this constraint in an attempt to simplify the analyses and focus on those cases where emotional reactivity is really maximized. Naturally, due to the fact that only these two extreme cases have been statistically analyzed, the conclusions are limited to the Leader-Flag pairs that provoke more extreme responses.

Figure 5. Means of the Congruence Judgments according to the “Leaders by Flag” Stimuli Presented to the Participants in the Congruence Test. Error bars indicate 2* SEM.
Analysis of Congruence Judgments Based on Electro-Physiological Measurements
Analysis of the Heart Rate Variation (Standard Deviation of the IPI)
The same 36 pairs of Leader-Flag stimuli depicted in the previous section were presented to participants while registering the Heart Rate Variation (HRV) with an HR monitor transducer, controlled by an Arduino-UNO circuit. From this record, we counted the peaks (heartbeats) and the temporal interval that separates them (inter-peaks-interval, IPI, or RR intervals) by using a Matlab script. Finally, we calculated the standard deviation of the IPI (also referred as RRSD: Standard deviation of the heart period). Thus, the dependent variable used as a measure of the emotional reactivity of each participant was the standard deviation of the IPI-HRV. Heart rate variation (HRV, beat-to-beat changes in the heart period, R-R interval) is increasingly used to quantify cardiac autonomic regulation and to identify patients at an increased risk for adverse cardiovascular events (Appel et al., Reference Appel, Berger, Saul, Smith and Cohen1989; Berntson et al., Reference Berntson, Bigger, Eckberg, Grossman, Kaufmann, Malik, Nagaraja, Porges, Saul, Stone and Molen1997; Billman, Reference Billman2011, Reference Billman2013). Therefore, a greater variability in IPI is associated with a greater emotional reactivity.
A mixed ANOVA with two within-subjects repeated measures factors, “Leaders” (with two levels: C3–Torra and S3–Casado) and “Flags” (two levels: Catalan flag and Spanish flag) and “Patriotism” as a between-subjects factor (two levels: P-Cat and P-Spain) was applied to the participants’ HRV record. Results showed that participants’ IPI-HRV only differed significantly in the second order interaction “Leaders x Flags x Patriotism”, F(1, 35) = 4.71; p = .037; ηp2 = .119. Neither the main effects of the factors, nor the first order interactions were significant (p > .05). Figure 6 shows this interaction, in two separate graphs according to the type of patriotism.

Figure 6. Line Graph Showing the Second Order Interaction “Leaders (2) x Flags (2) x Patriotism (2)” Using as Measure (DV) the Heart Rate Variation (IPI-HRV or RRSD). Error bars indicate 2*SEM.
Post hoc analysis (Bonferroni’s test) revealed that the emotional reactivity changed depending on the combination Leader-Flag presented, but also depending on the patriotism of each subject. Thus, on the one hand, for Catalan patriotism, when S3–Casado was paired with the Catalan flag, the HRV was significantly, t(19) = 2.57; p = .018, higher (M = 16.92) than when it was paired with the Spanish flag (M = 12.08). By contrast, when C3–Torra was paired either with the Catalan or Spanish flag, the HRV had a similar low value (M = 11.04 and M = 11.73, respectively). On the other hand, for Spanish patriotism, when the leader S3–Casado was paired with the Catalan flag, the HRV was statistically equivalent to that with the Spanish flag (M = 12.08 and 14.18 respectively). Conversely, the leader C3–Torra showed the inverse pattern, namely, when he was paired with the Catalan flag, the HRV was significantly, t(15) = 2.79; p = .014, higher (M = 15.31) than when he was paired with the Spanish flag (M = 11.04).
Overall, these results show that in the subgroup of Catalan patriotism, the HRV was higher for inconsistent than for congruent pairs Leader-Flag. However, in the subgroup of Spanish patriotism, the inverse pattern occurs, that is, HRV was higher for congruent than for inconsistent pairs Leader-Flag. Therefore, it seems that, according to patriotism, the HRV of subjects responds differently to cognitive dissonance or oddness that causes a pair of stimuli that do not fit their beliefs.
Analysis of the Amplitude Range in GSR
The same 36 pairs of Leader-Flag stimuli were presented to subjects while recording their GSR by an Arduino-UNO circuit. From this record, we calculated the Amplitude Range (AR) in GSR for each pair of images. This measure is usually considered as an indicator of the emotional reactivity of subjects when presented with emotional stimuli, generally interpreted as a correlate of the activation generated by the stimuli (Ogorevc et al., Reference Ogorevc, Geršak, Novak and Drnovšek2013). According to Ogorevc et al. (Reference Ogorevc, Geršak, Novak and Drnovšek2013), electrodermal activity is a physiological parameter depending on sweat gland activity. Since sweat gland activity is controlled by the sympathetic nervous system, skin conductance measurement is used as an indicator of psychophysiological arousal.
The same mixed ANOVA used with the HRV was applied to the participant’s AR record. Result showed that the AR only differed significantly in the second order interaction “Leaders x Flags x Patriotism”, F(1, 34) = 4.23; p = .047; ηp2 = .111. Neither the main effects of the factors, nor the first order interactions were significant (p > .05). Figure 7 shows this interaction in two separate graphs, according to the type of patriotism.
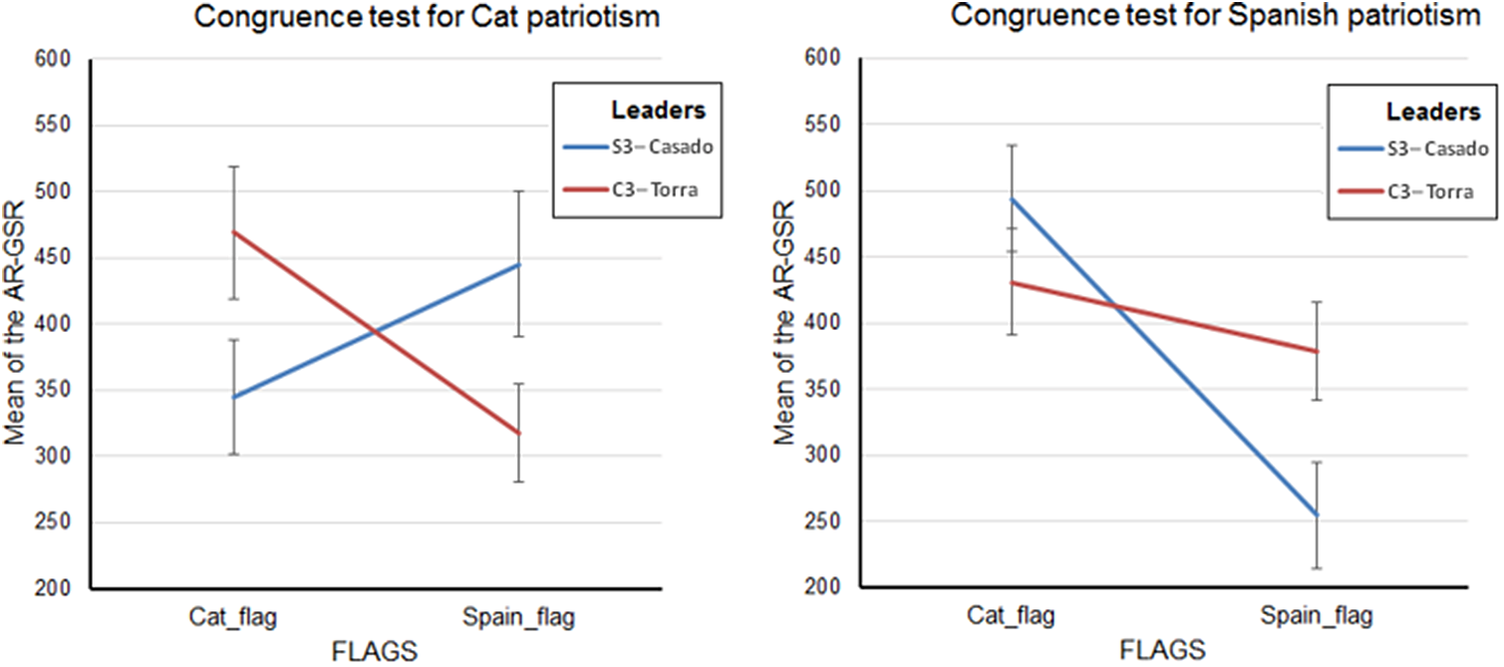
Figure 7. Line Graph Showing the Second Order Interaction “Leaders x Flags x Patriotism” Using as Dependent Variable the Amplitude Range of the GSR. Error bars indicate 2*SEM.
Post hoc analysis (Bonferroni’s test) revealed that the emotional reactivity changed depending on the combination Leader-Flag presented, but also depending on the patriotism of participants. Thus, on the one hand, for Catalan patriotism, when the leader S3–Casado was paired with the Catalan flag, the AR-GSR was significantly, t(19) = –4.24; p < .001, lower (M = 345) than when was paired with the Spanish flag (M = 445). Whereas, if the leader was C3–Torra, the AR-GSR was significantly, t(19) = 9.06; p < .001, higher when paired with the Catalan flag (M = 469) than when paired with the Spanish flag (M = 317). Besides, also significant differences between the two leaders (S3–Casado and C3–Torra) were found in both, Catalan, t(19) = –12.76; p < .001, and Spanish, t(19) = 10.85; p < .001, flags.
On the other hand, for Spanish patriotism, when the leader S3–Casado was paired with the Catalan flag, the AR-GSR was significantly, t(15) = 26.84; p < .001, greater (M = 494) than when he was paired with the Spanish flag (M = 255). However, when the leader C3–Torra was paired with the Catalan flag, the AR-GSR was approximately equal to that paired with the Spanish flag (M = 431 and M = 374, respectively), a non-significant difference. Moreover, the AR-GSR differed significantly according to the leaders for the Spanish flag, t(15) = –14.21; p < .001, but not for Catalan flag (p = .083).
In summary, these results converge with those obtained for the IPI-HRV dependent variable, in that patriotic groups show inverse patterns in both measures. However, they diverge in the directions of the patterns. In the HRV measure, the group of Catalan patriots shows a greater reactivity to inconsistent pairs, while in the GSR measure, a greater reactivity to consistent pairs is observed. In the group of Spanish patriots, practically the opposite occurs in both measures.
Relationship between Cognitive and Emotionality Measures
To verify the importance with which each factor contributes to predict the EAB strength caused by each of the three flags used as CD in the EAB task, we conducted a stepwise multiple linear regression model for each emotional inductor using the EAB effect as criteria. As predictors, we used parameters obtained by the post experimental questionnaire (self-reported flag affinity) and the Congruency test (Leader-Flag perceived affinity, IPI-HRV and AR-GSR measures). Only for the Catalonia’s pro-independence flag the regression model was significant (R = .93; p < .001). A significant regression equation was found, F(13, 35) = 11.07, p < .001. This model accounted for 86.7 % (R = .93; R2Adjusted = .79; p < .001) of the variability of the EAB strength. Multicollinearity was not severe, with variance influence factors (VIF) ranging between 1.5–5.4. Based on standardized beta weights shown in Table 1, the significant predictors of EAB strength when using the pro-independence flag as an emotional stimulus were the congruence judgment of the pairs S3–Casado – Catalan flag (–.639) and S3–Casado – Spanish flag (–.457), and the AR-GSR of the pair “S3–Casado – Spanish flag (–.587)”.
Table 1. Regression Coefficients (B), Standardized Beta Weights (β), and VIFs (Variance Influence Factors) for the Stepwise Regression Model of the Strength of the EAB Effect.

These results suggest that measuring these cognitive and physiological factors, the performance in the EAB experimental paradigm could be predicted from participants’ responses. Certainly, the fact that the regression model did not reach significance when the emotional stimulus was the Spanish (pro-unionist) or the European (neutral) flags seems to occur because patriotism has emerged as a crucial factor in the Congruency test. In addition, another limiting factor is due to the size and variety of the participants’ sample. Indeed, the sample where participants reported affinity to the Catalan flag (n1 = 32) is larger than the sample with affinity to the Spanish flag (n 2 = 21).
General Discussion
In this study we have used flags as one particular type of emotionally laden stimuli. The meaning that each person gives to this symbol depends on the strength of the belief that underpins it, that we have operationalized as patriotism. Here we tried to verify whether the EAB, an effect that must take place on high (central) processing pathways (Yamasaki et al., Reference Yamasaki, LaBar and McCarthy2002), was sensitive to patriot feeling, a belief linked to emotions of which the subject is not always aware. This emotional component must be thoughtlessly processed at the subcortical level but is susceptible to detection by electrophysiological measurements during the participants’ responses (Dehaene, Reference Dehaene, Battro, Dehaene, Sánchez-Sorondo and Singer2013; Dehaene et al., Reference Dehaene, Charles, King and Marti2014; Malik et al., Reference Malik, Bigger, Camm, Kleiger, Malliani, Moss and Schwartz1996).
The results of the first task showed that at least some national symbols (emotional inducers) were able to provoke EAB effects, despite not being relevant stimuli for participants. However, our participants were not affected by the neutral flag (EU), which indicates that only the flags felt as emotionally closer (by attraction or aversion), have the capacity to provoke attentional blindness. Strictly speaking we cannot affirm that the inducing stimuli act consciously or unconsciously because subjects’ awareness of the stimuli was not measured in the study. However, we believe that performance of the subjects (detection of Tg) is modulated by the critical distractor, to which they have accessed and assessed implicitly according to their beliefs (patriotism). So, in this study we show under which conditions an emotionally laden stimulus influenced by top-down processing (patriotic beliefs), can cancel out bottom-up processing (detection of Tg). More generally, the study shows how the irrational (emotion) imposes on the rational (decision). These results converge with those obtained by Awh et al., (Reference Awh, Vogel and Oh2006) who found that the P300 component was completely suppressed during the AB period, and this fact was consistent with the behavioral observations that the target words presented were unavailable for conscious report. Therefore, selective attention enables the efficient processing of new information during multiple stages of processing including both early sensory and post-perceptual processes. In other words, we see how a significant emotional stimulus can take control of the behavior thoughtlessly or involuntarily, cancelling out voluntary and aware activity. Note that the emotional stimulus has been selected because of its relevance to the participant, not because of the task demands. Therefore, we find that emotional processing competes both with conceptually-driven and data-driven processing, with the former (higher level) prevailing. In addition, the analyses carried out made it possible to verify the hypothesis that the EAB depends on the combination of a particular flag and the specific patriotism of the subjects. That is, the strength of the EAB was significantly different between ideologically rival flag-patriotism combinations (see Figure 3). Note that, to have access to the meaning of the symbol (flag) some degree of awareness is required (Dehaene, Reference Dehaene, Engel and Singer2008; Shadlen & Kiani, Reference Shadlen, Kiani, Dehaene and Christen2011). In this regard, remember that some researchers (e.g, Dehaene & Naccache, Reference Dehaene and Naccache2001) defend the idea that inhibitory processes cannot be carried out without awareness.
As for the second task, analyses of the perceived congruence judgments between each coupled stimulus (Leader-Flag) were consistent with the sign and magnitude of each participant’s patriotism (Figure 5). We found that two leaders, C3–Torra (Autonomous community) and S3–Casado (State) maximized congruence responses, and for this reason, the analyses of the second task have not taken into account the other leaders. The hypothesis that measures derived from electrophysiological records (IPI-HRV and AR-GSR) would be sensitive to this type of patriotic feeling has also been validated (see Figures 6 and 7). Indeed, the interaction effect “Leader x Flag x Patriotism” was significant for both IPI-HRV (p = .037), and AR-GSR (p = .035). Interestingly, the emotional reaction to the Leader-Flag coupled stimuli tends to occur opposite in the two dependent variables (HRV and GSR) used. For the HRV, the Catalan patriotism subgroup reacts above the baseline when the pair is inconsistent, while the Spanish patriotism subgroup does it when the pair is congruent. Given the current situation in Catalonia, in which supporters of independence (Catalan patriotism) have generated an anti-Spanish discourse, it has sense that the confrontation between the independence flag and a politician defending the Spanish constitution (or the opposite stimulus: Catalan politician-Spanish flag) could generate some aversion (HRV results). On the other hand, Catalans who also consider themselves Spanish (Spanish patriotism) do not have a well-formed anti-Catalan discourse. This could explain why in this subgroup, the confrontation between inconsistent pairs (Leader-Flag) does not provoke a physiological reaction above the baseline, as tends to happen with the congruent pairs.
In any case, this interpretation is only supported for HRV data, but not for GSR data. In the group of Catalan patriots, we obtained that reactivity increases for congruent pairs and decreases for inconsistent pairs. Just the opposite is the case with Spanish patriots. The results of HRV and GSR could be reporting different aspects. While the HRV measure appears to be sensitive to inconsistency in the Leader-Flag pair, altering the regularity of the heart rate, the GSR measure appears to be sensitive to congruence between the two elements of the pair. The fact that Catalan patriots exhibit a different pattern than Spaniards may be related to the fact that they have a dominant position in the social narrative that does not fear the consequences of their responses, while the Spanish subgroup fears expressing their beliefs.
Our conjecture that the strength of the EAB could be predicted from data obtained by participants in the different tasks and evaluations (patriotism, congruence judgments, physiological records) has not provided consistent results, probably because the sample used for Spanish patriotism is not large enough. Anyway, the fact that the regression model was significant for the Catalan flag, accounting for the 86.7% of the EAB strength variability, suggests that by measuring the cognitive and physiological factors used in this study, we could predict the participants EAB performance in an experiment using RSVP series. Two of these predictive variables are related to the emotional reactivity produced by a political leader subjectively perceived (by Likert scale) as opposed to the independence of Catalonia (Pablo Casado). This is confirmed by the fact that the GSR to the pair “S3–Casado-Spanish flag” reached a highly significant weight (p < .001). Thus, matching this leader with the Spanish and Catalan flags produces maximized responses that allow anticipating the EAB effect. It can be said that, in the Catalan territory, the pro-independence group perceive this leader as an emotional trigger.
To conclude, the impact of this type of belief (patriotism/nationalism) on attention has both practical and theoretical implications. At the methodological level, for example, the intensity with which a particular belief is rooted in a person could be quantified by measuring the strength of the EAB effect through emotional stimuli that represent or support that belief. In addition, on a practical level, the EAB paradigm could allow us to detect alterations in sensitivity to relevant emotional stimuli in some psychiatric disorders (e.g., phobias, post-traumatic stress disorder, eating disorders, etc.), or those derived from addictions such as alcoholism, drugs or gambling. On a theoretical level, a way is opened that could allow examining the influence of feelings and emotions evoked by a symbol (e.g., a flag) significant for the subject on cognition (attention). This would help understand the extent to which early processing that receives automatic attention is flexible, determining access to its meaning and, therefore, to consciousness. In the sense that these symbols represent ideas and depend on the context in which they are framed, being open to subtle top-down components (expectations, demands, interests, desires, preferences, etc.).
Finally, we will point out four limitations of this study. To begin with, the size of the sample of participants. With regard to matching the number of subjects in the patriotic groups, it would be convenient to extend this study to other regional areas of our country and to contrast the data with those registered in our local community. Secondly, representation by sex should be matched and other social strata of the population, in addition to university students, should be included. Thirdly, since we have focused the analysis on the most rival Leader-Flag pairs (antithetical pairs), for simplicity, this could slightly increase the risk of committing Type I error. Finally, in future developments in this line of research, electro-physiological measurements should be replicated, thus verifying the consistency of the discrepancy obtained between data from the GSR and HRV registers.
Conflicts of Interest:
None.
Funding Statement:
This research received no specific grant from any funding agency, commercial or not-for-profit sectors.


