


For policymakers, determining how to bend the cost curve of health care down is an incredibly important task. Health care costs in the United States have increased to 17.9% of GDP in 2013 and are projected to increase as a proportion of GDP, to 19.6% in 2021 (National Health Expenditure Projections, 2011–2021, 2012). Health care costs have increased much faster in the United States than the OECD average than in other major industrialized countries, and the U.S. cost curve for medical expenses lies above the cost curves for other major industrial nations (Kaiser Family Foundation, 2011).
As a result of rising health care costs, policymakers have enacted different policy prescriptions to bend the health care cost curve downward. A frequently proposed solution is the passage of several different types of tort reforms. For example, both the Bush and Obama administrations have discussed the importance of a federal tort reform law to control cost growth (Born et al., Reference Born, Viscusi and Baker2006; Mello et al., Reference Mello, Chandra, Gawande and Studdert2010). In 2009, the Congressional Budget Office advocated tort reform in a letter to Sen. Orrin Hatch (Congressional Budget Office, 2009) and the American Medical Association (AMA) and other professional organizations advocated tort reform in a letter to President Obama in 2009 (American Medical Association, 2009). Several states have implemented various tort reform laws (Avraham, Reference Avraham2011). Moreover, economists have repeatedly evaluated the effectiveness of such tort reform laws in containing health care costs (Kessler and McClellan, Reference Kessler and McClellan1996; Di Matteo and Di Matteo, Reference Di Matteo and Di Matteo1998; Viscusi and Born, Reference Viscusi and Born2005; Avraham et al., Reference Avraham, Dafny and Schanzenbach2009; Sloan and Shadle, Reference Sloan and Shadle2009; Avraham and Bustos, Reference Avraham and Bustos2010; Paik et al., Reference Paik, Black, Hyman and Silver2012). These studies have approached the questions from several different perspectives but have failed to reach a consensus. Furthermore, both economic and legal literatures examine only the presence of liability reforms; however, these reforms to liability rules are written in several different ways. It is plausible the differences in the details are assigned to states as-if randomly and have differential effects on health care spending growth. The following analysis suggests the details of the laws may have significantly different effects on health care spending growth and these effects may be causal. Additionally, this paper also uses several different strategies, including placebo regression analysis and leading variables, to support the robustness of the initial results.
1. Tort reform and health care costs
Tort reform laws vary considerably across the states, and dissimilarities in these provisions may have different effects on health care expenditure growth. The literature discusses different types of tort reforms including caps on total damages, caps on non-economic damages, caps on punitive damages and joint and several liability (JSL) reforms.Footnote 1
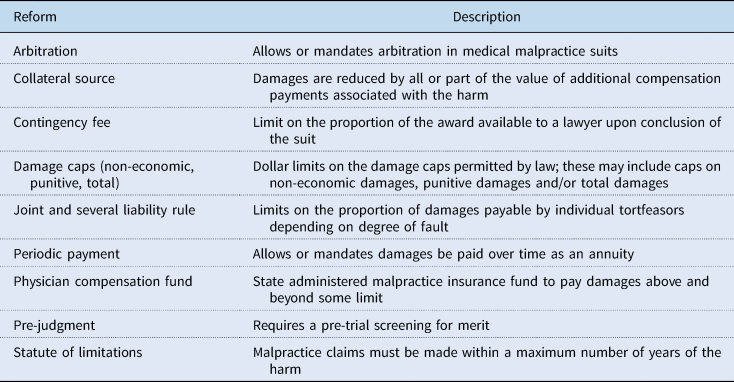
State-level tort reforms are diverse; however, current discussions of tort reforms have centered around decreasing health care costs by decreasing medical malpractice premiums paid by physicians and reducing the amount of ‘positive’ defensive medicine (Avraham and Bustos, Reference Avraham and Bustos2010). Throughout the last 50 years, these reforms have taken many different forms. Hennesy and O'Neill (Reference Hennesy and O'Neill2004) discusses the following types of reforms related to medical practice: periodic payment reform, collateral source reform, damage caps, JSL rule reforms, contingency fee reform, arbitration, pre-judgment protocols, a statute of limitations for claims and state-based physician compensation funds. Similar to Hennesy and O'Neill (Reference Hennesy and O'Neill2004), I describe some of these reforms in Table 1. This paper seeks to evaluate only the effects of changes to JSL rule reforms.
Table 1. Description of tort reforms
Additionally, there are also indirect goals of tort reform. By decreasing the likelihood of being the defendant in a tort lawsuit, proponents of tort reform claim doctors will be less likely to engage in ‘defensive medicine’, medical procedures with very few likely health benefits and very high financial costs only to prevent future malpractice claims (Kessler and McClellan, Reference Kessler and McClellan1996). Therefore, there are many different mechanisms by which tort reform can affect health care costs and charges in the economic theory. Furthermore, these mechanisms have divergent effects on health care spending.
A large portion of the research about the effects of tort reform investigates the effects of damage caps. First, Kessler and McClellan (Reference Kessler and McClellan1996) use 3 years of Medicare claims to investigate the effect of damage caps on individual medical expenditures. In 1984, 1987 and 1990, they show the implementation of damage caps has a negative effect on medical expenditures, while having no impact on measures of health outcomes.
These authors show a similar result in their 2002 paper reviewing the effects of damage caps on expenditures and health outcomes for elderly cardiac patients. Using Medicare data from 1984 until 1994, Kessler and McClellan (Reference Kessler and McClellan2002) investigate the effects of tort reform and managed care to show that damage caps have a significant negative effect on hospital expenditures.
However, other research has investigated the impact of JSL tort reforms. JSL reform is an attempt to link liability directly to individual actors. Traditionally, medical liability has been viewed as joint liability (JL), meaning any entity or individual associated with the injury can be held fully liable for all damages. This allows plaintiffs to sue ‘deep pocket’ actors, such as hospitals, for full damages even though they may have had very little to do with the specific harm. For example, under a regime of JL, a plaintiff could sue only the hospital and receive full payment for all damages. Under a several liability (SL) reform, the plaintiff would have to sue every actor involved in the malpractice to collect full payment for damages. JSL reforms use several methods of limiting the application of JL and mandating the application of SL in a variety of situations.
Furthermore, Currie and MacLeod (Reference Currie and MacLeod2006) and Carvell et al. (Reference Carvell, Currie and MacLeod2012) investigate the effects of JSL reform on pregnancy complications and accidental death rates. This research demonstrates that liability reform reduces pregnancy complications and reduces accidental death rates, suggesting tortfeasors take more care under regimes of SL. The authors conclude that doctors, knowing they must be sued for the plaintiff to collect full damages, are more careful. This argument does not rely on defensive medicine or an increase in the number or amount of malpractice claims, but instead on an actual decrease in medical malpractice.
Researchers have also considered the effects of JSL reform on other outcomes. Avraham (Reference Avraham2007) shows JSL reduces the number of malpractice payments made. Furthermore, Avraham and Schanzenbach (Reference Avraham and Schanzenbach2010) and Avraham et al. (Reference Avraham, Dafny and Schanzenbach2010) show JSL reform deceases the rate of individuals covered by private insurance companies but also reduce insurance premiums by 1–2%, respectively. Additionally, Viscusi and Born (Reference Viscusi and Born2005) show JSL also decreases malpractice insurance company loss ratios and can increase malpractice insurance company profits. They conclude this means malpractice companies are paying a smaller amount to plaintiffs in malpractice lawsuits. Lastly, Sloan and Shadle (Reference Sloan and Shadle2009) show JSL reform may decrease Medicare payments for hospitalizations; however, this finding was not robust to multiple specifications. These authors also suggest JSL must have an impact on health care costs. They induce the JSL reforms must decrease health care costs because malpractice payments are fewer and smaller and insurance premiums are decreasing. However, there is no direct evidence for this claim.
Despite several JSL reform studies, none of the existing research attempts to provide any direct evidence about health care costs or insight into the differential effects of different types of JSL reforms. This paper builds on previous research by directly addressing costs by using the growth rate of health care costs and examining the effects of different types of JSL reforms. States have implemented JSL by banning JL, limiting the circumstances in which JL can be applied, and defining ‘fair-share’ liability laws.Footnote 2
2. Data and empirical methods
I assembled panel data for states for 1996–2009 from a variety of different sources. The primary dependent variable is the annual percentage growth in personal health care by state. These data were collected from the 2011 Health Expenditures by State of Residence database from the Kaiser Family Foundation State Health Facts (http://kff.org/statedata/). State income data were collected from the Bureau of Economic Analysis. The demographic variables for the states were collected from the U.S. Census Bureau (2012). Health status variables that may affect health care expenditures were collected from the CDCs Behavioral Risk Factor Survey. Finally, data about the type and timing of tort reforms were found in the Database of State Tort Law Reforms 4th Edition (DSTLR-4), the most comprehensive and well-maintained database of state tort laws (Avraham, Reference Avraham2011). Table 2 presents the descriptive statistics for the independent and dependent variables.
Table 2. Descriptive statistics

Furthermore, Figure 1 presents a box and whisker plot of the growth rate in per capita health care expenditures illustrating the variability in state health care expenditure growth rates.

Figure 1. Growth rates of personal health care expenditures.
This paper will use a difference-in-differences model with fixed effects to estimate the causal impacts of tort reform laws. In the panel of 50 states, we can examine the differences in the average growth in personal health care spending. This model with fixed effects will control for time and state invariant characteristics. Therefore, the econometric model that will be estimated is

where Yst is the year over year percentage change in personal health care expenditures, Rst = 1 if the state, s, had a specific tort reform law in effect at time t. Therefore, β 1 is the difference in differences parameter of interest. Furthermore, Xst is a vector of time-varying control variables.
Following the model estimated in Cuckler and Sisko (Reference Cuckler and Sisko2013), the variables included in the estimation are as follows: the percentage change in the proportion of the state's population that is uninsured, the percentage in per capita community hospital beds in a state, the percentage change in the African-American, female and over age 65 proportions of the populations, the percentage change in real income and the percentage change in the ‘bad health index’. The bad health index was created to follow the index in Cuckler and Sisko (2013) and is defined as the product of the proportion of the population that smokes and the proportion of the population that is obese for a given state. finally, cs and vt are state fixed effects and time fixed effects respectively. Standard errors have been clustered by state.
3. Results
The basic results are shown in Table 3. First, as a state's population becomes more African-American, health expenditure growth decreases. Second, as real income grows, the growth in health care spending also increases. Additionally, this evidence also shows that the impacts of JSL reform are large, reducing aggregated personal health care expenditures by 0.477 percentage points. However, several different types of liability reforms are captured by measuring the effects of JSL reforms. An outstanding question is whether different types of liability reforms have differential impacts across health care spending. Evaluation of the different impacts of different types of liability reforms is the primary contribution of this paper to the existing literature.
Table 3. Regression 1

aDependent variable is percentage growth rate in per capita health care expenditures.
bStandard errors clustered by state are given in parentheses.
*0.1 significance, **0.05 significance, ***0.01 significance.
The different types of liability reforms are JL bans (Ban), limiting JL to situations where the responsible defendants acted in concert (Concert), limiting JL to situations where the responsible defendants acted with intent (Intent), limiting JL to situations where the defendant is responsible for at least 50% liability (Fifty), where the plaintiff is blameless (Blameless), where the defendant bears more responsibility than the plaintiff (Greater), and a synthetic variable that accounts for any situation where the defendant bears more responsibility than the plaintiff (Any). The Any variable includes any state with either a greater liability standard, 50% liability, or blameless plaintiff JL rules. These independent variables are listed in the first column of Tables 4 through 6.
Table 4. Per capita expenditure growth

aDependent variable is percentage growth rate in per capita health care expenditures. Standard errors, in parentheses, are corrected by clustering at the state level.
bControls for state-level changes in the bad health index, uninsurance rate, community hospital beds per capita, proportion of the state that is African-American, female and over 65 and changes in real income.
*0.1 significance, **0.05 significance, ***0.01 significance.
Table 5. Medicare per enrollee expenditure growth

aDependent variable is percentage growth rate in per Medicare enrollee health care expenditures. Standard errors, in parentheses, are corrected by clustering at the state level.
bControls for changes in the bad health index, uninsurance rate, community hospital beds per capita, proportion of the state that is African American, female and over 65 and changes in real income.
*0.1 significance, **0.05 significance, ***0.01 significance.
Table 6. Per Medicaid enrollee expenditure growth

aDependent variable is percentage growth rate in per Medicaid enrollee health care expenditures. Standard errors, in parentheses, are corrected by clustering at the state level.
bControls for changes in the bad health index, uninsurance rate, community hospital beds per capita, proportion of the state that is African American, female and over 65 and changes in real income.
*0.1 significance, **0.05 significance, ***0.01 significance.
The dependent variables are listed in the top row of Tables 4–6. These dependent variables are different types of health care spending growth. The first category is growth in aggregated health care expenditure, which spending on hospital care, home health care, nursing home care, physician and professional office visits, prescription medications, dental care and durable medical equipment. The next four categories are specific types of health care spending–growth in expenditures for hospital care, home health care, nursing home care and professional services, such as doctor visits. Additionally, in the following tables each cell contains an estimate and robust standard error for separate regressions.
The next set of results is presented in Table 4. Using disaggregated spending growth, the analysis can help determine if specific JSL reforms have a statistically significant impact on different sources of health care expenditure growth. Although all forms of personal spending growth are negatively correlated by JSL reform, only aggregate spending growth as well as physician and professional services are significantly affected by any JSL reform when all types of JSL reforms are combined.
There are meaningful differences in the effects of different forms of JSL reforms. For example, JL bans are never associated with statistically significant decreases in spending growth. Limiting JL to defendants who acted in concert and defendants who act intentionally have both positive and negative statistically significant effects on different forms of health care spending growth. Reforms limiting JL to cases of intentional torts lead to a 1.1 percentage point increase in the growth rate for hospital spending, but a negative 2.2 percentage point decrease in the growth rate for physician spending. Acts in concert reforms are associated with a 5.3 percentage point increase in home health care spending growth and a 1.2 percentage point decrease in the growth in nursing home spending. Similarly, reforms limiting JL to defendants who are at least 50% liable is associated with a 3.4 percentage point increase in the growth rate of home health care spending and a 1.2 percentage point decrease in nursing home expenditure growth. Also, the synthetic variable for any type of JSL reform that limits the application of JL to cases where the defendants are at least as liable as the plaintiff is associated with a 1 and 1.8 percentage point decrease in aggregate spending growth and nursing home spending growth respectively.
More importantly, the JSL reform that limits JL to situations where the plaintiff is blameless or defendant bears more blame than the plaintiff have negative statistically and economically significant effects on expenditure growth rates including aggregated personal expenditure growth, hospital expenditure growth, nursing home expenditure growth and physician services expenditure growth. Blameless plaintiff reforms are associated with a 0.4, 2.9 and 1.3 percentage point decrease in aggregated, hospital and clinical services spending growth respectively. However, blameless reforms are also associated with a 1.2 percentage point increase in hospital spending growth. Reforms that are written such that the defendant can be held jointly responsible so long as s/he is more liable than the plaintiff are associated with approximately 1.2, 2.1, 2.1 and 1 percentage point decreases in aggregated health spending, hospital spending, nursing home spending and spending on clinical services.
To investigate whether these results extend to government health insurance programs, I will also examine the effects of JSL reform on Medicaid and Medicare expenditure growth rates. However, interpreting the impacts on Medicare and Medicaid spending growth may be complicated due to the programs' insulation from market forces.
Table 5 presents estimates where the dependent variables are limited to Medicare expenditure growth rates. These results are rather similar to the results presented in Table 4. Again, any type of JSL reform results in lower rates of aggregate spending growth per enrollee. Additionally, fair share reforms are again associated with an approximately 1 percentage point decrease in spending growth. However, there are two cases worth particular mention. The blameless plaintiff reform is associated with a nearly 9 percentage point decrease in the growth in home health care spending and the reform limiting JL to defendants bearing more liability than the plaintiff is associated with a nearly 3 percentage point increase in home health care spending growth.
Implementing a ban on JL is associated with a 2.2 percentage point decrease in aggregate spending growth and a nearly 8 percentage point decrease in home health care spending growth. Given the difference between the effects of JSL reforms on Medicare enrollee spending growth on home health care and the effects of JSL reforms on per capita spending growth on home health care, additional consideration is necessary to fully understand the economic mechanisms at work. The different results may be a result of the fact that Medicare patients are largely elderly patients or different incentives between private medical arrangements and Medicare surrounding home health care.
Table 6 displays the regression coefficients of JSL reforms on various forms of Medicaid expenditure growth. Unlike Medicare expenditure growth in Table 5, there are few cases where JSL reforms have economically and statistically significant effects. Any JSL reform, JL bans, in concert reforms, reforms where the defendant must bear at least 50% responsibility, and the synthetic variable grouping the 50% reform and reforms where the defendant is more liable than the plaintiff reform have no statistically significant impacts on any form of spending growth.
On the contrary, the intentional tort reform and blameless plaintiff reform alone are associated with large decreases in the growth rate. The intentional tort reform is associated with a 2.7 percentage point decrease in aggregated spending growth and a nearly 11 percentage point decrease in the growth rate of spending on physician services. Furthermore, the blameless plaintiff reform alone had large and statistically significant impacts on aggregated spending, hospital spending, nursing home spending and spending on clinical services. Oddly, however, the blameless plaintiff reform is also associated with a nearly 14 percentage point increase in the growth rate of spending on home health care. The reason for this result is unclear; however, it may be related to the specific nature of the Medicaid program. Further research should investigate patterns of home health care use in Medicaid programs.
At this point, it is appropriate to note that Medicaid is a state-run program and state-level changes to the administration of Medicaid are not accounted for in this analysis. Therefore, the large, and sometimes anomalous, effects of JSL reform on Medicaid spending growth rates may be related to some third factor that is associated with the states that pass restrictions on JL and state control of the structure of Medicaid. Failing to control for this possibility might be biasing these estimates upward.
4. Discussion: different states, different reforms?
There could be something different about the states that implement different types of JSL reform laws. It seems possible that states with lower levels of expenditure growth could be more likely to enact fair share liability reforms and states with higher levels take a more drastic reform, such as banning JL outright. In this case, the effects of fair share reforms may not be economically significant, rather an artifact of states with preexisting lower growth rates.
To evaluate this possibility, I created three lead variables for each of the types of reforms.Footnote 3 Table 7 presents the estimates for the first three leads for aggregated personal spending growth. Generally, instead of seeing a statistically significant decrease in spending growth before the implementation of a JSL reform, there were frequently large increases in personal spending growth. This indicates the results above are not capturing an already existing bend in the personal cost curve. The exception to this pattern is the 1-year lead of the acts in concert reform is associated with a 1.2 percentage point decrease in aggregated personal spending growth.
Table 7. Leads for aggregate per capita expenditure growth

aDependent variable is percentage growth rate in aggregate per capita health care expenditures. Standard errors, in parentheses are corrected by clustering at the state level.
bControls for changes in the bad health index, uninsurance rate, community hospital beds per capita, proportion of the state that is African American, female and over 65 and changes in real income.
*0.1 significance, **0.05 significance, ***0.01 significance.
Tables 8 and 9 present the results of similar tests for the impact of the leads to JSL reforms to the expenditure growth of Medicare and Medicaid, respectively. For Medicare spending growth, we see negative and statistically significant effects of many different reforms, suggesting an additional causal variable that may be biasing the results in Section 2. Furthermore, the leads in the regressions for Medicaid spending growth per enrollee are almost never associated with statistically significant effects, positive or negative. One exception, the 3-year lead of banning JL, is associated with a nearly 6 percentage point decrease in aggregated per enrollee Medicaid spending growth.
Table 8. Leads for aggregate per enrollee Medicare spending

aDependent variable is percentage growth rate in aggregate per Medicare enrollee health care expenditures. Standard errors, in parentheses, are corrected by clustering at the state level.
bControls for changes in the bad health index, uninsurance rate, community hospital beds per capita, proportion of the state that is African American, female and over 65 and changes in real income.
*0.1 significance, **0.05 significance, ***0.01 significance.
Table 9. Leads for aggregate per enrollee Medicaid spending

aDependent variable is percentage growth rate in aggregate per Medicaid enrollee health care expenditures. Standard errors, in parentheses, are corrected by clustering at the state level.
bControls for changes in the bad health index, uninsurance rate, community hospital beds per capita, proportion of the state that is African American, female and over 65 and changes in real income.
*0.1 significance, **0.05 significance, ***0.01 significance.
5. Placebo tests
Finally, the above analyses require an assumption about the distribution from which the regression coefficients are drawn. However, several researchers have used randomization tests to generate a ‘true’ distribution of the coefficients for inference. Following the study of Helland and Tabarrok (Reference Helland and Tabarrok2004) and Donohue and Wolfers (Reference Donohue and Wolfers2006), I randomly match state-level reforms to state levels of growth in health care expenditures. Then, I repeatedly estimate the econometric specification from above to generate the distribution of coefficients. By using the standard errors from this distribution, I can again calculate the t-statistics to reevaluate statistical significance.
The first set of placebo regressions was for the growth rate of aggregated personal health care expenditures.Footnote 4 JSL reforms were randomly matched to state health care expenditure growth rates 1000 times to generate placebo standard errors. These standard errors were then used to compute new t-statistics and assign statistical significance. The placebo tests supported the results presented in Section 3. For individual health care spending growth, every coefficient that was statistically significant in Section 3 was also statistically significant in the placebo tests. Moreover, the placebo tests generate statistically significant t-statistics for JL bans, acts in concert and 50% reforms. This suggests the standard errors from Section 3 were generally too large.
The analysis was also run for Medicare and Medicaid per enrollee spending. The placebo tests generally confirm the results from Section 3. The Medicare placebo tests find statistical significance for every coefficient that was significant in Section 3. The Medicaid placebo tests were less clear-cut. The placebo test confirms the statistical significance of the intentional acts reform but fails to confirm the statistical significance of the blameless plaintiff reform. Additionally, the placebo test generates a statistically significant t-statistic associated with the variable indicated a state had enacted any type of JSL reform.
6. Conclusion
This paper investigated whether different types of JSL tort reforms were associated with decreased rates of health care spending growth. Previous authors (Viscusi and Born, Reference Viscusi and Born2005; Avraham, Reference Avraham2007; Sloan and Shadle, Reference Sloan and Shadle2009; Avraham and Schanzenbach, Reference Avraham and Schanzenbach2010; Avraham et al., 2010) made the inference that decreasing malpractice payments and lower health insurance premiums were indicative of lower health care expenditures. My analysis shows that when all JSL reforms were combined into a single variable, there were significant negative effects on health care expenditures. However, this analysis also demonstrates that different types of liability reforms have different effects on health care expenditure growth. The JSL reforms based on the proportionality of liability have very meaningful and negative effects on the growth rate of physician and clinical service costs and the growth rate of hospital costs. Therefore, decreasing expenditure growth rates for clinical services and hospital services is likely to have a meaningful impact for consumers.
This paper demonstrates a causal relationship between ‘fair share’ reforms and slower growth in health care costs. ‘Fair share’ types of reforms seem to have significant effects across most forms of expenditure growth rates, whereas JSL bans, intentional acts and acts in concert reforms seem to rarely affect growth rates. Additionally, the effects of ‘fair share’ reforms were generally robust to placebo tests.
Although there is evidence in this analysis that Medicaid spending growth can be decreased by implementing JSL reforms, the evidence is less robust. This may be a result of any number of factors biasing the estimates. Specifically, it is important to note that Medicaid is a state-run program and state reforms may have occurred simultaneously with JSL reforms in a manner such that the effects of JSL reforms could no longer be identified. Additional analyses demonstrated the complexity of interpreting the effects of different JSL reforms on Medicaid spending.
Additionally, it is possible the changes in disaggregated categories of medical spending may not represent actual decreases in the medical spending growth but shifts among the categories of spending. This seems unlikely for total personal medical spending growth, as any types of spending growth were negatively affected by JSL reforms. However, this subject is much less clear for disaggregated categories of Medicaid spending growth. In some instances, the effect of JSL reform on personal, Medicare and Medicaid spending growth were positive and in some instances, the effect of JSL reform was negative. This could imply shifts between categories of spending, such as away from nursing home spending and toward home health care spending. Furthermore, shifts in spending could be a result of an unobserved third factor.
Further research should investigate why JSL reforms seem to have different effects across per capita spending and government spending growth rates and different effects across different types of spending. This study suggests government health care spending growth must be addressed through policies other than JSL reforms. Additionally, explaining why some segments of medical spending growth is affected by tort reform and some are not may offer important insights into the mechanisms of health care spending and health care charges.
Acknowledgements
Donna Ginther, David Slusky, Tami Gurley-Calvez, John Hoag and Mary Ellen Benedict provided comments on an earlier draft of the study. All errors and conclusions are, of course, the responsibility of the author.
Appendix
Table A1. Literature summary

Table A2. States with JSL reforms

Table A3. Placebo regressions, aggregate per capita spending growth

Table A4. Placebo regressions, aggregate spending per enrollee Medicare growth

Table A5. Placebo regressions, aggregate per enrollee Medicaid spending growth


