Introduction
Anorexia nervosa (AN) is a chronic disorder with severe medical and psychological consequences (Becker et al. Reference Becker, Grinspoon, Klibanski and Herzog1999; Garvin & Striegel-Moore, Reference Garvin, Striegel-Moore, Striegel-Moore and Smolak2001). AN has the highest mortality rate of any psychiatric disorder (Sullivan, Reference Sullivan1995; Keel et al. Reference Keel, Dorer, Eddy, Franko, Charatan and Herzog2003) and is associated with numerous psychological problems, including depression, anxiety and suicide (Birmingham et al. Reference Birmingham, Su, Hylinsky, Goldner and Gao2005; Berkman et al. Reference Berkman, Lohr and Bulik2007). Yet many questions about the etiology of AN remain unanswered (Stice, Reference Stice, Striegel-Moore and Smolak2001; Chavez & Insel, Reference Chavez and Insel2007).
In the past two decades, investigators have highlighted the influence of genetic factors on eating disorders (see Bulik, Reference Bulik2005; Mazzeo et al. Reference Mazzeo, Slof-Op't Landt, van Furth, Bulik, Wonderlich, Mitchell, de Zwaan and Steiger2006 for reviews). However, examination of genetic and environmental contributions to AN has proven challenging because of the relative rarity of the disorder, with prevalence estimates among women in the USA and Western Europe of approximately 1% (Hoek & van Hoeken, Reference Hoek and van Hoeken2003; Hudson et al. Reference Hudson, Hiripi, Pope and Kessler2007). In the only twin study to date to examine the heritability of the narrowly defined DSM-IV AN diagnosis, Bulik et al. (Reference Bulik, Sullivan, Tozzi, Furberg, Lichtenstein and Pedersen2006) obtained a heritability estimate of 0.56 [95% confidence interval (CI) 0.00–0.87]. The same study found that unshared environment accounted for about one-third of the variance in AN, suggesting that unshared environment significantly influences AN symptomatology. Similarly, studies of broadly defined AN have supported the role of genetic factors in the etiology of this pernicious disorder (Wade et al. Reference Wade, Bulik, Neale and Kendler2000; Klump et al. Reference Klump, Miller, Keel, McGue and Iacono2001; Kortegaard et al. Reference Kortegaard, Hoerder, Joergensen, Gilberg and Kyvik2001).
Heritability of specific AN symptoms
Although these diagnostic-level findings are meaningful and provide direction for future studies, researchers have recently emphasized the importance of assessing eating disorders at the symptom level. As Striegel-Moore & Bulik (Reference Striegel-Moore and Bulik2007) noted: ‘A DSM-IV diagnostic category … might actually represent an occasionally co-occurring yet etiologically diverse mixture of genetically and environmentally influenced symptoms’ (p. 191). Thus, it is important to assess eating disorders at the symptom level to facilitate the refinement of phenotypes. Such refinement could ultimately lead to improvements in treatment and targeted prevention by clarifying sources of variation for specific components of eating disorder symptomatology (Bulik, Reference Bulik2005).
The purpose of the current study was to assess genetic and environmental influences on AN in a large population-based female twin sample at both the diagnostic and symptom level. Analyses were conducted using a marginal maximum likelihood (MML) approach to modeling genetic and environmental effects. This approach overcomes many problems associated with summing items assessing symptoms of an overall diagnosis (or using a single item to assess a diagnosis composed of multiple symptoms). Specifically, as Neale et al. (Reference Neale, Lubke, Aggen and Dolan2005) noted, individual items are rarely pure indicators of a latent trait or diagnosis (in this case, AN). Thus, sum scores contaminate the measure of the latent trait with item-specific variance components. For example, the latent trait might have no heritable variation, but if residual symptom variance is heritable then sum scores would also prove heritable. The MML approach makes multivariate analysis of all symptoms practical. In essence, it combines elements of both factor analysis, which enables assessment of the latent trait or diagnosis, and item response theory (IRT), which allows for examination of how ‘difficult’ it is to meet a specific diagnostic criteria (or, in this case, endorse a specific item). This information also provides an indication of how individual items contribute differentially to a diagnosis. Thus, the joint analysis of symptom-level data is much more informative than the sum score approach, in which items of differing quality contribute equally to an overall composite (Neale et al. Reference Neale, Lubke, Aggen and Dolan2005).
Given the paucity of previous research on the heritability of specific symptoms of AN, no specific a priori hypotheses were proposed. However, the following paragraphs briefly review what is known about the heritability of several specific symptoms of AN, based on studies of broadly defined eating disorders. These studies have examined the relative contributions of three components of variance to specific eating disorder symptoms: additive genetic (A), shared environment (C), and unshared or specific environment (E).
Weight concerns/undue influence of appearance on self-evaluation
A few recent studies have identified differences in the contributions of genetic and environmental factors to specific AN symptoms (Wade et al. Reference Wade, Martin and Tiggemann1998; Reichborn-Kjennerud et al. Reference Reichborn-Kjennerud, Bulik, Kendler, Roysamb, Tambs, Torgersen and Harris2004; Wade & Bulik, Reference Wade and Bulik2007). Reichborn-Kjennerud et al. (Reference Reichborn-Kjennerud, Bulik, Kendler, Roysamb, Tambs, Torgersen and Harris2004) found that the undue influence of weight on self-evaluation was accounted for by shared and unshared environmental factors; genetic factors did not contribute significantly to the variance of this symptom among either men or women. Wade and colleagues reported similar results in two studies (Wade et al. Reference Wade, Martin and Tiggemann1998; Wade & Bulik, Reference Wade and Bulik2007). Specifically, Wade et al. (Reference Wade, Martin and Tiggemann1998) found that Eating Disorder Examination (EDE) Weight Concern scale scores (which also assess the undue influence of body weight on self-concept) were best accounted for by a combination of shared and unshared environmental factors. More recently, Wade & Bulik (Reference Wade and Bulik2007) found that additive genetic effects had a small but significant contribution to variance in the undue influence of body weight or shape on self-evaluation. However, non-shared environmental factors accounted for the majority of the variance in the undue influence of weight and shape concerns.
By contrast, a study using the Eating Disorder Inventory (EDI) examined the related, yet distinct, constructs of Body Dissatisfaction (BD) and Drive for Thinness (DFT) (Keski-Rahkonen et al. Reference Keski-Rahkonen, Bulik, Neale, Rose, Rissanen and Kaprio2005a), yielding evidence for relatively high heritability of DFT and BD among female twins (i.e. aDFT2=0.51, 95% CI 43.7–57.5; aBD2=0.59, 95% CI 53.2–64.7). Similar results regarding BD and DFT were obtained in two earlier studies (Rutherford et al. Reference Rutherford, McGuffin, Katz and Murray1993; Klump et al. Reference Klump, McGue and Iacono2000). In all of these studies, shared environmental factors did not contribute significantly to the variance of BD and/or DFT. These findings appear contradictory to those of Reichborn-Kjennerud et al. (Reference Reichborn-Kjennerud, Bulik, Kendler, Roysamb, Tambs, Torgersen and Harris2004), Wade et al. (Reference Wade, Martin and Tiggemann1998) and Wade & Bulik (Reference Wade and Bulik2007). However, these constructs (i.e. weight concerns, undue influence, BD and DFT) are related, yet distinct from one another. As noted by Bulik et al. (Reference Bulik, Hebebrand, Keski-Rahkonen, Klump, Reichborn-Kjennerud, Mazzeo and Wade2007) : ‘undue influence of weight on self-evaluation is sometimes confused with body dissatisfaction (Cooper & Fairburn, Reference Cooper and Fairburn1993). However, “undue influence … ” has a specific meaning solely relating to the degree that self-evaluation is influenced by weight or shape relative to other factors in the person's life (e.g. work, specific skills, relationships)’ (p. S55).
Measurement differences across these studies are important to consider. For example, Reichborn-Kjennerud et al. (Reference Reichborn-Kjennerud, Bulik, Kendler, Roysamb, Tambs, Torgersen and Harris2004) used a single-item self-report question: ‘Is it important for your self-evaluation that you keep a certain weight?’ This item was assessed at an ordinal level and subsequently transformed into a binary item, which results in a loss of information. By contrast, Wade & Bulik (Reference Wade and Bulik2007) used the Eating Disorders Examination, summed items assessing the undue influence of weight and shape concern, and used their mean in analyses. Keski-Rahkonen et al. (Reference Keski-Rahkonen, Bulik, Neale, Rose, Rissanen and Kaprio2005a), as noted above, used the EDI DFT and BD subscales, which assess slightly different facets of the influence of weight on self-evaluation. These differences highlight the importance of construct validity issues, as measurement error can influence estimates of genetic and environmental variance.
Low body mass index (BMI)
BMI is a highly heritable trait (Maes et al. Reference Maes, Neale and Eaves1997) that appears to be influenced by numerous different genes (Rankinen et al. Reference Rankinen, Zuberi, Chagnon, Weisnagel, Argyropoulos, Walts, Perusse and Bouchard2006). However, relatively little is known about genetic influences on low BMI and whether available data about the biology of low BMI are relevant to AN (Bulik et al. Reference Bulik, Hebebrand, Keski-Rahkonen, Klump, Reichborn-Kjennerud, Mazzeo and Wade2007). One study of Finnish twins (Keski-Rahkonen et al. Reference Keski-Rahkonen, Bulik, Neale, Rose, Rissanen and Kaprio2005b) found that, among women, intentional weight loss (⩾5 kg) was strongly influenced by genetic factors (heritability=66%, 95% CI 55–75%). Moreover, the genetic covariance of intentional weight loss and BMI among women in the study was 0.45, suggesting that the majority of genetic factors affecting BMI differ from those affecting intentional weight loss. However, this study (as well as others that have examined the heritability of BMI, e.g. Maes et al. Reference Maes, Neale and Eaves1997) did not specifically focus on individuals who were at a low weight. It is possible that genetic and environmental influences operate differently within the subset of the population that already has a low BMI. Thus, the characteristics of a particular sample or subsample are important to consider in studies of heritability.
Amenorrhea
Genetic epidemiological studies have not examined the heritability of amenorrhea (Bulik et al. Reference Bulik, Hebebrand, Keski-Rahkonen, Klump, Reichborn-Kjennerud, Mazzeo and Wade2007). Nonetheless, it is noted here because it has long been a controversial component of the AN diagnosis (Garfinkel et al. Reference Garfinkel, Lin, Goering, Spegg, Goldbloom, Kennedy, Kaplan and Woodside1996; Cachelin & Maher, Reference Cachelin and Maher1998). Furthermore, amenorrhea is not limited to any specific eating disorder subtype (Pinheiro et al. Reference Pinheiro, Thornton, Plotnocov, Tozzi, Klump, Berrettini, Brandt, Crawford, Crow, Fichter, Goldman, Halmi, Johnson, Kaplan, Keel, LaVia, Mitchell, Rotondo, Strober, Treasure, Woodside, Kaye and Bulik2007). Thus, these authors recommend reconsidering amenorrhea as a diagnostic criterion and propose that it be considered an associated feature of all eating disorders in women.
Summary and purpose
Although the relevance of genetic factors to eating disorders is becoming increasingly recognized (Bulik, Reference Bulik2005), many questions remain about the influence of environmental and genetic factors on both the overall diagnosis of AN and its specific symptoms. Use of methodology such as MML could facilitate identification of promising endophenotypes or liability indices, which, in turn, could promote the refinement of diagnostic criteria to reflect underlying biological mechanisms more closely (Bulik et al. Reference Bulik, Hebebrand, Keski-Rahkonen, Klump, Reichborn-Kjennerud, Mazzeo and Wade2007). The current study represents an early step in this line of research by examining the heritability of the AN diagnosis and its component symptoms in a population-based twin sample.
Method
Sample
Participants were from the Norwegian Institute of Public Health Twin Panel (NIPHTP). Twins in the NIPHTP are identified through the Norwegian Medical Birth Registry, which receives mandatory notification of all births. The NIPHTP is described in detail elsewhere (Harris et al. Reference Harris, Magnus and Tambs2002, Reference Harris, Magnus and Tambs2006; Kendler et al. Reference Kendler, Aggen, Tambs and Reichborn-Kjennerud2006). Data for the present study came from an interview study of Axis I and Axis II psychiatric disorders, which began in 1999. A description of the sample is available in Kendler et al. (Reference Kendler, Aggen, Tambs and Reichborn-Kjennerud2006).
Zygosity was initially based on questionnaire methodology using discriminant analyses. These classifications were recently updated using results from a subset of twins for whom zygosity was established from genetic marker analyses and that indicated 97.5% correct original classification (Harris et al. Reference Harris, Magnus and Tambs2006). From these data, we estimated that in our entire interview sample, zygosity misclassification rates are below 1%, a rate unlikely to substantially bias results (Neale, Reference Neale2003).
Our final sample consisted of 1430 females: monozygotic (MZ; 448 complete pairs and four singletons) and dizygotic (DZ; 263 complete pairs and four singletons) twins. Ages of participants ranged from 19.0 to 36.0 years (mean=28.19, s.d.=3.89). Only women were included in the current study because of the extremely low prevalence rates of AN among men (APA, 1994).
Measures
Data for the present study came from the Norwegian version of the computerized Composite International Diagnostic Interview (CIDI; Wittchen & Pfister, Reference Wittchen and Pfister1997), a comprehensive structured diagnostic interview for the assessment of DSM-IV Axis I disorders (APA, 1994) and ICD-10 diagnoses. A total of 44% of eligible twins participated in the CIDI. Interviews were conducted between June 1999 and May 2004. Interviewers were predominantly psychology students in the final part of their studies (equivalent to US students in the final 2 years of a clinical psychology doctoral program) as well as experienced psychiatric nurses. They were trained in a standardized program by teachers certified by the World Health Organization (WHO) and were supervised closely. Interviews were largely conducted face to face; for practical reasons, 231 interviews (8.3%) were conducted by telephone. Each twin in a pair was interviewed by different interviewers.
The CIDI was developed by the WHO and the former United States Alcohol, Drug Abuse and Mental Health Administration, and has been shown to have good test–retest and inter-rater reliability (Wittchen, Reference Wittchen1994; Wittchen et al. Reference Wittchen, Lachner, Wunderlich and Pfister1998). Both the paper-and-pencil version of the CIDI and the computerized version identical to the one used in this investigation have been used in Norway (Kringlen et al. Reference Kringlen, Torgersen and Cramer2001; Landheim et al. Reference Landheim, Bakken and Vaglum2003).
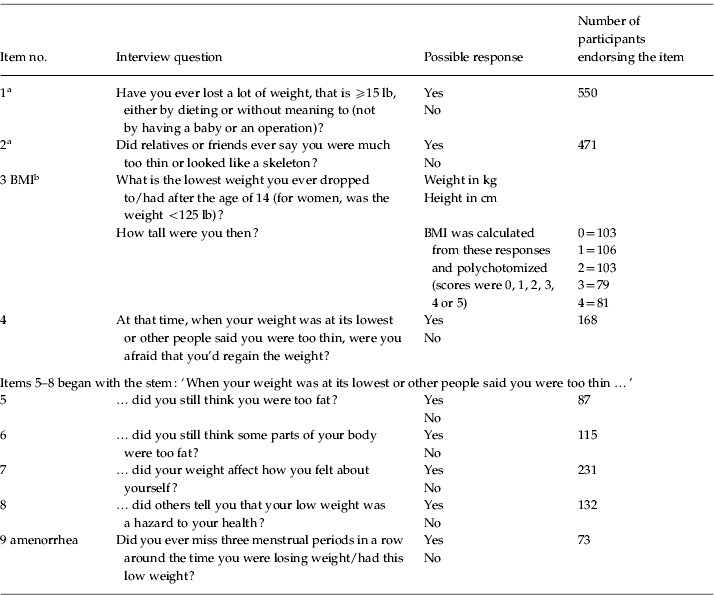
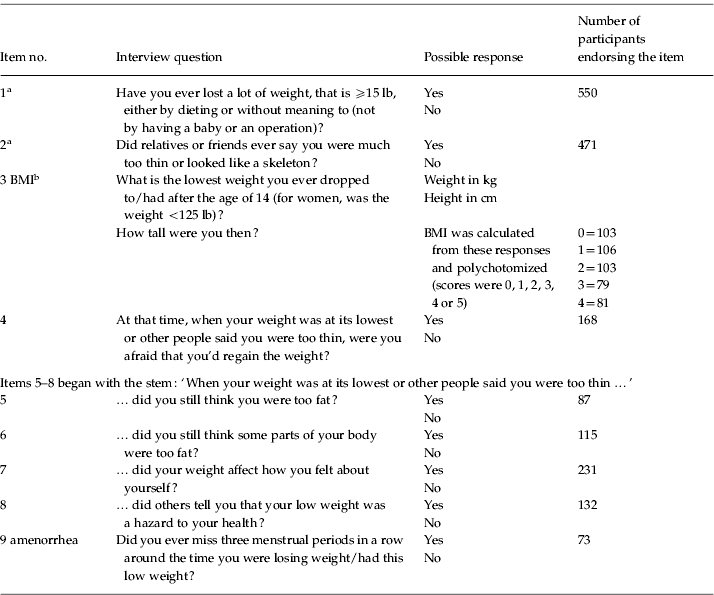
In the current study, eating disorder items were used as observed variables for the latent factor AN. These items were based on responses to interview questions (see Table 1). Participants were first asked if they had ever lost a lot of weight (⩾15 lb) either by dieting or without meaning to (item 1). Second, they were asked if friends or relatives had ever said that they were much too thin or ‘looked like a skeleton’ (item 2). A total of 550 participants endorsed item 1, and 471 endorsed item 2; in total, 765 participants endorsed at least one of these items. If participants endorsed neither, they skipped to the next section of the interview, and their data were coded as missing for the subsequent eating disorder questions. Third, participants were asked the lowest weight they dropped to (or had) after the age of 14 and their height at that time (item 3). If their reported lowest weight was not less than 125 lb, they skipped to the next section of the interview. A total of 663 participants reported a weight of less than 125 lb.
Table 1. Item numbers, corresponding interview questions, and scoring
BMI, Body mass index.
a If participants endorsed neither item 1 nor item 2, they skipped to the next section of the interview.
b If participants endorsed either item 1 or 2 but did not report a low weight <125 lb, they skipped to the next section of the interview.
Participants who endorsed at least one of the first two items as well as the low weight criterion were subsequently asked questions regarding their fears about regaining weight (at the time of low weight; item 4), whether they considered themselves (item 5) or parts of their bodies (item 6) fat at this time, whether weight impacted their self-evaluation (item 7), whether others told them that their low weight was a hazard to their health (item 8) and whether they missed menstrual periods during this time (i.e. amenorrhea; item 9). The number of participants responding to these questions ranged from 541 to 546. Scores on these items, except for weight and height, were binary (yes/no).
BMI was calculated based on responses to the question regarding lowest weight since age of 14 and height at that time (item 3). This variable was then divided into quintiles for multivariate ordinal data analysis; 67.4% of participants who reported a period of time when they had lost a lot of weight (item 1) and looked too thin (item 2) reported lowest BMIs less than 18.5, meeting the criteria for underweight (WHO, www.who.int/bmi/index.jsp?introPage=intro_3.html). A score of 0 on the polychotomized BMI variable indicated a BMI ⩽16.65. Scores of 1, 2, 3 or 4 indicated a BMI in the range 16.73–17.58, 17.63–18.49 and 18.59–19.49 and ⩾19.53 respectively.
Analyses
In the current study, we were interested in the extent to which the observed variables (i.e. eating disorder items) were related to the latent trait AN (indicated by item factor loadings) as well as the genetic influences on the latent trait and individual items. Similar to IRT, an item's factor loading represents its discrimination, or the likelihood of a symptomatic or non-symptomatic response. Thus, an item-factor approach (Neale et al. Reference Neale, Aggen, Maes, Kubarych and Schmitt2006a) was used for the analyses. This procedure can be considered an implementation of the common factor model to multivariate binary or ordinal data, such that the likelihood of item data is computed conditional on the latent trait. We used an MML approach in which the overall likelihood is computed by integrating over the latent trait, which is achieved by specifying a finite mixture distribution for points on the latent trait. Gaussian quadrature weights are assigned to these points along the distribution of the factor; these weighted likelihoods are summed to compute the overall likelihood. Of note, use of at least 10 points provides a good approximation of normality (Neale et al. Reference Neale, Aggen, Maes, Kubarych and Schmitt2006a).
Because of the skip patterns in the interviews, there were a considerable number of data missing. Moreover, selection on these ‘gateway’ items impacts the estimation of covariation among the items, which is essential for fitting the factor model. Specifically, there will be no variance on the gateway items when data on the probe items are available because individuals must endorse the gateway items in order to be asked the probe items. Ultimately, this zero variance problem can affect the validity of factor analyses (Neale et al. Reference Neale, Aggen, Maes, Kubarych and Schmitt2006a). However, joint analysis of gateway and probe items collected from pairs of twins overcomes this problem because the covariance between the gateway item and the co-twin's probe items is available (Neale et al. Reference Neale, Aggen, Maes, Kubarych and Schmitt2006b).
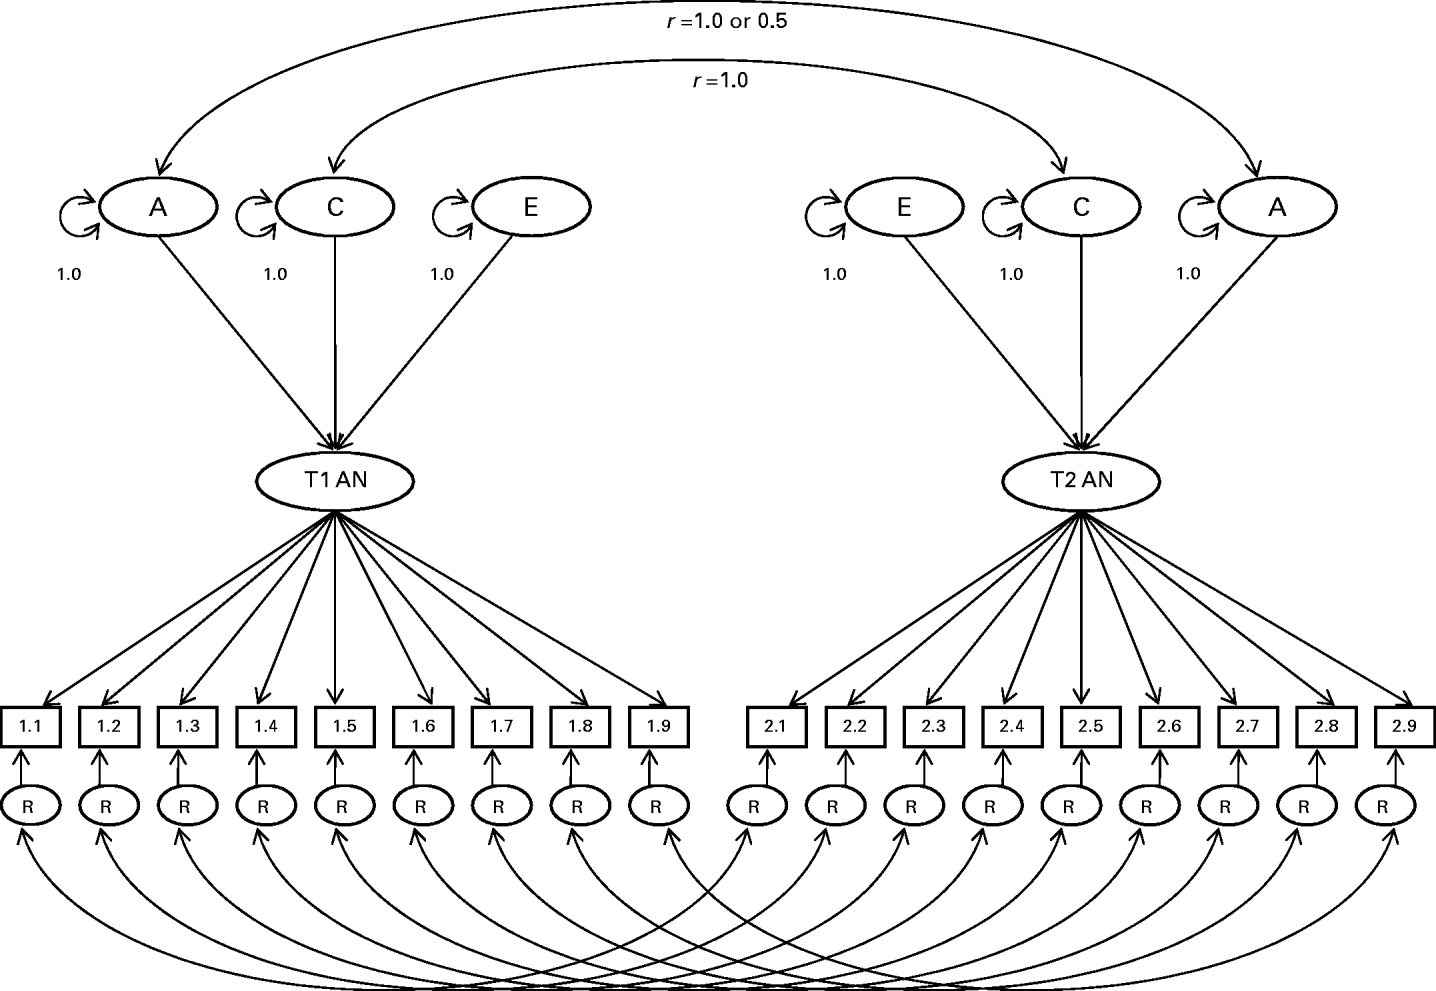
The model used estimates three main types of parameters. First are the thresholds, which reflect the probabilities that the AN symptoms are endorsed. In the case of BMI, the thresholds subdivide BMI into its categories. Second are the factor loadings, which estimate association between the latent trait and each of the symptoms. Third are the additive genetic (A), shared environment (C), and specific or individual environment (E) influences on the latent factor. Of note, additive genetic effects are specified to contribute twice as much to the covariance between MZ twins as DZ twins because, for most intents and purposes, MZ twins share all of their genes, and DZ twins share half of their genes. Shared environmental influences are assumed to be equal among MZ and DZ twins. Specific environmental influences are assumed to be uncorrelated in MZ and DZ twin pairs. Fourth, two types of variance are estimated for each item: that contributed by the latent factor and residual variance. In this model, residual variance for each item (R in Fig. 1) was partitioned into A, C and E influences.
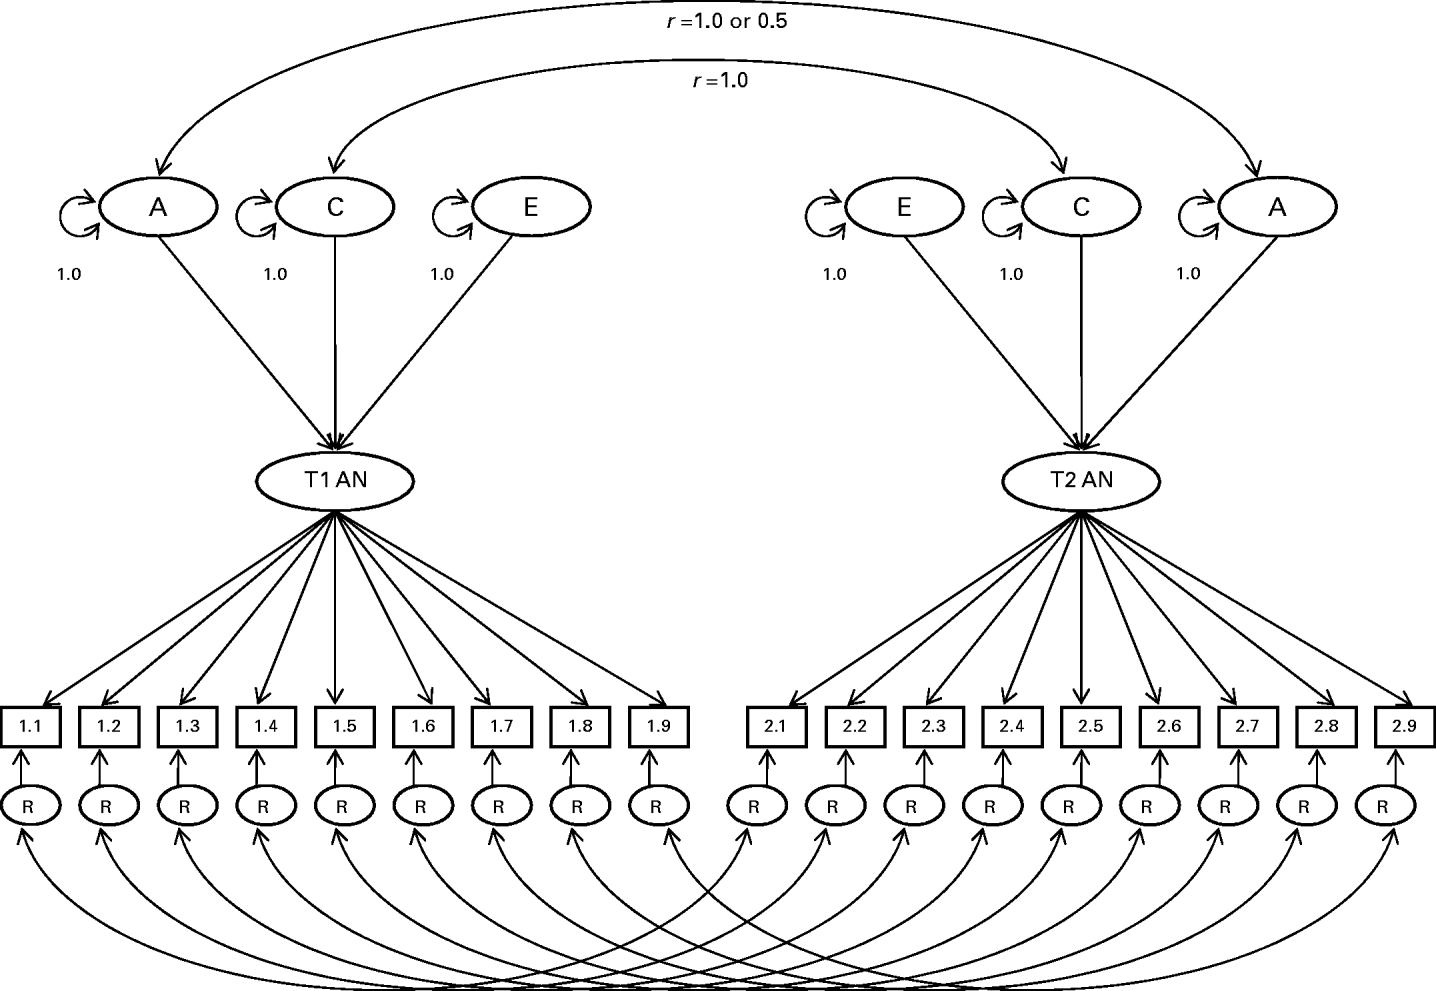
Fig. 1. Item-factor model of anorexia nervosa (AN). Variance of the latent AN trait for each twin is decomposed into additive genetic (A), common environmental (C), and specific environmental (E) influences. Residual variances (R) of AN symptoms are further decomposed into A, C and E influences. Genetic variance components are correlated at 1.0 for monozygotic (MZ) twins and 0.5 for dizygotic (DZ) twins; common environmental components are correlated at 1.0 for all twin pairs.
Lastly, the significance of the A and C contributions to the latent factor was tested using submodel comparisons (with the full ACE model compared to AE and CE models) as well as the computation of CIs. Parameters for A and C were constrained in two separate submodels; each of these nested models was compared to the full model using a likelihood ratio test (Δχ2). A significant χ2 difference indicates that model fit worsens when parameters are fixed to zero. This procedure is used to determine whether genetic and environmental influences contribute significantly to the latent construct AN. Additionally, the Akaike's Information Criterion (AIC) for the models, computed as – 2lnL−2df (Akaike, Reference Akaike1987) was examined. However, this index was not exclusively used to determine which model provided the best fit, as it may sometimes yield incorrect results (Sullivan & Eaves, Reference Sullivan and Eaves2002).
Results
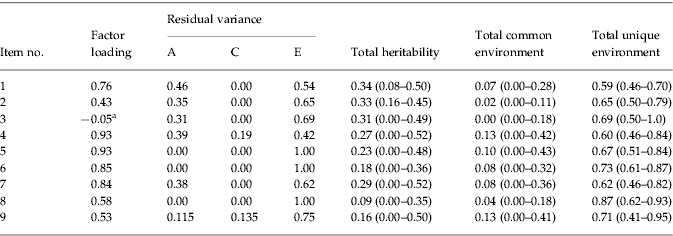
Descriptive statistics indicated that 1.9% of the sample met criteria for a lifetime diagnosis of AN. An ACE model (see Fig. 1), using an item-factor approach with MML, was first fit to the data. The estimated MZ correlation for the latent trait was 0.37, while that for DZ pairs was 0.24. This suggests that the latent trait AN is somewhat heritable. Consistent with this observation, E had the largest contribution to variance in the latent trait (e2=0.64, 95% CI 0.49–0.79), and additive genetic and common environmental influences on the latent trait AN were modest (a2=0.22, 95% CI 0–0.50; c2=0.14, 95% CI 0–0.44). The majority of items (numbers 1, 4, 5, 6 and 7) had relatively large factor loadings (range 0.76–0.93; see Table 2). Items 2, 8 and 9 had more modest factor loadings (range 0.43–58; see Table 2), indicating that relatives or friends telling participants they were too thin, others telling them that their low weight was a hazard to their health, and amenorrhea were less strongly associated with the latent trait. A somewhat surprising finding, however, was that the factor loading for BMI (item 3) was fairly low (coefficient=−0.05).
Table 2. Item factor loadings, residual variances, and heritability estimates (95% confidence intervals)
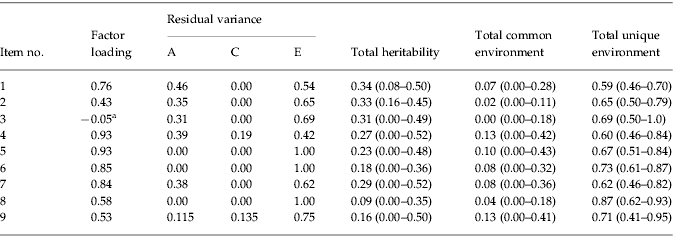
a Scores of 0, 1 or 2 on the polychotomized body mass index (BMI) variable indicate that participants met criteria for underweight (⩽18.5).
Residual variance for each item (i.e. variance that was not due to the latent trait) was partitioned into A, C and E influences. For all items, the largest amount of residual variance was due to unique environmental factors (see Table 2). However, several items (1, 2, 3, 4 and 7) had moderate proportions of residual variance due to genetic influences. For nearly all items, the amount of residual variance due to common environmental factors was zero, with the exception of items 4 and 9, which had 19% and 14% of residual variance, respectively, due to C.
The total heritability for each individual item (i) was computed as the product of the item's squared factor loading (λ) and a2 for the latent trait, added to the product of one minus the item's squared factor loading and the amount of the item's residual variance due to A. So this equation, where λi is the factor loading for the ith item is as follows:
Similarly, total shared and unique environmental influences on each item were computed using this equation, respectively substituting c2 or e2 and residual variance due to C or E. Thus, four items (numbers 1, 2, 3 and 7) had estimates of heritability ranging from 0.29 to 0.34. These items assessed whether participants had ever lost a lot of weight, whether friends and relatives had said they were too thin, whether they still thought they were too fat at lowest weight, whether weight affected how they felt about themselves at lowest weight, and BMI. Items 4 and 5 (whether participants were afraid they would regain the weight at time of lowest weight and whether they still thought they were too fat) had heritabilities of 0.27 and 0.23 respectively. Lastly, items 6, 8 and 9 (whether participants still thought parts of their bodies were too fat, whether others told them their weight was a hazard to their health, and amenorrhea) had the lowest heritability estimates (0.18, 0.09 and 0.16 respectively).
Two submodels, an AE and a CE model, were compared to the full ACE model to determine whether additive genetic and common environmental factors significantly influenced the latent trait AN. Results of χ2 tests indicated that dropping A and C separately did not significantly worsen the model fit (see Table 3 for a summary of fit information for the full ACE model and each submodel). In addition, CIs for A and C included zero, further indicating that A and C individually were non-significant. However, the CI for E did not include 1.0. This indicates that unique environmental influences alone do not fully explain the etiology of AN and there is evidence for the aggregation of shared environmental influences on this latent trait, but there are insufficient data to ascertain whether their origin is genetic, environmental, or (most likely) both. Given these results and the sample size, parameters from the full ACE model are more likely to represent the true model than either submodel (Sullivan & Eaves, Reference Sullivan and Eaves2002).
Table 3. Summary of fit information for the full ACE model and AE and CE submodels

−2LL, −2 log-likelihood; df, degrees of freedom; AIC, Akaike's Information Criterion; CI, confidence interval; A, additive genetic influence on the latent trait; C, common environmental influence on the latent trait; E, unique environmental influence on the latent trait.
Discussion
This study examined the relative heritability of specific AN symptoms in a large population-based twin sample using an item-factor approach. The overall heritability of AN was moderate, and lower than that obtained in the only previous study to examine the full AN diagnosis (Bulik et al. Reference Bulik, Sullivan, Tozzi, Furberg, Lichtenstein and Pedersen2006) and also in studies using broader definitions of AN (e.g. Wade et al. Reference Wade, Bulik, Neale and Kendler2000; Klump et al. Reference Klump, Miller, Keel, McGue and Iacono2001; Kortegaard et al. Reference Kortegaard, Hoerder, Joergensen, Gilberg and Kyvik2001). However, the current estimate is within the (albeit wide) CI obtained in the Bulik et al. study. The use of sum scores in previous studies (e.g. Bulik et al. Reference Bulik, Sullivan, Tozzi, Furberg, Lichtenstein and Pedersen2006), which assessed contributions to the variance of AN at a diagnostic level, may also account for differing results. Heterogeneity of items assessing a given trait, which is not accounted for in models using sum scores, can bias parameter estimates (Neale et al. Reference Neale, Lubke, Aggen and Dolan2005).
Thus, of particular interest in this study were the symptom-level analyses using the MML method. Items assessing weight loss and weight itself were moderately heritable. Heritability estimates for items assessing weight concern at low weight were somewhat lower, clustering around 0.25. The amenorrhea item was most strongly influenced by unshared environment. This result further supports the argument that amenorrhea is not a promising endophenotype or liability index for AN, and may be of limited value to the overall diagnosis if we are seeking more biologically valid diagnostic criteria (Bulik et al. Reference Bulik, Hebebrand, Keski-Rahkonen, Klump, Reichborn-Kjennerud, Mazzeo and Wade2007; Pinheiro et al. Reference Pinheiro, Thornton, Plotnocov, Tozzi, Klump, Berrettini, Brandt, Crawford, Crow, Fichter, Goldman, Halmi, Johnson, Kaplan, Keel, LaVia, Mitchell, Rotondo, Strober, Treasure, Woodside, Kaye and Bulik2007).
Results regarding the influence of weight on self-evaluation differ from those of Reichborn-Kjennerud et al. (Reference Reichborn-Kjennerud, Bulik, Kendler, Roysamb, Tambs, Torgersen and Harris2004), who found greater support for the influence of shared and unique environmental factors on this construct. However, current results are more consistent with those of Wade & Bulik (Reference Wade and Bulik2007), who found small to moderate heritability estimates for the undue influence of weight and shape concern on self-evaluation. Perhaps some of these differences among studies are related to the varying items used to assess this construct. For example, Reichborn-Kjennerud et al. used a single item, self-report question to assess undue influence, whereas Wade & Bulik used EDE items. In the current study, participants were asked, using a single question, how they felt about themselves when their weight was at its lowest.
Furthermore, we only assessed a specific subgroup of the sample, most notably those with a low enough BMI to be considered for the AN diagnosis. Specifically, participants had to endorse the gateway items to even be asked about self-evaluation. This is a common problem in large-scale epidemiological studies, in which participant burden and fatigue must be considered. In Wade & Bulik's (Reference Wade2007) study, all participants completed the EDE. In theirs as well as Reichborn-Kjennerud et al.'s (Reference Reichborn-Kjennerud, Bulik, Kendler, Roysamb, Tambs, Torgersen and Harris2004) investigations, participants did not need a history of low weight to respond to items assessing undue influence/weight concern. These contrasting results across studies suggest that perhaps genetic and environmental factors operate differently within individuals who are already at a low BMI, compared to the general population. Moreover, it seems important to examine heritability within specific subgroups of interest, as it is possible that heritability estimates obtained at a population level differ from estimates obtained from specific subsets of individuals. Future research should address this possibility.
Current findings also highlight the importance of unshared or unique environmental factors, which contributed significantly to all AN symptoms. These results are similar to of Wade et al. (Reference Wade, Bergin, Martin, Gillespie and Fairburn2006), who found that unshared environmental factors contributed significantly to the number of lifetime eating disordered behaviors. This influence of the unshared environment may reflect individual experiences twins had outside of their family environment that affected their weight-related behaviors, such as comments made by peers, coaches or other influential people. Future research should examine the interaction of these unique environmental experiences with underlying genetic vulnerabilities. This line of work may help to identify triggering experiences among the subset of the population particularly vulnerable to AN.
Furthermore, it should be noted that, in addition to measuring unshared environmental experiences, the E component of the ACE model captures variance attributable to measurement error. Thus, the relatively higher influence of E found in the current study compared to others that have evaluated AN at the diagnostic level (e.g. Wade et al. Reference Wade, Bulik, Neale and Kendler2000; Klump et al. Reference Klump, Miller, Keel, McGue and Iacono2001; Kortegaard et al. Reference Kortegaard, Hoerder, Joergensen, Gilberg and Kyvik2001; Bulik et al. Reference Bulik, Sullivan, Tozzi, Furberg, Lichtenstein and Pedersen2006) could reflect both measurement error and non-shared environmental experiences. It is not possible to determine exactly what proportion of variance accounted for by E in this study is due either to true unshared experiences or to measurement error. Consequently, it is important for future studies to replicate the current methodology, particularly given that estimates of heritability are sample dependent. For example, previous studies have identified significant developmental differences in the influence of genetic and environmental factors on eating disorder symptoms (e.g. Klump et al. Reference Klump, McGue and Iacono2000, Reference Klump, Burt, McGue and Iacono2007; Silberg & Bulik, Reference Bulik2005). In addition, studies in other areas (e.g. smoking) have found that birth cohort influences estimates of A, C and E parameters (e.g. Kendler et al. Reference Kendler, Thornton and Pedersen2000). In sum, no single study can provide a definitive value regarding the heritability of AN that would be applicable to all. Rather, multiple studies, such as this one, that examine genetic and environmental influences on specific AN symptoms can lead to an accumulation of evidence that will facilitate identification of particularly promising targets for intervention and prevention efforts.
Several limitations of this study should be noted. First, the sample included exclusively Norwegian female twins. Thus, it is unclear whether these results are applicable to men, non-twins, or other cultural groups. Measurement issues should also be considered, particularly the issue of the gateway items. Use of gateway items is helpful in reducing participant burden and response biases due to fatigue; however, because these items, by definition, screen out the majority of the sample, heritability estimates derived from studies using gateway items assess this component of variance among those individuals who have met the screening criteria. These individuals are likely to differ from those in the total population. In addition, the use of gateway items may have led to an underestimate of the number of women affected by AN, because, as Wade (Reference Wade2007) has noted, AN symptoms are ego-syntonic, and, thus, are probably under-reported by affected individuals. Consequently, our results may not represent the full range of individuals with AN, but may include individuals with more chronic or severe cases. A final measurement limitation is that participants were classified as low weight if their BMI value was <18.5. BMI, age- and gender-specific percentiles are considered more accurate for individuals under the age of 18 (Cole et al. Reference Cole, Flegal, Nicholls and Jackson2007); consequently, the current study may have incorrectly classified some individual as underweight whose weight was in fact in the low-normal range. However, these same individuals would have had to have met all other AN criteria to be diagnosed with the disorder. Thus, it is unlikely that this decision regarding BMI cut-offs significantly influenced the overall results.
Furthermore, substantial attrition was observed in this sample from the original birth registry through three waves of contact. Detailed analyses of the predictors of non-response across waves will be presented elsewhere (Harris et al., unpublished observations), and suggest that cooperation was predicted by female sex, monozygosity, older age, and higher educational status. Few of the mental or physical health measures showed significant effects. Analyses did not show evidence of changes in the genetic and environmental covariance structure due to recruitment bias for a broad range of mental health indicators. Although we cannot be certain that our sample was representative with respect to AN psychopathology, these findings suggest that significant bias is unlikely. Finally, to increase statistical power, the measure used in the current study assessed lifetime history of AN. Thus, results may have been influenced by recall bias.
Despite these limitations, this study has several strengths, including the use of a large, population-based sample. Use of symptom level modeling also provides much richer data that can prove informative to the development of endophenotypes or liability indices (Bulik et al. Reference Bulik, Hebebrand, Keski-Rahkonen, Klump, Reichborn-Kjennerud, Mazzeo and Wade2007).
Acknowledgments
This research was supported by the National Institutes of Health Grants MH-068520 (S.E.M.), MH-20030 (K.S.M.), MH66117-05 (C.M.B., PI: Devlin), MH-65322 (M.C.N.), and MH-068643 (PI: K.S.K.). The twin program of research at the Norwegian Institute of Public Health is supported by grants from the Norwegian Research Council, the Norwegian Foundation for Health and Rehabilitation, and by the European Commission under the program ‘Quality of Life and Management of the Living Resources’ of the 5th Framework Program (no. QLG2-CT-2002-01254). Genotyping on the twins was performed at the Starr Genotyping Resource Centre at the Rockefeller University. We are very grateful to the twins for their participation.
Declaration of Interest
None.


