Many engineered barrier system designs for the deep geological disposal of radioactive waste, at depths of up to ~1000 m, include the use of bentonite clays as buffer, backfill or sealing materials (e.g. Madsen, Reference Madsen1998; Wilson et al., Reference Wilson, Savage, Bond, Watson, Pusch and Bennett2011). The intended function of the bentonite is usually to inhibit the flow of groundwater and transport of solutes and to protect metal waste containers from the effects of mechanical shearing during any seismic events. This function arises due to the natural swelling property of bentonite, which acts to seal voids as the clay re-saturates.
There is extensive natural analogue evidence to suggest that bentonite may persist under natural conditions over geologically significant periods of time, without significant loss of smectite (e.g. Savage et al., Reference Savage, Benbow, Watson, Takase, Ono, Oda and Honda2010a; Fujii et al., Reference Fujii, Yamakawa, Shikazono and Sato2015; Alexander et al., 2016; Bankole et al., Reference Bankole, El Albani, Meunier, Pambo, Paquette and Bekker2018). Along with the existence of smectite deposits that appear to be many millions of years old, these have led to the concept of bentonite deposits being ‘self-analogues’ (Reijonen & Alexander, Reference Reijonen and Alexander2015). However, it is expected that engineered bentonite barriers will undergo a degree of spatially limited geochemical alteration as they interact with in situ groundwaters (e.g. Karnland & Birgersson, Reference Karnland and Birgersson2006; Savage et al., Reference Savage, Arthur, Watson and Wilson2010b; Wilson et al., Reference Wilson, Savage, Bond, Watson, Pusch and Bennett2011). Reactive transport modelling is usually undertaken to determine whether any interactions with the natural groundwaters and water conditioned by other engineering materials (such as cement or steel) might lead to large-scale alteration to non-swelling clays (such as berthierine in the case of steel–clay interactions) or zeolites (in the case of cementitious systems), or to other alteration products that could impede the intended barrier functions of the clay (e.g. Savage et al., Reference Savage, Walker, Arthur, Rochelle, Oda and Takase2007; Wilson et al., Reference Wilson, Benbow, Watson, Sasamoto and Savage2015). The primary geochemical processes that might lead to such alterations are cation exchange and mineral dissolution and precipitation, the rates (kinetics) of which need to be incorporated in geochemical models. Cation exchange is expected to occur relatively rapidly (compared to mineral precipitation and dissolution) whenever natural groundwater solutes diffuse into the clay. This process leads to replacement of cations on clay surfaces, with exchange reactions occurring at a rate that is limited by solute transport. In contrast, clay mineral dissolution is only expected to occur over longer timescales (at least hundreds to many thousands of years) if the clay minerals are under-saturated in the porewaters. Modelling of the simultaneous coupled effects of cation exchange and mineral dissolution kinetics is therefore important in developing understanding of the long-term behaviour of clay materials and in building confidence in the engineered barrier designs.
When modelling the evolution of clay minerals, it is common to represent the mineral assemblage as a combination of solid phases from the underlying thermodynamic database (TDB). Cation exchange is usually represented in numerical models by including multiple exchanger-mineral end members to represent the alterative cation-exchange states that may occur. For example, if the exchange reaction (equation 1):
 $${\rm C}{\rm a}^{2 +} + 2 {\rm Na \hyphen Z} = 2{\rm N}{\rm a}{^ +} + {\rm Ca}\hyphen{\rm Z}_2$$
is permitted to take place in the model, where Z represents the montmorillonite exchanger site, then it will be necessary to include Na-montmorillonite and Ca-montmorillonite exchanger minerals in the simulation to represent the Na-Z and Ca-Z2 exchanger states. To represent the fact that montmorillonite may undergo dissolution (or precipitation) if the porewater conditions are conducive, each exchanger mineral must also be permitted to dissolve in the simulation. The treatment of the coupling of the dissolution process with the cation-exchange process is therefore important when attempting to construct plausible physical models.
In this paper, illustrative reactive transport models of the geochemical alteration of a montmorillonite sample are presented which demonstrate that one possible approach to fully coupling cation exchange and dissolution kinetics, referred to here as the ‘all-component coupling’ approach, may lead to unrealistic behaviour. Here, ‘fully coupling’ refers to the specification of a system of differential algebraic equations being solved simultaneously for both cation-exchange reactions involving clays and the dissolution/precipitation of those clays, where all exchangers considered in the cation exchange reaction are also represented by end members in the mineral assemblage. Illustrative numerical models of the approach show that complete dissolution of all end members of an exchanger mineral is possible when only one of the exchanger end members is under-saturated in the porewater due to low concentration of its exchanged cation. In the example, under-saturation of Ca-montmorillonite due to a low concentration of Ca2+ ions in the porewater is shown to lead to complete dissolution of Na-montmorillonite, despite Na-montmorillonite being over-saturated in the porewater. This unrealistic behaviour arises due to a feedback phenomenon that may occur in the formulation.
The unrealistic feedback can be avoided if an alternative ‘common-component’ conceptual model for dissolution of exchanger end members is adopted, where only the saturation of the exchanger ‘structural unit’ is considered when evaluating the potential for dissolution of the mineral. Such considerations have been proposed historically in stability analyses for montmorillonite (e.g. Kittrick, Reference Kittrick1971), but have not been widely explored in the modelling literature. A consequence of this choice is that the dissolution rate of each end member is independent of their interlayer cation in solution. Numerically, the proposed alteration is quite trivial, requiring little modification of existing modelling software. Thermodynamically, however, the proposed alteration is more challenging, as it requires derivation of equilibrium constants that are appropriate for the hydrolysis reaction for the clay structural unit. Preliminary calculations for suitable equilibrium constants are presented, but more work in this area would be required if the approach is to be used to build models for illustrating clay barrier functions persisting over timescales relevant for radioactive waste disposal (i.e. potentially many thousands of years and up to 1 million years).
Standard numerical formulations of coupled ion-exchange and mineral kinetics
The reactive transport equations describe the transport and interactions of solutes in a porous medium, together with their interactions with solids. Coupled effects of porosity change due to mineral dissolution and precipitation are often also incorporated. For the purposes of this paper, it is only necessary to consider the local interactions of minerals in the solid phase with solutes due to cation-exchange and mineral-dissolution processes, and so for brevity a full discussion of the reactive transport equations is omitted. Steefel (Reference Steefel, Brantley, Kubicki and White2008), for example, provides a derivation of the reactive transport equations and an overview of their applications.
If m i and m j (mol m−3) represent the abundance per unit volume of two minerals i and j in the system that is being solved, then the dissolution/precipitation of the minerals will be governed by equations of the form given in equations 2:
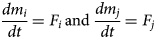 $$\displaystyle{{dm_i} \over {dt}} = F_i \,{\rm and}\, \displaystyle{{dm_j} \over {dt}} = F_j$$
Here, F i and F j (mol m−3 s−1) are the kinetically controlled rates of dissolution/precipitation of the two minerals. The minerals i and j would be identified with underlying mineral species in the TDB that is being used. It is usually the case that kinetic reaction rates are defined in models assuming transition state theory (TST), where the rate of reaction is expressed in terms of the magnitude of the porewater chemistry's departure from equilibrium between reactants and products in the mineral hydrolysis reaction. Specifically, F i is usually expressed as (equation 3):
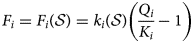 $$F_i = F_i\lpar {{\cal S}} \rpar = k_i\lpar { {\cal S}} \rpar \left( {\displaystyle{{Q_i} \over {K_i}}-1} \right)$$
and F j would be defined similarly. Here,  ${ {\cal S}}$ represents the collective state of the chemical system (i.e. the set of concentrations of all chemical species in the system and the system temperature and pressure) and also any physical constants (e.g. mineral-specific surface areas and molar weights), k i (mol m−3 s−1) is the reaction rate, which depends on this state (e.g. via a pH and/or temperature dependence), Q i (–) is the ion activity product (IAP) for mineral i and k i (–) is its equilibrium constant, which may, in general, depend on the in situ temperature and pressure. The magnitude of the departure from equilibrium is represented by the mineral saturation (equation 4):
 $$S_i = \displaystyle{{Q_i} \over {K_i}} - 1$$
with S j defined similarly. More general reaction expressions than TST may assume nonlinear dependence of the rate of reaction on S i,j, but a dependence of some form on the departure of the system from chemical equilibrium for the mineral is a common feature of most dissolution/precipitation models, where the rate is considered to be dependent on the state of the chemical system (rather than being a directly imposed dissolution rate).
If it is further assumed that minerals i and j represent end members of an exchanger mineral that can undergo cation exchange, then minerals i and j are still treated as separate solids in the model that can be identified with specific species in the underlying TDB. For example, they could represent Na-montmorillonite and Ca-montmorillonite portions of montmorillonite. However, in this case, they are related by an additional process that must be coupled to the dissolution/precipitation equations. Various approaches are taken in numerical modelling of the reactive transport equations to the problem of coupling cation exchange to mineral dissolution/precipitation kinetics. Here, we outline one possible approach, which will then be used as a basis for discussion of other common approaches.
Cation exchange is usually considered to take place rapidly, so that when compared to mineral dissolution/precipitation kinetics it is effectively instantaneous. If it is initially assumed that the cation-exchange process proceeds at a rate R ij (mol m−3 s−1) in a direction from mineral i to mineral j, then the governing equations become (equations 5):
 $$\displaystyle{{dm_i} \over {dt}} = F_i - \alpha _iR_{ij}\,{\rm and} \,\displaystyle{{dm_j} \over {dt}} = F_j + \alpha _jR_{ij}$$
Here, α i and α j are the stoichiometries of the minerals i and j in the exchange reaction written in terms of the TDB file minerals representing the exchanger sites. In TDB files, it is usually the case that minerals representing end members of the same underlying mineral have formulae that are expressed in terms of a common ‘structural unit’, in which case the stoichiometry terms α i and α j in equations 5 both have the value 1. For example, in the Geochemist's Workbench® TDB file thermo.com.v8.r6+ (Bethke, Reference Bethke2008), Na-montmorillonite and Ca-montmorillonite are represented by the idealised (half unit cell) compositions ‘Mont-Na’ and ‘Mont-Ca’, with formulae:
 $${\rm Mont} \hyphen {\rm Na}: {\rm N}{\rm a}_{0.33}{\rm M}{\rm g}_{0.33}{\rm A}{\rm l}_{1.67}{\rm S}{\rm i}_4{\rm O}_{10}\lpar {{\rm OH}} \rpar _2,$$
 $${\rm Mont} \hyphen {\rm Ca}:\,{\rm C}{\rm a}_{0.165}{\rm M}{\rm g}_{0.33}{\rm A}{\rm l}_{1.67}{\rm S}{\rm i}_4{\rm O}_{10}\lpar {{\rm OH}} \rpar _2.$$
The montmorillonite structural unit in this case is therefore Mg0.33Al1.67Si4O10(OH)2, and the exchange reaction written in terms of the TDB file minerals is:
 $$0.165\; {\rm C}{\rm a}^{2 +} + {\rm Mont \hyphen Na} = 0.33\; {\rm N}{\rm a}{^ +} + {\rm Mont \hyphen Ca},$$
so that the stoichiometry of the ‘Mont-Na’ and ‘Mont-Ca’ end members is 1 (i.e. α i = α j = 1, as noted above).
In the limit that the rate of the cation-exchange process tends to infinity (to represent the instantaneous equilibrium assumption), and assuming unit stoichiometries of the exchanger minerals in the cation-exchange equation, the governing equations may remain valid if R ij is eliminated from the system of equations 5 by adding the two rate equations to form a single equation (equation 6):
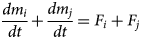 $$\displaystyle{{dm_i} \over {dt}} + \displaystyle{{dm_j} \over {dt}} = F_i + F_j$$
This derived equation is a conservation equation for the number of structural units of the underlying mineral (a proxy for the number of cation-exchange sites), which is unaltered by cation exchange, but does vary with dissolution/precipitation of the exchanger end members.
As the two original governing equations have been reduced to a single conservation equation, the system of equations must be supplemented by an additional equation to fully specify the two unknowns m i and m j.
If the cation exchange reaction is written as equation 7:
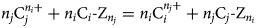 $$n_j{\rm C}_j^{n_i +} + n_i{\rm C}_i \hyphen Z_{\it n_j} = {\it n}_{\it i}{\rm C}_{\it i}^{\it n_j +} + {\it n}_{\it j}{\rm C}_{\it j} \hyphen Z_{\it n_i}$$
where Z denotes a charge equivalent on the exchanger arising from isomorphous substitutions in the crystal lattice, then the thermodynamic equilibrium constant for the cation-exchange reaction is defined to be equation 8:
 $$K_{IE} = \displaystyle{{{\lsqb {{\rm C}_i^{n_j +}} \rsqb }^{n_i}} \over {{\lsqb {{\rm C}_j^{\it n_i +}} \rsqb }^{n_j}}}\displaystyle{{{\lsqb {{\rm C}_j \hyphen Z_{\it n_i}} \rsqb }^{n_j}} \over {{\lsqb {{\rm C}_i \hyphen Z_{\it n_j}} \rsqb }^{n_i}}}$$
Here, [·] denotes activity of the exchanger or aqueous species. The activity product on the right-hand side of equation 8 is denoted Q IE. The activity of the exchanger is usually expressed either as charge (or structural unit) fractions (Gaines–Thomas convention) or as mole fractions (Vanselow convention), but other formulations are also possible (e.g. Vulava et al., Reference Vulava, Kretschmar and Rusch2000; Appelo & Postma, Reference Appelo and Postma2005). Equilibrium constants K IE for most exchange reactions of interest are available in the literature. The algebraic equation 8 provides the necessary supplemental equation to equation 6 to completely specify the system for the two unknowns m i and m j.
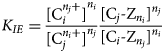
For example, the cation-exchange reaction between Na-montmorillonite and Ca-montmorillonite would have Ci = Na, Cj = Ca, n i = 2 and n j = 1, so that (equation 9):
 $${\rm C}{\rm a}^{2 +} + 2\; {\rm Na \hyphen Z} = 2{\rm N}{\rm a}{^ +} + {\rm Ca} \hyphen {\rm Z}_2$$
and at equilibrium (equation 10):
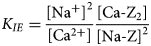 $$K_{IE} = \displaystyle{{{\lsqb {{\rm N}{\rm a}^ +} \rsqb }^2} \over {\lsqb {{\rm C}{\rm a}^{2 +}} \rsqb }}\displaystyle{{\lsqb {{\rm Ca \hyphen} {\rm Z}_2} \rsqb } \over {{\lsqb {{\rm Na \hyphen Z}} \rsqb }^2}}$$
The systems of equations 6 and 8 with F i,j defined according to equation 3 will be referred to as the ‘all-component approach’ to fully coupling mineral dissolution and cation exchange.
In the next section, modelling results are presented that show that the all-component approach to fully coupling is flawed, and later a modified ‘common-component coupling’ version is presented that corrects its problems. Firstly, though, some standard approaches to combining kinetic and cation-exchange processes in numerical models are discussed and their limitations are highlighted.
Some models choose to ignore the coupling of kinetics and cation exchange completely and focus only on the reaction type that is most relevant to the application. For modelling of (relatively) short-term laboratory experiments, modellers may choose to include only cation-exchange reactions, as they may be believed to be the only reactions that occur significantly over the timescales of the experiment, whereas for long-term modelling of natural analogues, the cumulative effects of kinetics may be expected to dominate. The former approach corresponds to modelling the system using only equation 8 (and assuming that the number of exchange sites is constant), while the latter approach corresponds to modelling the system using equations 5 with R ij = 0. Both approaches have the benefit of simplicity, but will fail to represent any subtleties of the interplay between the two types of reaction. They also have the disadvantage that a single model cannot be used to represent both the short- and long-term behaviour of the system (if the reasoning above for considering only one type of reaction is assumed), which is often necessary if experimental observations are to be ‘upscaled’ to performance timescales. This fact may limit the degree of confidence of stakeholders in the overall approach to modelling, which is crucial when the modelling is used to underpin safety cases.
A similar approach to that given above is to choose to simulate two or more end members without cation exchange, and instead to use the rates F i and F j to drive the system towards an equilibrium other than the S i = S j = 0 dissolution/precipitation equilibrium at a kinetically controlled rate. This again corresponds to solving only equations 5 with R ij = 0, but with an alternative to equation 3 to define F i and F j. For example, the target equilibrium could be set to be K IE − Q IE = 0 for cation-exchange equilibrium, or to alterative equilibria that represent solid-solution conditions (Appelo & Postma, Reference Appelo and Postma2005). If used to model a kinetic approach to cation-exchange equilibria, the approach has the disadvantage that extremely fast kinetic rates may need to be applied in order to sufficiently approximate instantaneous cation-equilibrium assumptions, and when used to represent alternative equilibria such as solid solutions, cation exchange is not represented at all.
Another common approach is to include the presence of only one end member from a dissolution/precipitation perspective, but to then couple this to cation exchange so that the single end member defines the quantity of available exchange sites, while the cation-exchange subsystem determines the partitioning of the collection of sites between specified end members. Often the initially dominant end member would be chosen to be the one end member that is modelled kinetically. This approach corresponds to replacing equations 5 with an equation for a single kinetically controlled mineral and then using equation 8 to determine the ratio of the cation-site occupancies. It has the disadvantage that dissolution/precipitation kinetics for the single end member controls the number of exchange sites, and also that the dominant end member may change over time so that the choice of the single modelled end member may become increasingly inappropriate as the system evolves. Sometimes the quantity of exchange sites is assumed to be constant and therefore decoupled from any end member, which may lead to mass imbalance if the underlying end member(s) is assumed to be dissolving/precipitating.
Variations of the approaches described above have been used in the literature to model the evolution of clay systems that are relevant to geological disposal of radioactive waste, although often the approach that is taken is not made clear. Sometimes the choice of approach will be dictated mostly by the capabilities of the modelling software that is used rather than by the applicability of the alternative approaches to coupling. A summary of bentonite modelling publications and the apparent approach used to coupling is given in Table 1.
Table 1. Summary of reactive-transport models of bentonite interacting with solutes and approaches taken in modelling ion exchange and dissolution reactions.
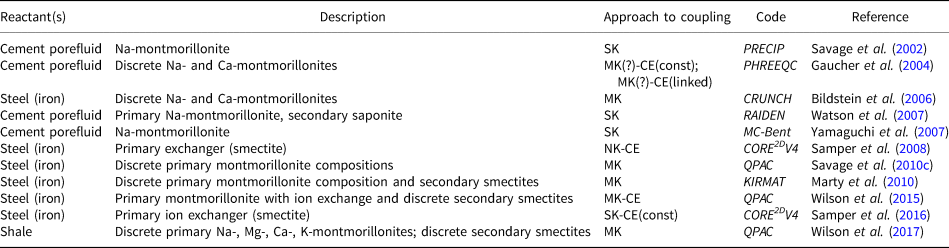
A question mark indicates uncertainty in the interpretation of the description of the modelling approach provided in the reference.
NK-CE = no kinetics, cation-exchange equilibrium; SK = single end-member kinetics; SK-CE(const/linked) = single end-member kinetics, cation-exchange equilibrium, constant/linked cation-exchange capacity; MK = Multi-end-member kinetics; MK-CE(const/linked) = multi-end-member kinetics, cation-exchange equilibrium, constant/linked cation-exchange capacity.
Numerical results and observations on the ‘all-component coupling’ numerical formulation
An illustrative example model has been constructed to demonstrate the potential for unrealistic behaviour to emerge from the all-component approach to coupling of cation-exchange and mineral kinetics. The example considers the system depicted in Fig. 1, in which water from a reservoir is allowed to diffuse into a small sample of bentonite. The temperature is specified to be 25°C everywhere. Only the bentonite region is modelled, and in the illustrative models it is split into 10 evenly spaced cells of 1 cm thickness; the external reservoir is represented in the model by a Dirichlet fixed water composition boundary condition.
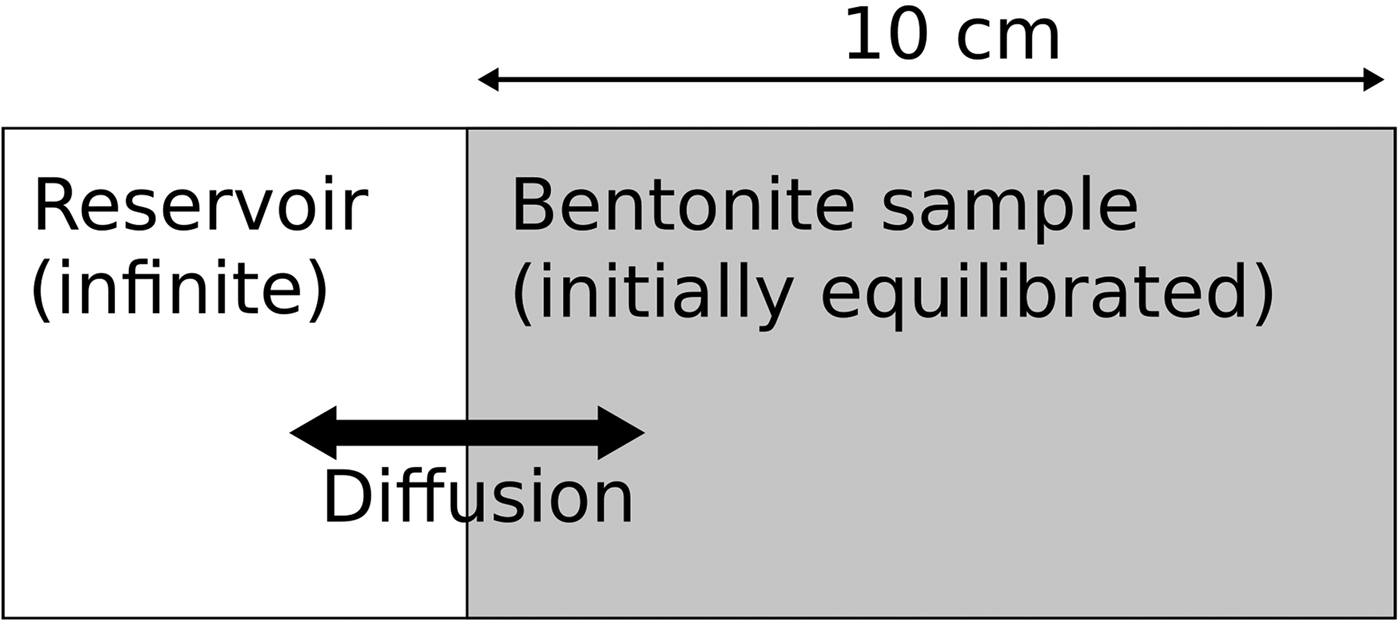
Fig. 1. Simple conceptual model used in the illustrative example models.
The model is only intended to be illustrative and therefore includes only a small number of aqueous species, which are listed in Table 2. All thermodynamic data in the model are taken from the thermo.com.v8.r6+ TDB. Montmorillonite end members and other mineral species that are included in the model are shown in Table 3. Mineral thermodynamic data are shown after a basis swap between Al3+ and the more dominant AlO2− species.
Table 2. Aqueous species included in the illustrative model and associated thermodynamic data (thermo.com.v8.r6+).
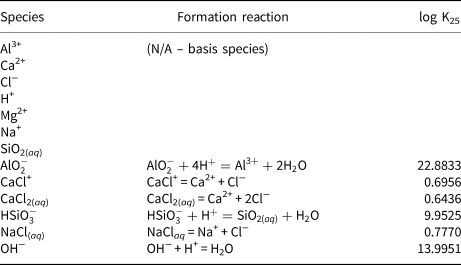
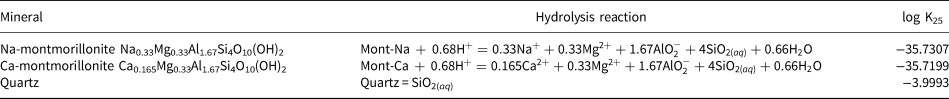
Table 3. Montmorillonite end members and mineral species included in the illustrative model and associated thermodynamic data.
The initial bentonite water is taken to be in equilibrium with the Na-montmorillonite, Ca-montmorillonite and quartz. The equilibrium constraints are as listed in Table 4. One constraint is listed for each aqueous basis species in the model; the remaining aqueous species are constrained by their mass equations (Table 2). The computed initial bentonite porewater is shown in Table 5. The Davies activity model (Appelo & Postma, Reference Appelo and Postma2005), which is applicable at the low-ionic-strength solutions considered in the example, was used when computing activities of aqueous species.
Table 4. Porewater constraints assumed for the initial bentonite water and external water. One constraint is required for each basis species in the model. ( ${\rm AlO}_2^- $ is the Al basis species after basis swapping with Al3+).
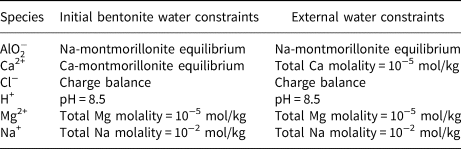
Table 5. Computed initial bentonite porewater and external water compositions.
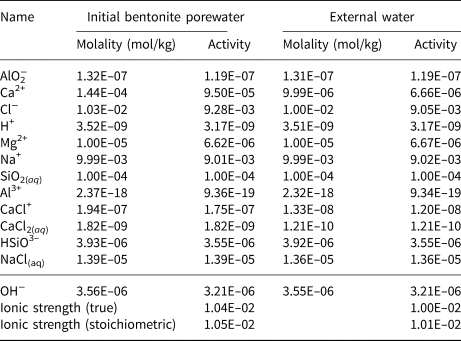
The external water in the reservoir (Fig. 1) is taken to be similar to the initial bentonite water. The only difference in the porewater constraints from those shown in Table 4 for the initial bentonite porewater is that the constraint on Ca2+ is replaced by a constraint on the total Ca concentration being 10−5 mol/kg. This represents a reduction in the total Ca molality of approximately an order of magnitude when compared to the bentonite porewater (Table 5) and results in a porewater in which Ca-montmorillonite is under-saturated. The computed external porewater composition is also shown in Table 5. With the reaction for Ca-montmorillonite expressed in terms of AlO2−, the log IAP in the computed composition is –35.9039. The corresponding log K is –35.7199 (Table 3), so log(Q Ca/K Ca) = −0.184 and therefore the external water composition is only slightly under-saturated with respect to Ca-montmorillonite and is in equilibrium with Na-montmorillonite and quartz by design. In particular, the Na+ concentrations in both waters are identical.
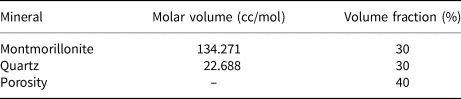
The initial composition of the bentonite that is assumed in the model is shown in Table 6. The montmorillonite inventory is shared between Na-montmorillonite and Ca-montmorillonite according to the cation-exchange equilibrium in the initial porewater (i.e. equation 10 is solved together with the constraint on the initial volume fraction of montmorillonite to obtain the initial values of Na-Z and Ca-Z2) (Table 5). A Gaines–Thomas equilibrium coefficient (selectivity coefficient) of K IE = 0.69 was assumed for the cation-exchange reaction (equation 9).
Table 6. Bentonite composition.
The effective diffusion coefficient for all solutes in the bentonite is given by a simple linear Archie's law (equation 11):
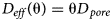 $$D_{eff}\lpar {\rm \theta} \rpar = {\rm \theta} D_{\,pore}$$
where θ is the porosity. D pore = 5 × 10⁻⁹ m2/s is chosen. Porosity evolves in the system due to precipitation and dissolution of the minerals.
The reaction rates for each mineral assume a reaction of the form of equation 3, with (equation 12):
 $$F_i = r_iA_iW_im_i\left( {\displaystyle{{Q_i} \over {K_i}}-1} \right)$$
Here, r i (mol m−2 s−1) is the rate of reaction per unit area of reacting mineral surface, A i (m2 g−1) and W i (g mol−1) are the specific surface area and molecular weight of the mineral, respectively, and m i (mol m−3) is the mineral concentration, so that the reaction rate depends on the available mineral surface area for reaction, which is determined from its abundance. For the montmorillonite minerals, r i is assigned a ‘rapid’ dissolution rate value 10−6 mol m−2 s−1, which will still be relatively slow when compared to the instantaneous treatment of ion exchange. This value was used to promote alteration, noting that reported values used in reactive-transport models are often much slower than this (e.g. Wilson et al., Reference Wilson, Benbow, Metcalfe and Leung2017). Quartz is treated as inert in the model by assigning r i a value of zero.
As the external water is under-saturated with respect to Ca-montmorillonite, but is in equilibrium with Na-montmorillonite, the expected behaviour of the example model is that the solid composition would gradually shift towards a Na-montmorillonite-dominated composition as the system evolves.
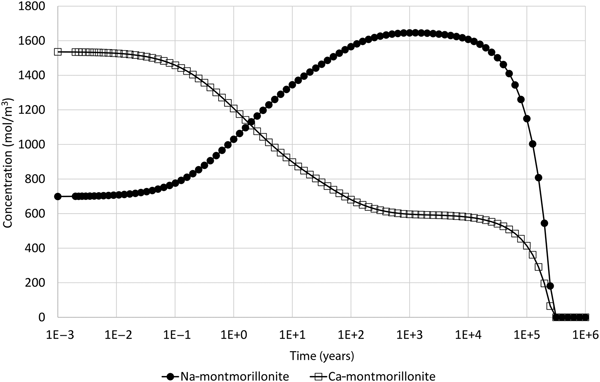
The actual behaviour of the minerals in the model is shown in Fig. 2, which shows the evolving concentrations of Na-montmorillonite and Ca-montmorillonite in the 1 cm-thick cell adjacent to the external water boundary. The simulations were performed using the software QPAC (Quintessa, 2013). With the specified initial water, the initial ratio of Na:Ca-montmorillonite is approximately 1.0:2.2, and in terms of Na-Z:Ca-Z2 is approximately 1.0:1.1.
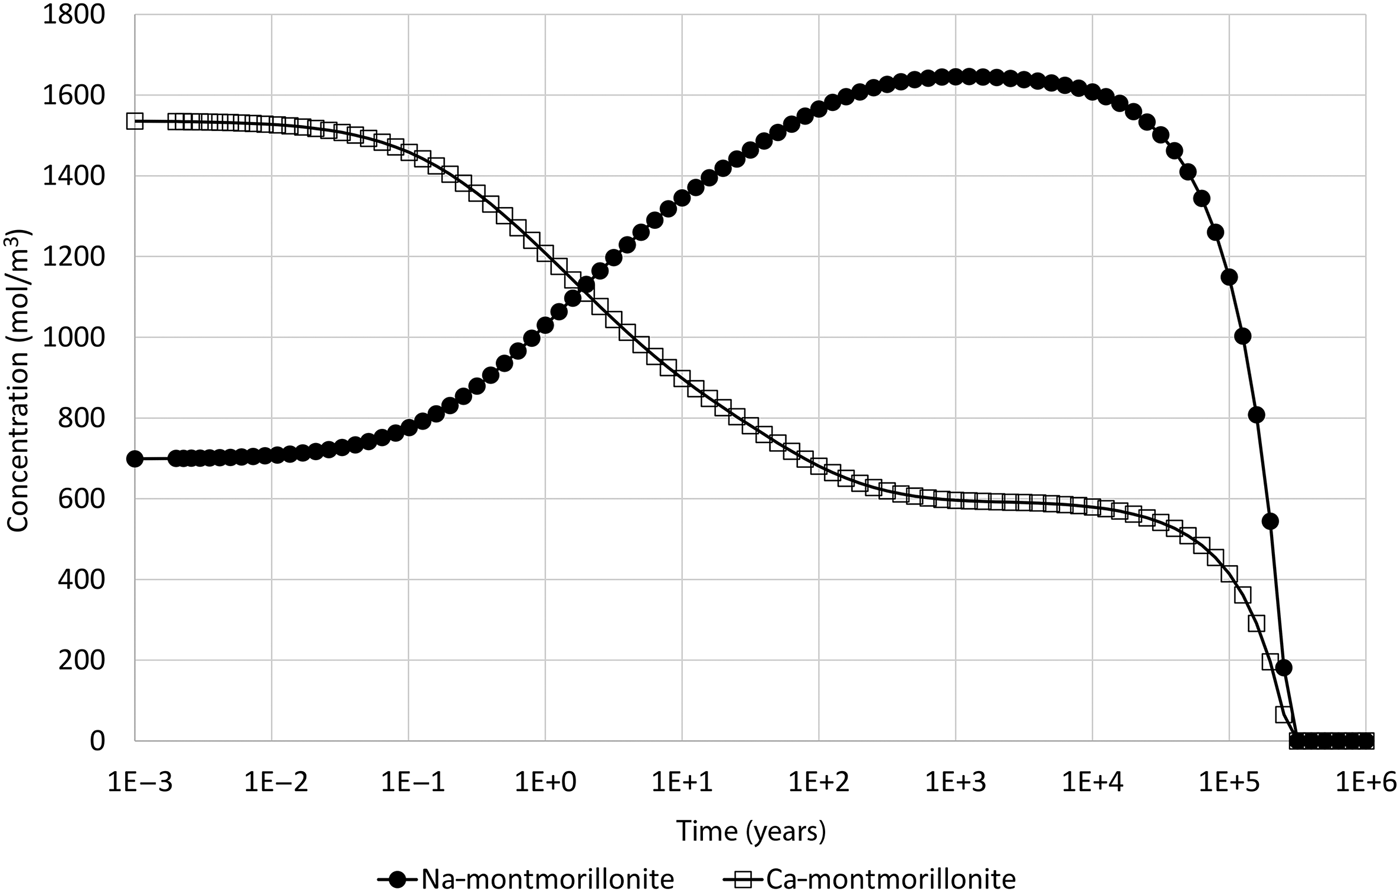
Fig. 2. Concentration of Na-montmorillonite (Na0.33Mg0.33Al1.67Si4O10(OH)2) and Ca-montmorillonite (Ca0.165Mg0.33Al1.67Si4O10(OH)2) in the cell adjacent to the external water boundary condition.
The expected behaviour – that the composition would shift to being Na-dominated – is initially seen in the model. After ~1000 years of evolution, the Na:Ca-montmorillonite ratio is approximately 1.00:0.36 (Na-Z:Ca-Z2 is approximately 1.00:0.18). At this point, the Na-montmorillonite and Ca-montmorillonite concentrations are approaching 1710 and 525 mol/m3, respectively, which are the concentrations that are obtained if the cation-exchange equilibrium (equation 10) is solved for the external water composition (and the initial montmorillonite mass is unchanged). However, after this time, the concentrations of both montmorillonite end members decrease until eventually all montmorillonite is depleted in the cell at ~250,000 years. Figure 3 shows the saturation indices (log(Q i/K i)) of the montmorillonite end members and also the activity product for the cation-exchange reaction, from which it is clear that Na-montmorillonite is always saturated in the porewater (so would not be expected to dissolve), Ca-montmorillonite is always under-saturated in the porewater and the cation exchange-equilibrium is always satisfied.
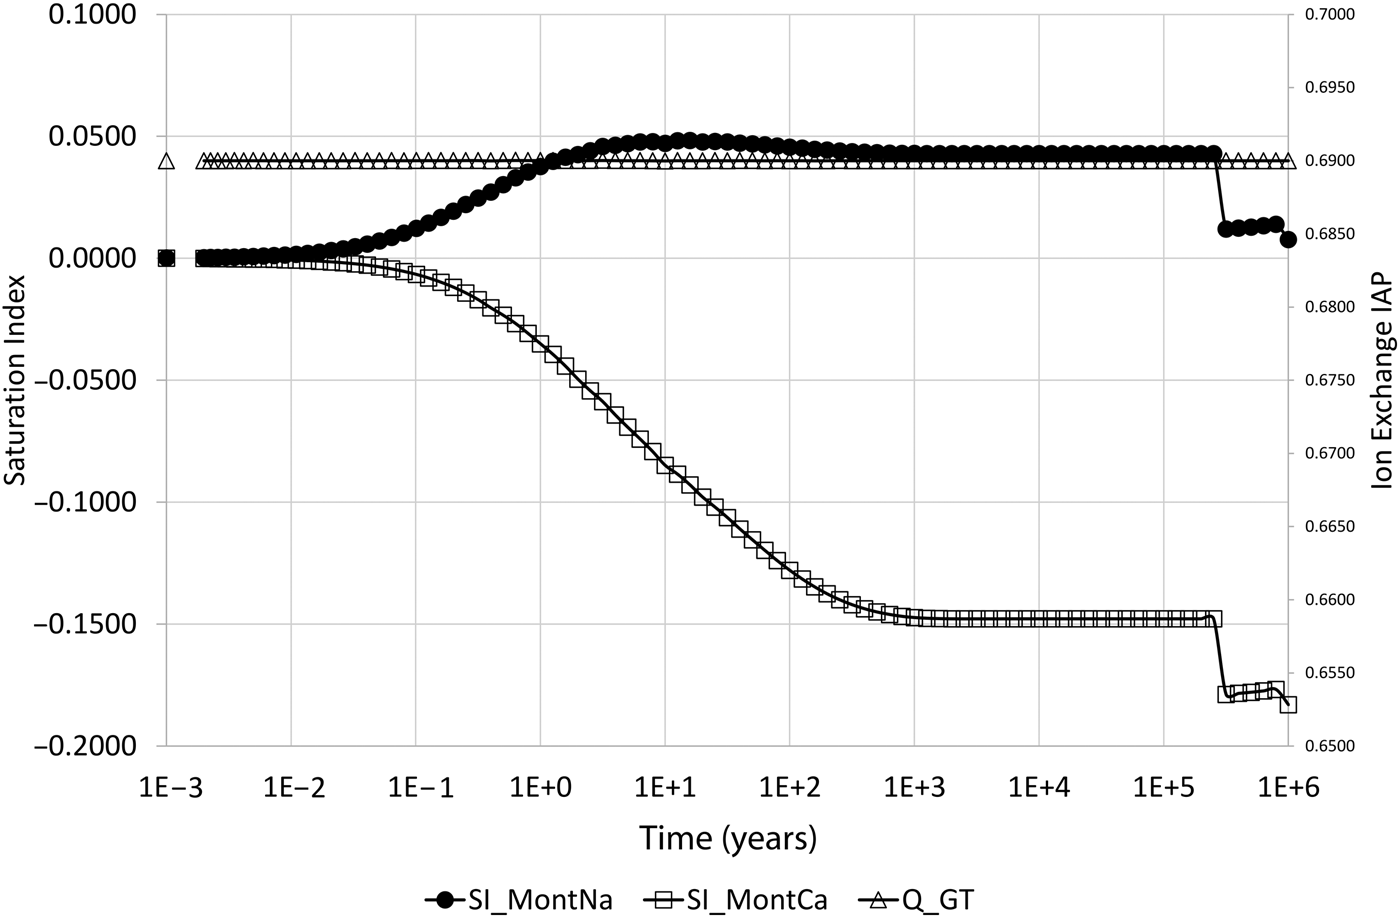
Fig. 3. Saturation indices (log(Q i/K i)) of Na-montmorillonite (SI_MontNa) and Ca-montmorillonite (SI_MontCa) and activity product for the cation-exchange reaction (Q_GT) in the cell adjacent to the external water boundary condition. The behaviour of the curves after the dissolution event is controlled by the mixing of the solutes in the external water and solutes in back-diffusing water from the next cell in the 1D model, in which montmorillonite is subsequently dissolving.
After the dissolution event, log(Q Ca/K Ca) falls to approximately –0.178, which is close to the saturation of –0.184 of Ca-montmorillonite in the external water as noted above (Fig. 3).
After the sharp fall, log(Q Ca/K Ca) rises slightly and then falls once more. Similarly, log(Q Ca/K Ca) is close to zero, being the saturation of Na-montmorillonite in the external water, and exhibits the same ‘fall, rise, fall’ pattern. The reason for this pattern is that Fig. 2 and Fig. 3 show only the behaviour in the first cell in the 1D model, which is adjacent to the external water. After montmorillonite is dissolved in the first cell, the diffusively controlled dissolution front proceeds to the next cell, where further montmorillonite dissolution begins. At this time, the water composition in the first cell is a mixture of external water and montmorillonite-equilibrated water in the next cell, which back-diffuses into the first cell. The precise composition is determined by the rates of diffusion of the waters and the rate of dissolution of the montmorillonite(s), which is non-constant. The timing of the second ‘fall’ coincides with complete dissolution of montmorillonite in the second cell, and the value of log(Q Ca/K Ca) at this time is –0.183, which is very close to the external water saturation value of –0.184, showing that by this time the water in the first cell is dominated by the external water composition.
The reason that both montmorillonite minerals are seen to dissolve is as follows: the initial evolution is controlled by the fast (instantaneous) cation-exchange process that acts to equalise the disequilibrium caused by the low Ca concentration boundary condition, the main effect of which is to cause a shift towards Na-Z dominance in the montmorillonite. The rate at which this occurs is limited by the rate of diffusion of Ca2+ ions into the bentonite from the low-concentration boundary. The shift to Na-Z dominance releases Ca2+ ions into solution, which act to inhibit the Ca-montmorillonite dissolution reaction that would otherwise occur due to the under-saturation of Ca-montmorillonite in the external water. This process continues until the cation-exchange equilibrium condition approaches the cation equilibrium in the external water. When this happens, the ‘driving force’ for the cation-exchange disequilibrium is removed and so the production of Ca2+ ions from the shifting cation-exchange equilibrium disappears and the Ca-montmorillonite dissolution reaction is no longer inhibited. At this point, direct dissolution of Ca-montmorillonite due to the low-concentration boundary condition occurs. This leads to a disequilibrium in the cation exchange that is compensated by some Na-Z shifting back towards Ca-Z2. This has the double effect of causing a reduction in Na-montmorillonite (which will be referred to as ‘implicit dissolution’, although this is not kinetically driven, as the Na-montmorillonite is saturated in the porewater, as can be seen in Fig. 3), while also reducing Ca2+ concentrations in the porewater, thus causing increased kinetic dissolution of Ca-montmorillonite. This process continues indefinitely, as it is driven by the low Ca2+ concentration in the (infinite) reservoir, until the montmorillonite is entirely dissolved.
The simple model therefore illustrates the point that when cation exchange and mineral kinetics are fully coupled using the all-component approach, potentially unrealistic behaviour may emerge from the models and, in particular, prolonged under-saturation of one cation-exchanger mineral in the model may lead to compete dissolution of all related exchanger minerals and hence of the underlying mineral itself.
A ‘common-component’ numerical formulation of coupled cation-exchange and mineral kinetics
Here, a variation on the all-component coupling approach is presented that can avoid the unrealistic behaviour seen in the illustrative model in the previous section. Kittrick (Reference Kittrick1971) proposed that the hydrolysis reaction for the solubility of montmorillonite should only depend upon ions common to the montmorillonite structure and upon the exchange capacity of the montmorillonite, and should be independent of the exchangeable cation (other than Al3+ and Mg2+, which can be treated with a mildly elaborated analysis) and of its activity in solution. If this is assumed, then the dissolution of montmorillonite should be controlled by a dissolution reaction of the structural unit, Z ( = (1/0.33)[Mg0.33Al1.67Si4O10(OH)2]0.33−), of montmorillonite (equation 13):
 $${\rm Z} + 18{\rm H}{^ +} = 5{\rm A}{\rm l}^{3 +} + {\rm M}{\rm g}^{2 +} + 12{\rm Si}{\rm O}_{2\lpar {{\rm aq}} \rpar } + 12{\rm H}_2{\rm O}$$
Here, Z is considered to be any other mineral phase despite its intrinsic negative structural charge.
The above analysis suggests that the all-component model for coupled cation-exchange and mineral dissolution described earlier might be modified so that the equilibrium for the dissolution reaction for the exchanger phases is independent of the concentration of the exchangeable cation in solution and only depends on the common ions in the montmorillonite structure. In the context of the illustrative model, this would be expected to stabilize the coupled cation-exchange and dissolution processes, in the sense that the implicit dissolution of over-saturated minerals would be prevented.
In terms of the reactive transport model, the only update that is necessary is to modify the dissolution rate formula (equation 3) to be dependent upon the saturation of the montmorillonite structural unit rather than the saturation of the montmorillonite end member; in other words, to express the kinetically controlled dissolution/precipitation rates F i as being dependent on a structural unit saturation defined by equation 14:
 $$S_Z = \displaystyle{{Q_Z} \over {K_Z}} - 1$$
where the activity product and equilibrium constant Q Z and K Z are determined for the structural unit Z corresponding to the reaction given in equation 13. The corresponding reaction rate formula is then defined by equation 15:
 $$F_i = F_i\lpar {{\cal S}} \rpar = k_i\lpar {{\cal S}} \rpar \left( {\displaystyle{{Q_Z} \over {K_Z}}-1} \right)$$
 The reaction rate  $k_i\lpar { {\cal S}} \rpar $ should be defined such that it is ensured that it yields a rate that is consistent with the relative proportions of the exchanger minerals when compared with the analogous rate
  $k_j\lpar { {\cal S}} \rpar $ for the other exchanger minerals that are present. This condition arises naturally if a rate expression similar to equation 12 is used (equation 16):
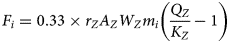 $$F_i = 0.33 \times r_ZA_ZW_Zm_i\left( {\displaystyle{{Q_Z} \over {K_Z}}-1} \right)$$
Here, r Z (mol m−2 s−1), A Z (m2 g−1) and W Z (g mol−1) are the rate of reaction per unit area, the specific surface area and the molecular weight of the structural unit, respectively, rather than of the end member, as was the case in the analogous equation 12.
With the rate F i given by equation 16, all exchanger minerals will either ‘dissolve or precipitate together’, so that the situation exhibited by the illustrative example based on the all-component coupling model should not arise. The model based on this approach will be referred to as the ‘common-component approach’ to coupling throughout.
Numerically, the modification to implement the common component coupling model is quite trivial, requiring little alteration of existing models/codes that can implement the all-component coupling approach. Thermodynamically, however, the proposed alteration is more challenging, as it requires derivation of equilibrium constants that are appropriate for the hydrolysis reaction for the clay structural unit. This is discussed in the next section.
Derivation of equilibrium constants for clay structural units
The estimated ∆G°f value of –5240.05 kJ mol−1 for structural unit Z (i.e. X 0.33Mg0.33Al1.67Si4O10(OH)2 where X is the vacant site of a monovalent cation) generated using the polyhedral summation method described by Wilson et al. (Reference Wilson, Benbow, Watson, Sasamoto and Savage2015) was used along with the estimated molal entropy (S°) and heat capacity (C°p) coefficients to calculate log K values for the reaction in equation 17:
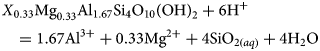 $${X}_{0.33}{\rm M}{\rm g}_{0.33}{\rm A}{\rm l}_{1.67}{\rm S}{\rm i}_4{\rm O}_{10}\lpar {{\rm OH}} \rpar _2 + 6{\rm H}{^ +} = 1.67{\rm A}{\rm l}^{3 +} + 0.33{\rm M}{\rm g}^{2 +} + 4{\rm Si}{\rm O}_{2(aq)} + 4{\rm} {\rm H}_2{\rm O}$$
Standard molal entropy (S°) and Maier–Kelley heat capacity coefficients (a, b, c) were estimated using the ‘analogue mineral algorithm’ approach (Helgeson et al., Reference Helgeson, Delany, Nesbitt and Bird1978), whereby required values of a standard molal thermodynamic property are generated by the addition/subtraction of oxide/water values from an analogue mineral to give the composition of the mineral of interest. This method typically results in estimates that are within ~2% of measured values.
Using pyrophyllite (Al2Si4O10(OH)2) as an analogue, entropy can be estimated by writing equation 18:
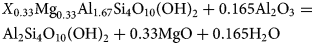 $$\eqalign{& {X}_{0.33}{\rm M}{\rm g}_{0.33}{\rm A}{\rm l}_{1.67}{\rm S}{\rm i}_4{\rm O}_{10}\lpar {{\rm OH}} \rpar _2 + {\rm} 0.165{\rm A}{\rm l}_2{\rm O}_3 = \cr & {\rm A}{\rm l}_2{\rm S}{\rm i}_4{\rm O}_{10}\lpar {{\rm OH}} \rpar _2 + {\rm} 0.33{\rm MgO} + 0.165{\rm} {\rm H}_2{\rm O}} $$
Assuming ∆(S°)r = 0,
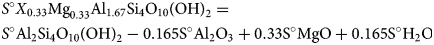 $$\eqalign{& {S}^\circ {\rm} {X}_{0.33}{\rm M}{\rm g}_{0.33}{\rm A}{\rm l}_{1.67}{\rm S}{\rm i}_4{\rm O}_{10}\lpar {{\rm OH}} \rpar _2 = \cr & {S}^\circ {\rm A}{\rm l}_2{\rm S}{\rm i}_4{\rm O}_{10}\lpar {{\rm OH}} \rpar _{2} - 0.165{\rm S}^\circ {\rm A}{\rm l}_2{\rm O}_3 + {\rm} 0.33{\rm S}^\circ {\rm MgO} + 0.165{\rm S}^\circ {\rm} {\rm H}_2{\rm O}} $$
which gives S° = 249.266 J mol−1.
Equation 19 was also used to generate estimates of Maier–Kelley heat capacity coefficients (a = 332.329 J mol−1; b (× 103) = 170.216 J mol−1 K−1; c (× 10−5) = 68.566 J mol−1K−2; C p = a + bT − cT −2).
The calculated ∆G°f,, S° and heat capacity coefficients were used along with the assumption that the volume of the structural unit X would be similar to that of Na-montmorillonite to generate log K values for hydrolysis reactions using the code SUPCRT92 (Johnson et al., Reference Johnson, Oelkers and Helgeson1992) and the 1996 version of the SUPCRT database (dprons96.dat), which is compatible with the thermo.com.v8.r6+ database. Note that SUPCRT92 will only run if reactions are charge balanced; therefore, the hydrolysis reaction was specified for H-exchanged montmorillonite (noting that ∆G°f, H+ = 0). The calculated log K values and reported values for Ca- and Na-montmorillonite are given in Table 7.
Table 7. Log K values of mineral hydrolysis reactions at saturation pressure of pure water for various temperatures

Numerical results for the common-component coupling formulation
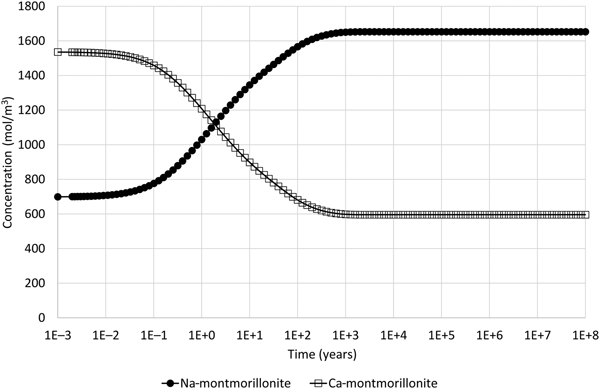
When the illustrative model described earlier is updated to include the common-component approach to coupling, where mineral dissolution and precipitation are assumed to be dependent upon the departure from equilibrium of the montmorillonite structural unit only, the results shown in Fig. 4 are obtained, which shows the evolution of montmorillonite in the cell adjacent to the external water. These results can be compared with the corresponding results in Fig. 2 for the all-component coupling approach.
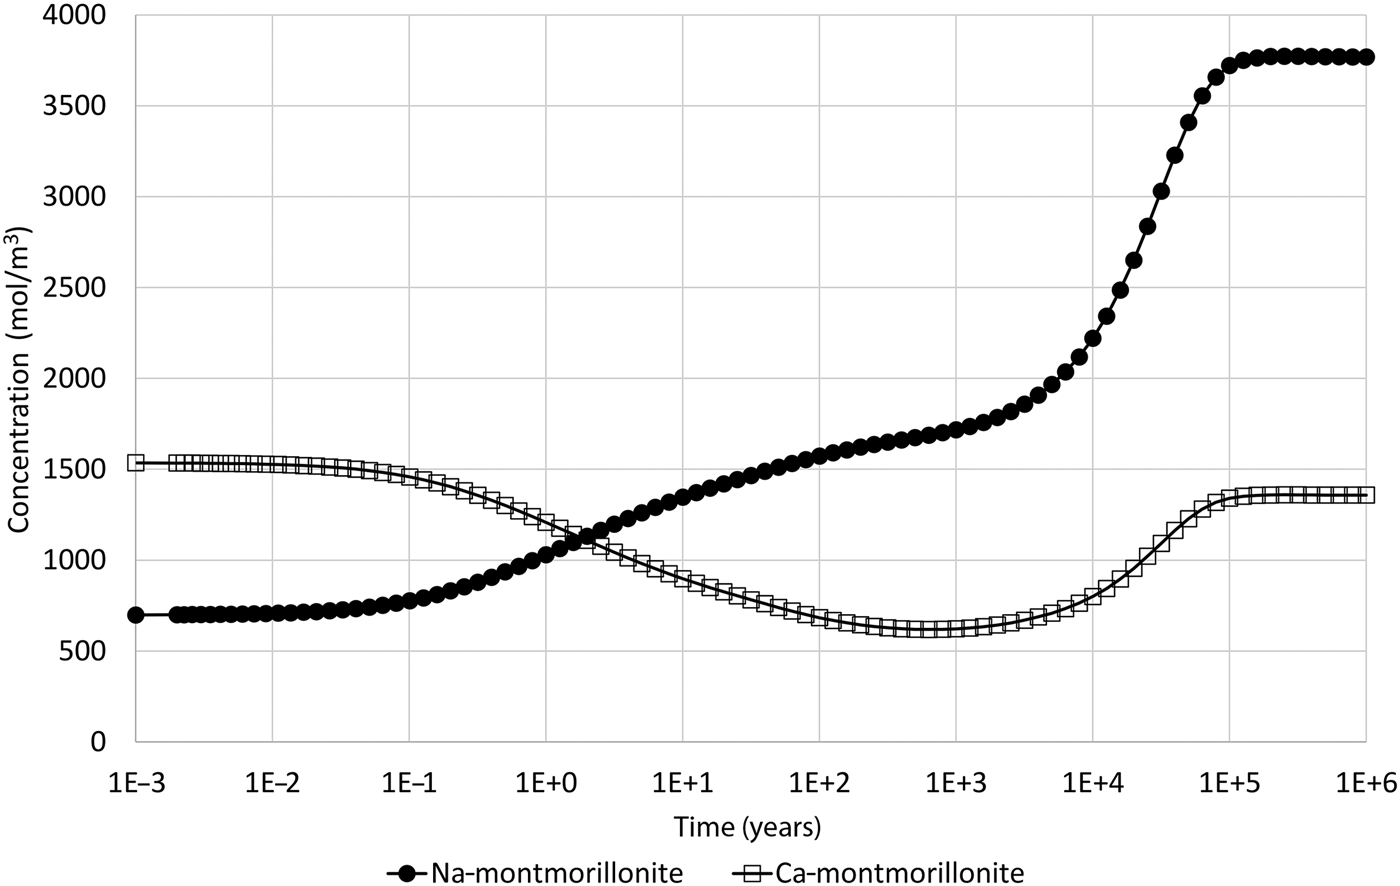
Fig. 4. Concentration of Na-montmorillonite (Na0.33Mg0.33Al1.67Si4O10(OH)2) and Ca-montmorillonite (Ca0.165Mg0.33Al1.67Si4O10(OH)2) in the cell adjacent to the external water boundary condition when the common-component formulation for cation exchange and montmorillonite dissolution is used (cf. Fig. 2, which shows the corresponding evolution when the all-component approach to coupling is used).
The logarithm (base 10) of the IAP for the reaction in equation 17 for the structural unit Mg0.33Al1.67Si4O10(OH)2 in the external water composition is 3.18. The corresponding log K at 25°C is 1.128 (Table 7) and so the structural unit is saturated in the external water (saturation index = 2.05). Thus, it is expected that montmorillonite would precipitate in the model as solutes diffuse into the montmorillonite from the external water, with exchangeable cations also taken up as the montmorillonite layers form. This expected precipitation occurs over the long term (hundreds to many thousands of years) and is observed in Fig. 4. In the shorter term, cation exchange between the two montmorillonite forms takes place due to the dominance of Na over Ca in the external porewater. At ~105 years, precipitation slows. This is due to the gradual reduction in porosity (Fig. 5), which reduces the effective diffusion coefficient in the montmorillonite near the boundary.
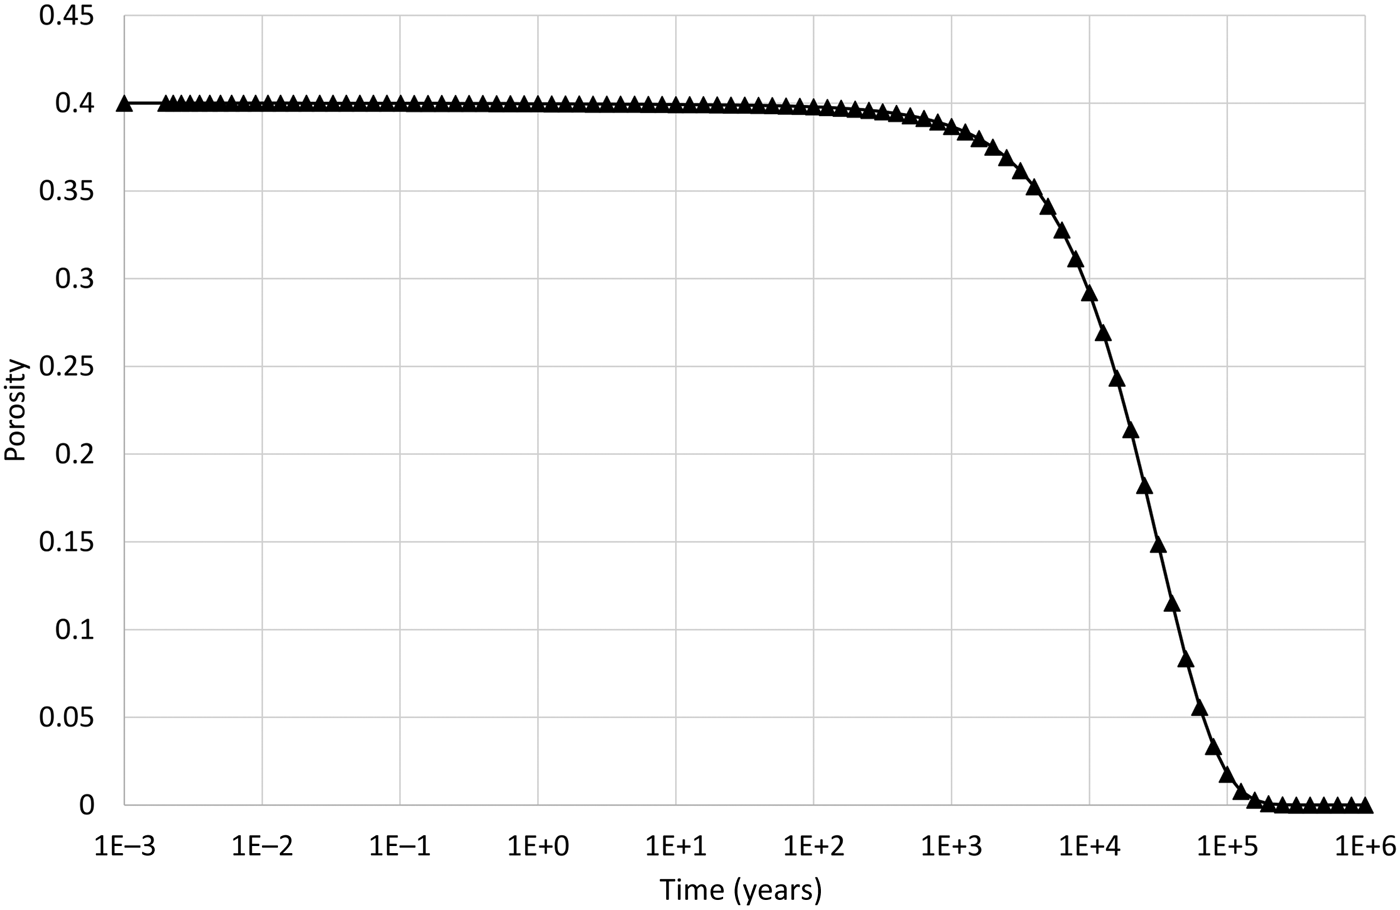
Fig. 5. Porosity evolution in the cell adjacent to the external water boundary condition when the common-component formulation for cation exchange and montmorillonite dissolution is used.
Montmorillonite precipitation may be suppressed in the model if it is thought to be unlikely. The corresponding evolution of Na- and Ca-montmorillonite adjacent to the external water boundary when this is done is shown in Fig. 6. In this case, only ion exchange is observed and no dissolution occurs, which is more consistent with the physical expectations for the illustrative model setup.
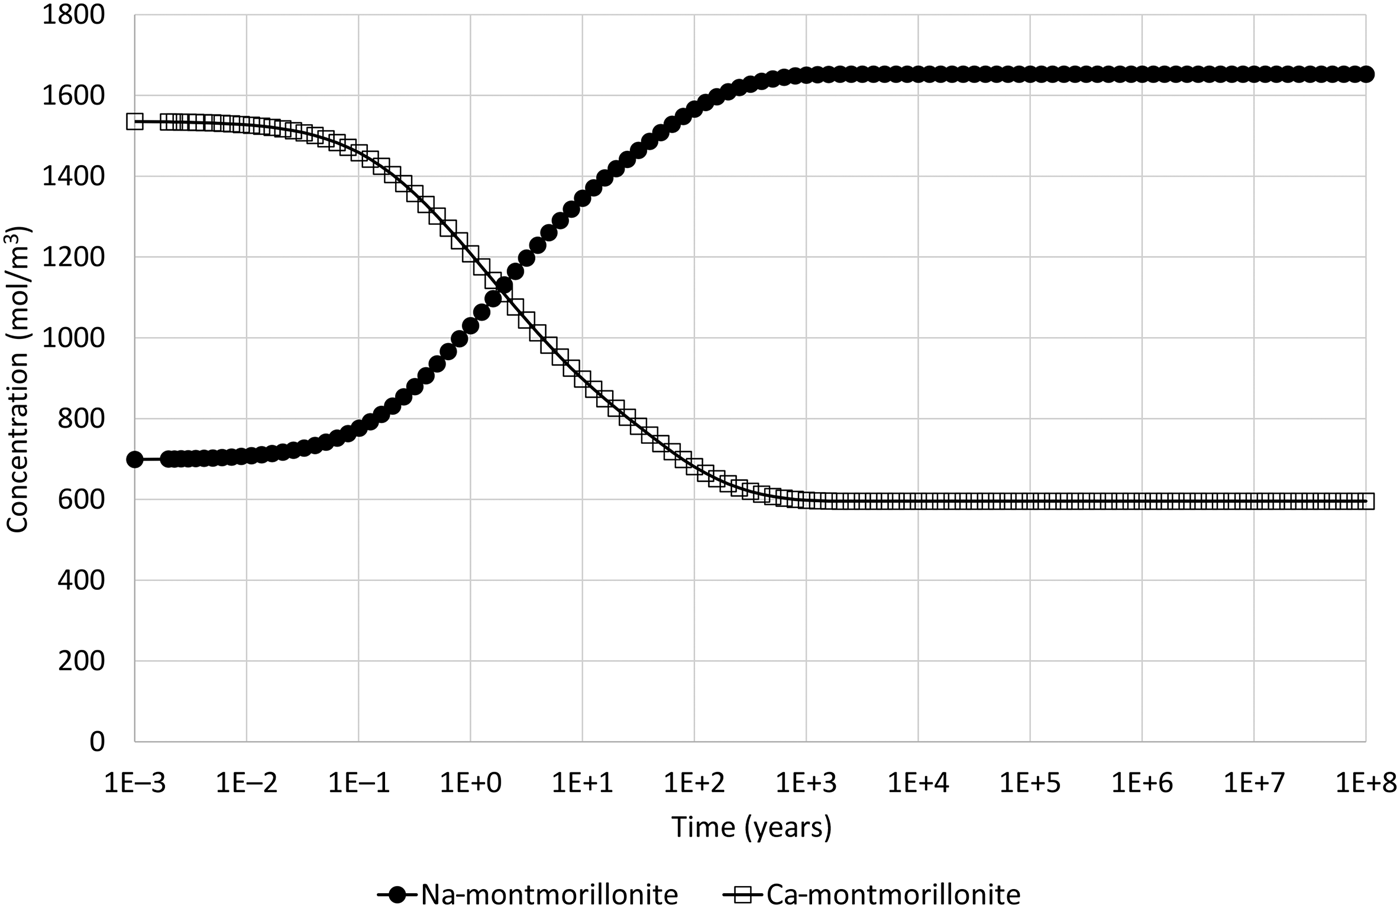
Fig. 6. Concentration of Na-montmorillonite (Na0.33Mg0.33Al1.67Si4O10(OH)2) and Ca-montmorillonite (Ca0.165Mg0.33Al1.67Si4O10(OH)2) in the cell adjacent to the external water boundary condition when the common-component formulation for cation exchange and montmorillonite dissolution is used and when montmorillonite precipitation is suppressed (cf. Fig. 4, which shows the corresponding evolution when montmorillonite precipitation is permitted).
The common-component coupling model has also been applied to a case in which montmorillonite dissolution would be expected. To construct the case, the previous example was modified so that the montmorillonite structural unit is under-saturated in the external water. To achieve under-saturation, the Mg concentration in the external water is reduced to 10−12 mol/kg (which is much lower than expected for natural porewaters), while all other porewater species have concentrations at the same values as those reported in Table 5. With this change, the logarithm (base 10) of the IAP for the reaction in equation 17 for the structural unit Mg0.33Al1.67Si4O10(OH)2 in the external water composition is 0.864. The corresponding log K at 25°C is 1.128 (Table 7) and so the structural unit is under-saturated in the external water (saturation index = –0.265).
With this change to under-saturated conditions for the montmorillonite structural unit in the external water, the resulting evolution, which is shown in Fig. 7, is similar to that seen in the illustrative example using the all-component coupling approach (Fig. 2). However, the dissolution of both montmorillonite end members is expected in this case (whereas in the illustrative example with the all-component coupling approach to coupling it was not, as only Ca-montmorillonite was under-saturated in the external water).
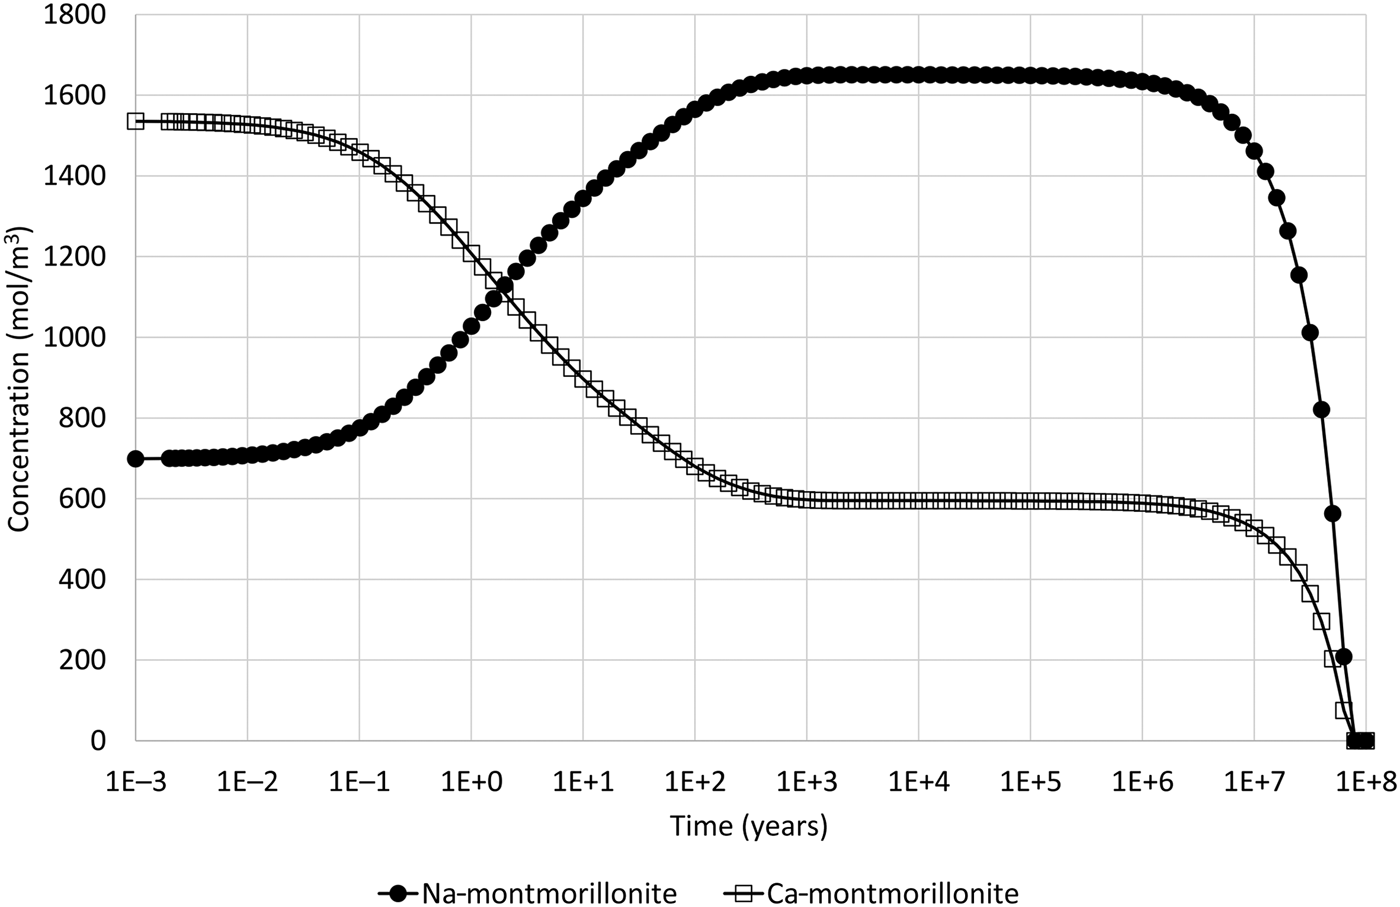
Fig. 7. Concentration of Na-montmorillonite (Na0.33Mg0.33Al1.67Si4O10(OH)2) and Ca-montmorillonite (Ca0.165Mg0.33Al1.67Si4O10(OH)2) in the cell adjacent to the external water boundary condition when the common-component formulation for cation exchange and montmorillonite dissolution is used and when Mg concentration is reduced in the external water so that the montmorillonite structural unit is under-saturated (cf. Fig. 4, which shows the corresponding evolution when montmorillonite precipitation is permitted).
Conclusions
Most numerical formulations of the reactive-transport equations with cation exchange do not attempt to represent all end members in the mineral assemblage and to fully couple them to cation-exchange equilibria, and so subtleties of the interplay between the two types of reaction may be lost. An ‘all-component’ approach to fully coupling cation exchange reactions was introduced, in which dissolution/precipitation of the exchanger clay minerals is shown to lead to unrealistic dissolution of all exchanger minerals in the event that a single exchanger mineral is under-saturated in an invading porewater. In the illustrative example presented, Ca-montmorillonite was under-saturated in the invading water, whereas Na-montmorillonite was not, but both Ca-montmorillonite and Na-montmorillonite were seen to dissolve entirely in the simulation.
Based on ideas previously presented in stability analyses for montmorillonite minerals (Kittrick, Reference Kittrick1971), an alternative ‘common-component’ formulation of the coupling between cation-exchange and mineral kinetics was then presented that assumes that solubility of montmorillonite is independent of the exchangeable cation and depends only on the saturation of the common shared structural unit among the exchanger minerals, rather than being based on the individual ideal mineral saturations. The common-component coupling model is a trivial modification of the all-component coupling approach, but it is thermodynamically more complicated, requiring equilibrium constants to be determined for the 2:1 structural unit (i.e. a half unit-cell formation that lacks interlayer ions). Equilibrium constants have been derived using a polyhedral method to estimate the Gibbs free energy of formation from the elements (∆G°f) of the structural unit at 25°C, 1 bar. An analogue mineral algorithm approach was used to estimate standard molal entropy and heat capacity coefficients of the structural unit so that log K values for mineral hydrolysis could be calculated at T ≠ 25°C.
Modelling results based on the common-component stability definition for the exchanger minerals have been presented, whose predicted evolutions are more consistent with physical expectations. In particular, the ability for a single under-saturated (ideal) exchanger mineral to cause complete dissolution of all exchanger minerals is avoided in the common-component coupling formulation.
Acknowledgements
The original work described in this paper was financed by STUK, the Radiation and Nuclear Safety Authority in Finland, under framework contract 8/Y40021/2013. The views and conclusions presented in the paper are those of the authors and do not necessarily represent the official position of STUK. The authors are grateful for the comments of two anonymous reviewers, which resulted in significant improvements to the manuscript.