Introduction
Livestock is kept for their production (milk, meat and egg), draught and by-products (hides, horns and offals). Their products are the main source of energy, protein, fat, calcium and micro-nutrients. These products contribute 28% of proteins and 13% of calories Worldwide and hence play an important role to fulfil nutritional requirements of human beings. In agriculture, bulls are used for transportation (Upton, Reference Upton2004; Cardona and Carmena, Reference Cardona and Carmena2013). Horns are used for making buttons and parts of weapons while hides are important materials for leather industry. The dung of the animals is used as a fuel and fertilizer (Ghosh et al., Reference Ghosh, Azhahianambi and de la Fuente2006). Livestock has a major role in the World's economy as it fulfils major objectives for low-income populations. Parasites are the organism that are metabolically and physiologically dependent on their hosts for survival and development (Perry and Randolph, Reference Perry and Randolph1999). A humid and cold environment provides an optimum condition for development and survival of helminths as already described from a study in Tanzania (Keyyu et al., Reference Keyyu, Kassuku, Msalilwa, Monrad and Kyvsgaard2006). Parasitic infections and infestations are seasonal in nature. For example tick-borne clinical cases start gaining activity from June to August according to study conducted in USA and Pakistan (Bacon et al., Reference Bacon, Kugeler and Mead2008; Rashid et al., Reference Rashid, Haroon, Rashid, Khalid, Liaquat, Saghir, Wasim, Saher and Shahid2018) while intestinal parasitism becomes an alarming issue from June/July to November/December according to study conducted in Zambia and West Africa (Belem et al., Reference Belem, Ouédraogo and Bessin2001; Phiri et al., Reference Phiri, Phiri, Chota and Monrad2007). Parasites are more prevalent and severe in young and exotic cattle breeds than local and adult animals (Siddiki et al., Reference Siddiki, Uddin, Hasan, Hossain, Rahman, Das, Sarker and Hossain2010). With the passage of time, cattle acquire immunity against parasitic infections and then the egg count decreases even in highly infected animals (Phiri et al., Reference Phiri, Phiri and Monrad2006). Parasitic infections are transmitted from animal to animal or from animal to human mainly by ingestion of infective larvae or oocysts through contaminated water, soil and food. The parasites are also transmitted by vectors (ticks, mites and flies) (Slifko et al., Reference Slifko, Smith and Rose2000). Intestinal parasites share host nutrition and hence create health disorders, while hemoparasites infect host immune cells, Red Blood Cells (RBCs) and plasma, thus they frequently cause immunosuppression. These disorders lead to economic losses in terms of decreased production, reduced weight gain, morbidity and mortality (Keyyu et al., Reference Keyyu, Kassuku, Msalilwa, Monrad and Kyvsgaard2006; Siddiki et al., Reference Siddiki, Uddin, Hasan, Hossain, Rahman, Das, Sarker and Hossain2010; Charlier et al., Reference Charlier, Velde, van der Voort, Van Meensel, Lauwers, Cauberghe, Vercruysse and Claerebout2015). Clinical and subclinical parasitic infections cause huge economic losses in cattle (Belem et al., Reference Belem, Ouédraogo and Bessin2001). The dairy industry is facing economic losses due to helminths and protozoan diseases (Belem et al., Reference Belem, Ouédraogo and Bessin2001). It is important to estimate economic losses caused by parasitic infection and their complications so that the disease should be controlled to overcome their long-term losses from the subclinical infection. Small dairy farm holders put attention only on clinically infected animals but they neglect subclinically infected animals and thus, they face long-term problems of decreased production. Already conducted studies calculated parasitic economic losses on the basis of herd, specific area, a total number of samples or individual animal either decreased production or financial losses. In this study, we have calculated average economic losses from conducted studies caused by parasitic diseases due to ecto- and endo- parasites (flies, ticks, mites and helminths). We have outlined different methods/models collected from literature used for the calculation of economic losses. Moreover, we have highlighted the most economically important cattle parasites spp. according to a number of literature available and site of infection.
Materials and methods
Database search
A search was conducted on Science Direct (http://www.sciencedirect.com/science/search) and PubMed (https://www.ncbi.nlm.nih.gov/pubmed) using ‘parasite and economic loss and livestock and cattle and animal’ as search terms. The research period ranged from 1980 until August 2017, yields 1582 publications. We did not limit our search to a specific region or country and all possible economically important cattle parasites and diseases caused by them were considered in this review. At least one published article for each economic calculation methods/models was included in this study. The literature was screened having title and abstracts related to parasite economic loss and specific methods/models for calculation of these losses in cattle.
Research articles were not included in the study that did not mention cattle parasite economic losses. Moreover, the articles that mentioned economic losses but did not describe specific method/models for calculation of these losses, were also not considered. Out of these, 47 concerned papers studying economic losses caused by parasitic diseases of cattle with specific calculation methods/models were considered. These articles were classified into productivity losses (16 articles), financial losses (38 articles) and seven articles mentioned both productivity and financial losses.
Individual animal economic loss
We calculated the individual animal economic loss for each type of parasitic infections from the literature that mentioned the losses on the base of the herd and a total number of sample/animals studied. Then the per animal average quantity of decrease in production, percentage economic and financial account losses were calculated without any other classification on the basis of types of parasitic infestation mentioned in Tables 1–4.
Table 1. Quantity of production (milk) losses due to parasitic infection in cattle
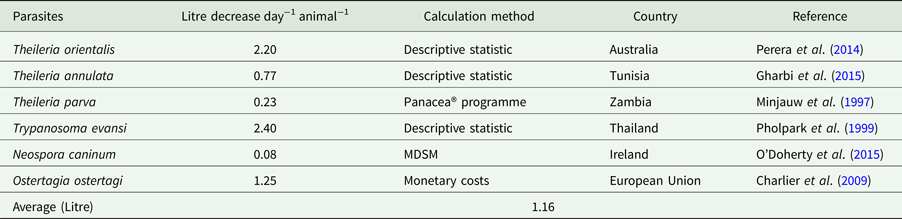
Table 2. Percentage of visceral organ condemned due to parasitic infection
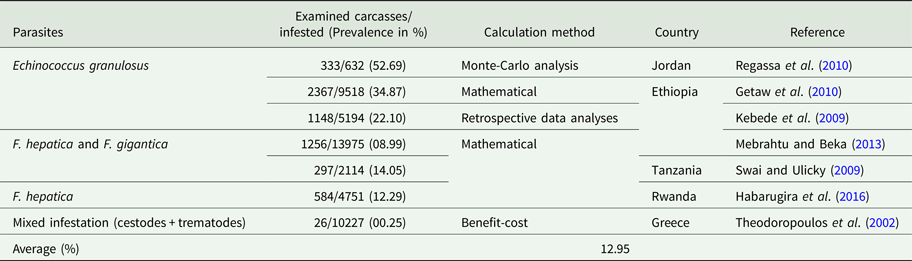
Table 3. Unit loss calculated due to parasitic infection in cattle
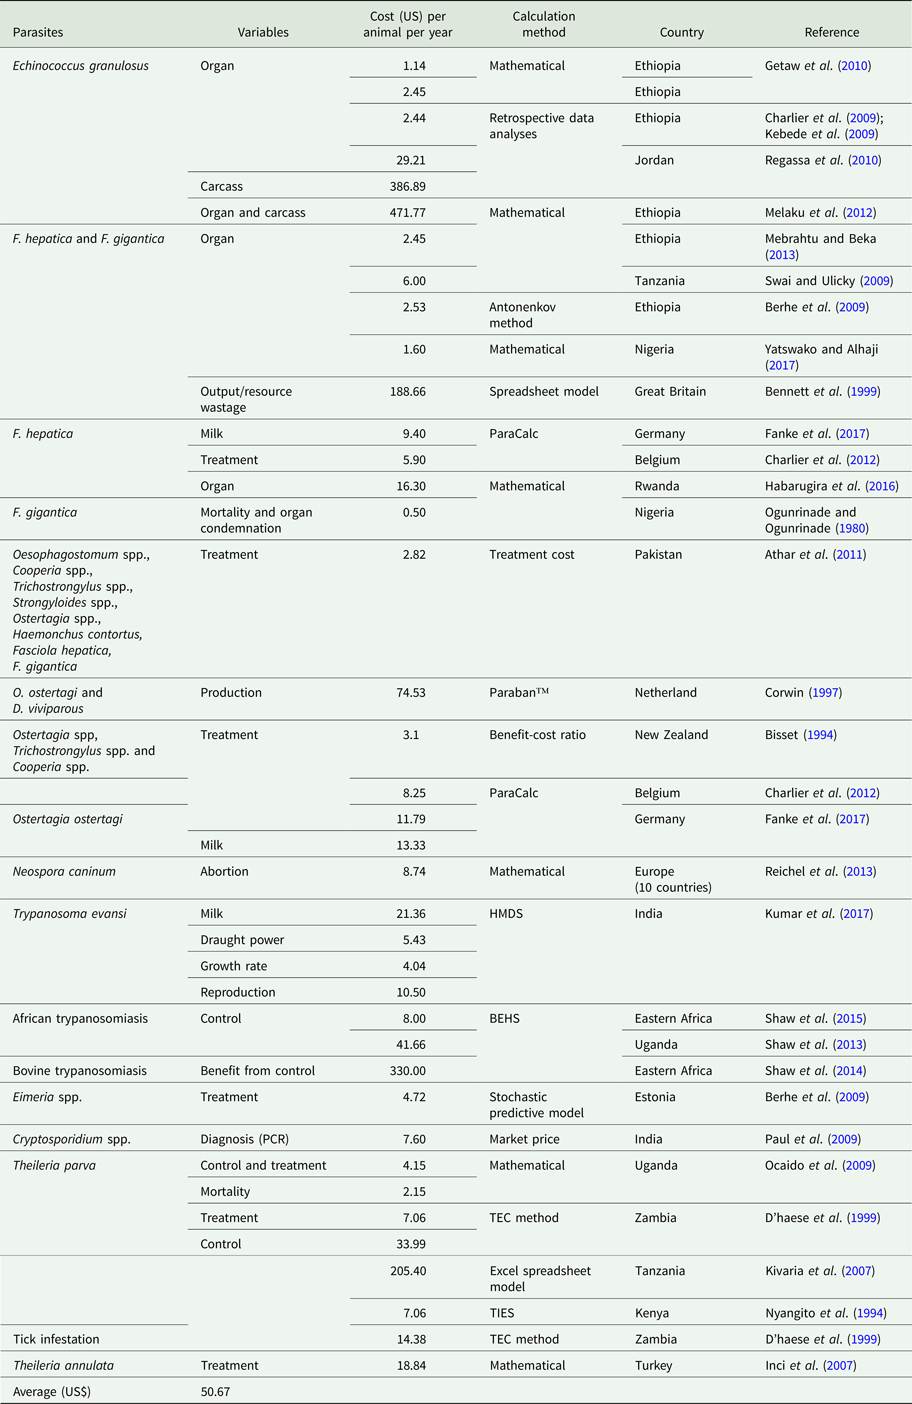
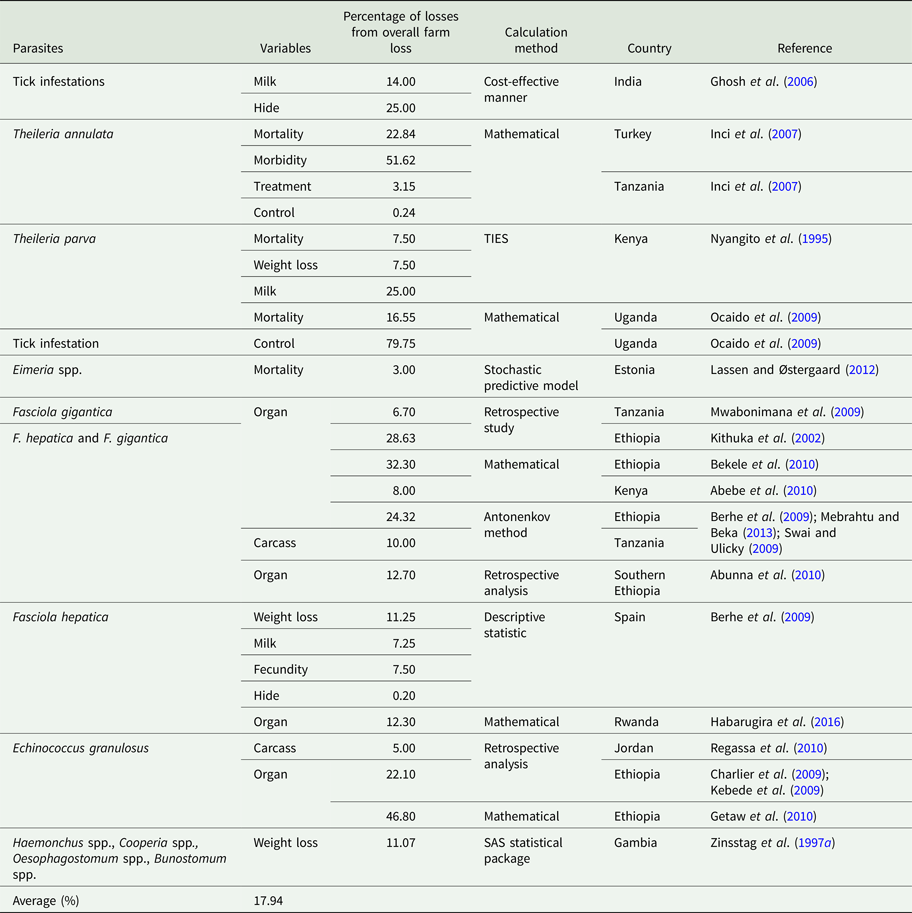
Table 4. Percentage parasitic economic losses from total farm loss
Methods/models for calculations of parasitic economic losses
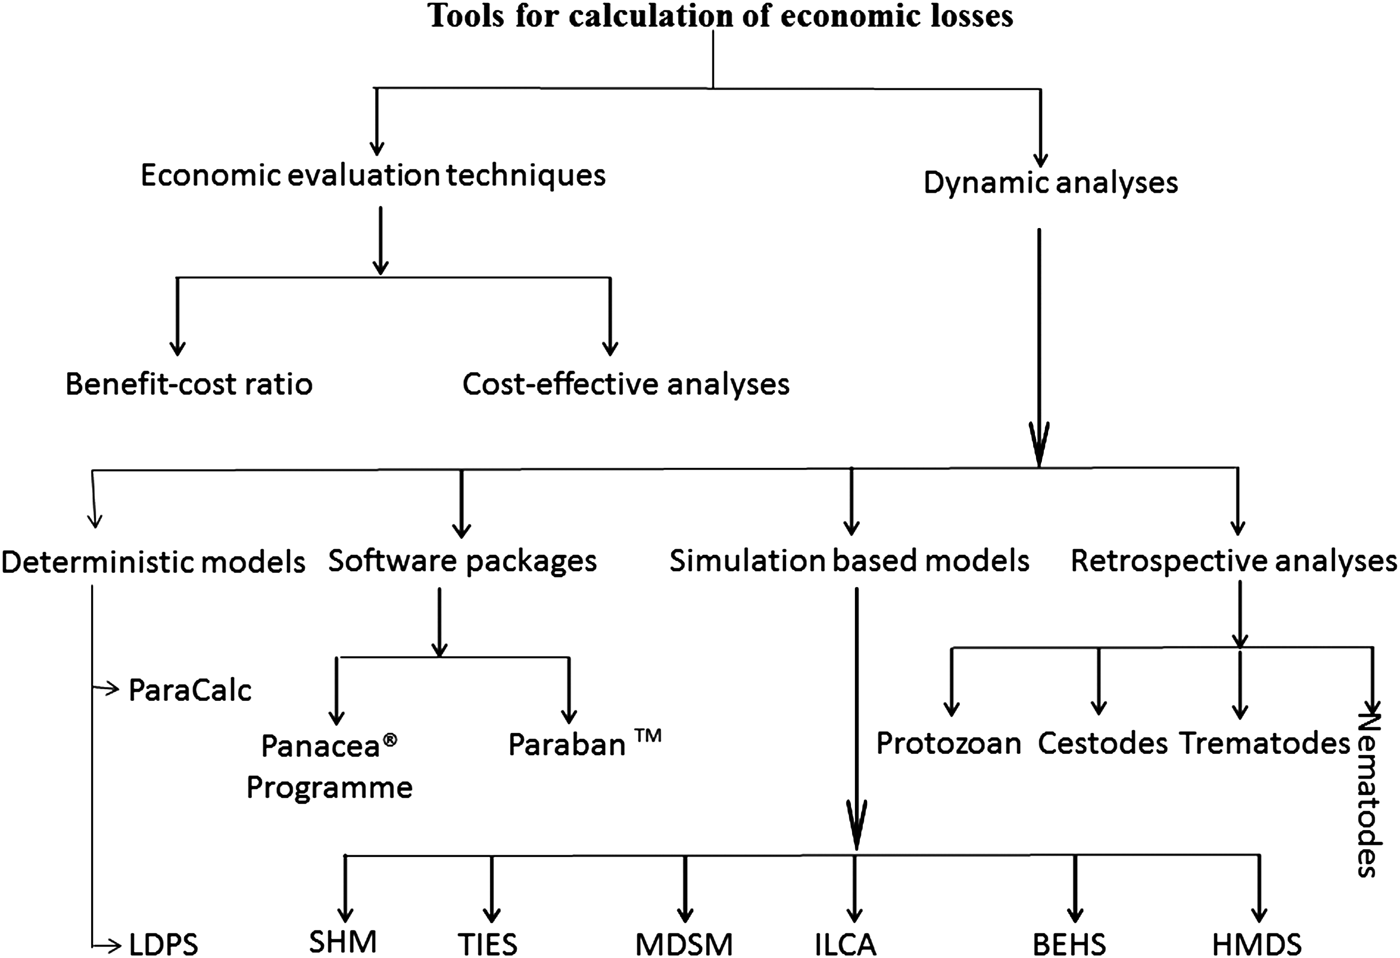
As shown in Fig. 1, in different conducted studies, authors used various methods to estimate economic losses caused by cattle parasites. Methods/models for economic loss calculation are classified into two major classes including, economic evaluation techniques and dynamic analyses. Each classification is subdivided according to the calculation method. Economic evaluation techniques include benefit-cost ratio and cost-effective analyses. While, the dynamic analysis includes software packages, simulation-based models and retrospective study/mathematical calculation. In this study, we described the basic principles and input values of each tool for the analyses of parasitic economic losses, further details can be gathered from provided reference literature.

Fig. 1. Summary of methods/models used for calculation of economic losses. Here ILDPS stands for Livestock Development Planning System, TIES: Technology Impact Evaluation System, MDSM: Moorepark Dairy System Model, ILCA'S: International Livestock Centre for Africa, BEHS: Bio-economic herd simulation model, SHM: SimHerd model and HMDS: hybrid model of deterministic and stochastic.
Results
Calculation methods/models
The major class of parasitic economic loss calculation methods/models include economic evaluation techniques and dynamic analyses. Their further classifications are mentioned below.
Economic evaluation techniques/analytical tools
For the analysis, the required data (income from production increment and cost of disease) were entered for these method/models in a Microsoft Excel sheet and formula was used for calculation and descriptive analyses of parasite economic losses using STATA and SSPS statistical softwares (Berhe et al., Reference Berhe, Berhane and Tadesse2009; Ali et al., Reference Ali, Saeed, Rashid, Ijaz, Akbar, Rashid and Ashraf2017). This analysis includes (A) benefit-cost ratio (McLeod, Reference McLeod1995; Theodoropoulos et al., Reference Theodoropoulos, Theodoropoulou, Petrakos, Kantzoura and Kostopoulos2002) and (B) cost-effective manner that is based on probabilities (Ghosh et al., Reference Ghosh, Azhahianambi and de la Fuente2006). Benefit-cost ratio translates all benefits and costs into monetary values including non-marketable products. While cost-effective manner identifies the most cost-effective option for achieving a set of pre-defined objectives. This means that meeting the same level of the objective with the lowest present value in the form of investment (http://www.undp.org/content/dam/rbas/doc/Energy%20and%20Environment/Arab_Water_Gov_Report/Arab_Water_Report_AWR_Annex%20I.pdf).
Benefit-cost ratio
The benefit-cost ratio has been used to estimate losses induced by parasites. Using MS-Excel program, estimated cost/loss due to treatment, prevention and production of livestock for largely responsible parasites was determined (McLeod, Reference McLeod1995). During the analysis of benefit-cost ratio, costs and benefits are quantified to know that a project/farm is either in benefit or loss. If its value is higher than 1 then the project is in benefit and if it is lower than 1, then it will be in loss. Generally, for any project, benefit-cost ratio is calculated by subtracting de-benefits (losses), maintenance and operating costs from total estimated benefit and is divided by subtracting salvage cost (protection) from initial investment to obtain a ratio. For animal herd, it is calculated by subtracting cost on production (anthelmintic, service charges) from estimated production divided by actual production. Briefly, income from production increment is divided by on its cost upon parasitic treatment and compare the ratio with the non-treated control group animal to obtain the parasitic economic loss as already calculated by Ali et al. (Reference Ali, Saeed, Rashid, Ijaz, Akbar, Rashid and Ashraf2017) and Rushton (Reference Rushton2009) for the gastrointestinal parasites of cattle. This ratio was first introduced in 1848 by Alfred Marshall and it was used by Bisset (Reference Bisset1994) for calculation of losses due to helminths (Bisset, Reference Bisset1994). The project/farm is in a loss if the cost of production, treatment, control and maintenance are far exceeded from benefit, obtained by marketable products (milk, hide, organs, carcass) in parasitized animals (Theodoropoulos et al., Reference Theodoropoulos, Theodoropoulou, Petrakos, Kantzoura and Kostopoulos2002).
Cost-effectiveness analysis
This is a kind of approach where benefits are estimated with minimum cost invested to control parasitic diseases. This approach has been used to assess the control of ticks through vaccination (Ghosh et al., Reference Ghosh, Azhahianambi and de la Fuente2006). The cost-effectiveness ratio is estimated as follows:
 $$\hbox{Cost-Effectiveness Ratio = Total Cost/Units of Effectiveness}$$
(Cellini and Kee, Reference Cellini and Kee2010).
The Units of Effectiveness are the expected outcomes.
Dynamic analysis
Methods included in this analysis are, (A) deterministic models, (B) software packages, (C) simulation-based models and (D) retrospective analysis. Each was further subdivided into specific methods.
Deterministic models
The mathematical model outcomes are precisely determined through known relationships among states and events, without any room for random variation. In such models, a given input will always produce the same output. It includes (i) ParaCalc (Charlier et al., Reference Charlier, Van der Voort, Hogeveen and Vercruysse2012) and (ii) International Livestock Development Planning System (ILDPS2) tool (Lalonde and Sukigara, Reference Lalonde and Sukigara1997).
ParaCalc
Charlier et al. (Reference Charlier, Van der Voort, Hogeveen and Vercruysse2012) have developed a spreadsheet model ParaCalc (http://www.paracalc.be/index/intro) for veterinarians to evaluate herd-treatment measures, to estimate treatment cost and economic losses associated with helminths on dairy farms. Parasitic infection status of the herd, economic information of farm, estimates of losses and expenditure of herds due to parasites can be estimated with ParaCalc. This tool has been used to estimate economic losses due to nematodes and Fasciola hepatica in young and adult cattle. With this tool, serological values of diagnostic tests are entered to know parasitic infection status followed by herd characteristics, anthelmintic treatment, production effect and their cost are the input parameters to estimate infection effect on production and their costs. Total cost is calculated by adding losses in production and cost of anthelmintic treatments. The loss in production output is calculated by multiplication of the number of animals at risk, the prevalence of infection, the magnitude of loss in production outputs and monetary values of production outputs (Fanke et al., Reference Fanke, Charlier, Steppin, von Samson-Himmelstjerna, Vercruysse and Demeler2017).
International livestock development planning system
This is a spread-sheet-based tool that helps planners to simulate animal herd structure and growth. These simulations are based on a number of variables, parameters and equation sets. Here parameters can be changed but variables and equation are constant. This version consists of eight sheets; six visible (Welcome, Labels, Parameters, Resources, Results and Sensitivity) and two hidden (Calculations and Macros) sheets. In each sheet, one has to provide animal systems and inputs according to the tool requirement to get results with an accuracy of 5% variation in parameters (Lalonde and Sukigara, Reference Lalonde and Sukigara1997).
Software packages
Software packages consist of (i) PANACEA® programme (Minjauw et al., Reference Minjauw, Otte, James, De Castro and Sinyangwe1997) and (ii) PARABAN™ (Corwin, Reference Corwin1997; Smith, Reference Smith1997).
PANACEA® programme
The Panacea® software was developed by VEERU (The University of Reading) in collaboration with Pan Livestock Services, UK (http://www.veeru.rdg.ac.uk/). This programme was used to study the data of reproduction, milk and growth rate. The software is based on descriptive statistics and multivariate analysis using multiple least-squares regression. The authors used it to study the economics of immunization effect on cattle affected by ticks and tick-borne diseases control programmes. Five groups of tick treatment collections were analysed using Chi-Square distribution for differences in calving rates. The significance of milk production and body weights of these groups were analysed by descriptive statistics and t-distribution for East Coast Fever (Minjauw et al., Reference Minjauw, Otte, James, De Castro and Sinyangwe1997).
PARABAN™
This is a computer-generated modelling programme that was used to estimate four parameters: mean worm burden, pasture contamination, faecal egg counts and arrested worm burden, or hibernation state of Ostertagia ostertagi (Corwin, Reference Corwin1997; Smith, Reference Smith1997).
Simulation-based models
This includes (i) International Livestock Centre for Africa (ILCA) herd simulation model (Itty, Reference Itty1991), (ii) Technology Impact Evaluation System (TIES) (Nyangito et al., Reference Nyangito, Richardson, Mukhebi, Mundy, Zimmel, Namken and Perry1994, Reference Nyangito, Richardson, Mukhebi, Mundy, Zimmel and Namken1995), (iii) Moorepark Dairy System Model (MDSM) (O'Doherty et al., Reference O'Doherty, Sayers, O'Grady and Shalloo2015). (iv) Bio-economic herd simulation (BEHS) model for trypanosomiasis (Shaw et al., Reference Shaw, Torr, Waiswa, Cecchi, Wint, Mattioli and Robinson2013, Reference Shaw, Cecchi, Wint, Mattioli and Robinson2014), (v) Hybrid model of deterministic and stochastic (HMDS) (Kumar et al., Reference Kumar, Jain, Kumar, Sethi, Kumar and Tripathi2017) and (vi) SimHerd model (Budke et al., Reference Budke, Deplazes and Torgerson2006; Calvo-Artavia et al., Reference Calvo-Artavia, Nielsen and Alban2013).
ILCA herd simulation model
This model was developed by the ILCA. It is based on dynamic herd simulation model. It is a deterministic model driven by certain users, supplied inputs of biological parameters (reproduction, milk yield, live-weight and mortality rates) to compute herd structure and outputs for 10 years period. This model analyses the interventions of technical and economic impacts, such as disease supplementary feeding and disease control through a change in herd productivity (Itty, Reference Itty1991).
Technology impact evaluation system
This is a computerized simulation model that consists of equations accounting for annual production, financial management, marketing and household assumption of small-holder farmers. It uses the year as time step and simulates 10 years recursively, each year by starting the end debt, livestock herd, household information and assets for the previous year. These 10 years planning is repeated for 100 iterations to generate parameters for the probability distribution of output variables as a benefit-cost ratio, net present value and internal rate of return. The model incorporates crop and livestock productions. The annual economic activities consist of calculation of fixed and variable costs, machinery depreciation and replacement, debt payment, off-farm income, household consumption, marketing and total receipts, net cash farm income, cash flow and balance sheet value. This model uses a pseudo-random generator for market risk and production faced by producers. The detail of this model can be seen in the reference paper of Nyangito et al. (Reference Nyangito, Richardson, Mukhebi, Mundy, Zimmel and Namken1995). Economic impact evaluation of East Cost Fever (ECF) uses TIES as a two-step process; firstly, data for current ECF control strategies were collected from farmers and supplemented by secondary data sources, secondly, it simulated the data of farm with appropriate changes for ECF infection and treatment method (ITM). It is accomplished by changing the input variable values that include the cost of ITM delivery, acaricide cost, calving rate and ECF mortality rate (Nyangito et al., Reference Nyangito, Richardson, Mukhebi, Mundy, Zimmel, Namken and Perry1994, Reference Nyangito, Richardson, Mukhebi, Mundy, Zimmel and Namken1995).
Moorepark dairy system model
Production indicators (milk, meat and number of calving) are incorporated into this model to simulate the effect of macro-parasites on farm's net profitability. The model integrates animal's inventory and valuation, feed requirement, milk production, land and labour utilization and economic analysis. For cost analysis, variable costs (fertilizer, contractor charges, medical and veterinarian, artificial insemination (AI), reseeding and silage), fixed cost (running costs, machinery maintenance, farm maintenance, vehicle charges, telephone, electricity and insurance) and all farm receipts (milk, calf and culled animals) were based on calculation of N. caninum. Cost of each variable was fixed and put into this model for its cost estimation (O'Doherty et al., Reference O'Doherty, Sayers, O'Grady and Shalloo2015).
BEHS model
This model was used for population dynamics, and analysing and comparing livestock production system based on simulation. For population dynamics, inputs values are starting population, baseline birth rate and baseline age and sex. While for a production system, values are draught powder, meat, milk and trypanocides for with or without disease scenarios. The basic structure of model consists of herd input parameters (mortality, calving rate, milk yield and number of draught animals). But income calculation values are milk, draught power, animals sold, slaughtered or exported; minus value of animals imported, plus the change in herd value, minus input costs that are briefly described in Fig. 1 of Shaw et al. (Reference Shaw, Cecchi, Wint, Mattioli and Robinson2014).
Hybrid of deterministic and stochastic model
This model is also based on simulation. An input of this model consists of baseline (number of animals at risk, clinically infected animals, female population, calving interval and mortality), general (milk, meat, live animals, charges to obtain data) and impact on productivity (prevalence, active infection, abortion rate, reduction in growth, lactation and weight loss) data. Input values of baseline constitute deterministic part but the impact on production is treated stochastically. Uncertainties in parameters were defined by triangular, uniform and beta-distribution and handled by simulation models (Kumar et al., Reference Kumar, Jain, Kumar, Sethi, Kumar and Tripathi2017).
SimHerd model
This is the model that was used to estimate annual losses due to Eimeria infection in dairy herds. The SimHerd IV model (Kristensen et al., Reference Kristensen, Østergaard, Krogh and Enevoldsen2008; Lassen and Østergaard, Reference Lassen and Østergaard2012) is based on the Monte Carlo simulation technique. This model was developed and was used to estimate changes in the production in 100 dairy herds during 10 years duration. Monte Carlo simulation technique is based on probability where input values are uniformly distributed (percentage error and error distribution pattern, potential costs and estimated duration). The treatment cost and income changes have been estimated for calves, heifers and cows with respect to their numbers, milk production, slaughtering, inseminations and culling (Lassen and Østergaard, Reference Lassen and Østergaard2012). Estimation of losses due to echinococcosis was performed by Monte Carlo simulation technique. Proportions of each parameter were taken from previous studies and spread-sheet models were constructed to estimate economic losses due to echinococcosis (Budke et al., Reference Budke, Deplazes and Torgerson2006; Calvo-Artavia et al., Reference Calvo-Artavia, Nielsen and Alban2013).
Retrospective analysis (cost evaluation mathematical formula)
For this analysis, parasite economic related data from slaughter-houses and research centres’ records were taken. These data were put into cost evaluation mathematical formula (CEMF) to calculate total economic losses caused by parasites. CEMF contains different factors for each parasite phylum (i) protozoa, (ii) cestode, (iii) trematode and (iv) nematodes.
Economic calculation for protozoan infestation
Economically important protozoan parasitic diseases are TBDs (tick-borne diseases), coccidiosis, neosporosis, trypanosomiasis and cryptosporidiosis. Their economic losses were estimated by using formulas, where different factors were multiplied and summed up according to studied parameters.
The authors calculated losses due to TBDs and control costs (acaricides and labour, cost of treatment and prevention, credit and insurance, impact of different drugs on the public health and environment), treatment-related consequences (acaricides side effects on the treated animals, the humans and the environment).
Each factor was multiplied by herd level price of products and summed up all considered factors to obtain the total cost of the disease (D'haese et al., Reference D'haese, Penne and Elyn1999; Inci et al., Reference Inci, Ica, Yildirim, Vatansever, Cakmak, Albasan, Cam, Atasever, Sariozkan and Duzlu2007; Kivaria et al., Reference Kivaria, Ruheta, Mkonyi and Malamsha2007; Ocaido et al., Reference Ocaido, Muwazi and Opuda2009).
 $$C = M_{{\rm mp}} + B_{{\rm bp}} + A_{{\rm ap}} + V_{{\rm vp}} + T_{{\rm tp}}$$
where C = direct economic loss, M and m = Milk yield decrease, B and b = meat production losses, A and a = acaricides costs V and v = immunization costs, T and t = cost of treatment and p = herd level price of products/service.
Total abortion costs due to Neospora caninum infection was estimated by taking an average number of expected abortions multiplied by the cost of a single abortion. Average expected number of N. caninum abortion NcA (n) was calculated by a total number of cows at risk (n (c + h) × PR) multiplied with median sero-prevalence (SP), abortion risk (rA) and odds of abortion increased by N. caninum (NcRR). Annual pregnancy rate (PR) was taken 75% of all breeding-age female beef (c) and 90% of all dairy cattle (h) (Reichel et al., Reference Reichel, Ayanegui-Alcérreca, Gondim and Ellis2013).
 $${\rm NcA (}n{\rm )} = (n(c + h) \times {\rm PR}) \times {\rm SP} \times {\rm rA} \times {\rm NcRR}$$
 $${\rm Total}\,{\rm cost} = {\rm Cost}\,{\rm of}\,{\rm single}\,{\rm abortion} \times {\rm NcA(}n{\rm )}$$
Economic calculation for cestode infestation
The most economically important genus is Echinococcus in class cestoda due to its zoonotic importance and the number of available literature. The losses in echinococcosis are attributed due to organ condemnation (lung, heart, liver, spleen and kidney) and weight loss of carcass (Benner et al., Reference Benner, Carabin, Sánchez-Serrano, Budke and Carmena2010; Melaku et al., Reference Melaku, Lukas and Bogale2012). The calculation of the loss due to this infestation is by using a formula which consists of two parts: organ condemnation and carcass weight loss (CWL). For a total loss of echinococcosis, the authors summed up the loss of organ condemnation (lung and/or liver) and CWL.
(a) Losses of organs’ condemnation (LOC) were estimated by a total number of cattle slaughtered per annum, multiplied by prevalence and cost for each condemned organ (lung, heart, liver, spleen and kidney). Then each organ values were summed up to obtain LOC (Kebede et al., Reference Kebede, Hagos, Girma and Lobago2009; Getaw et al., Reference Getaw, Beyene, Ayana, Megersa and Abunna2010; Regassa et al., Reference Regassa, Molla and Bekele2010).
Where N ps = number of positive animals, P lu = prevalence in lung, P li = prevalence in liver, P he = prevalence in heart and P ki = prevalence in kidney. Similarly, C = cost of each organ. $$\eqalign{{\rm LOC} & = (N_{{\rm ps}} \times P_{{\rm lu}} \times C_{{\rm lu}}) + (N_{{\rm ps}} \times P_{{\rm li}} \times C_{{\rm li}}) + \left(N_{{\rm ps}} \times P_{{\rm he}}\right. \cr & \quad \left. \times C_{{\rm he}}\right) + (N_{{\rm ps}} \times P_{{\rm ki}} \times C_{{\rm ki}})}$$
(b) Infected and normally slaughtered animal weight was compared with take CWL of infected ones. It was calculated by an average number of cattle slaughtered per annum (ANCS) multiplied by the prevalence of hydatidosis (PH), the current average price of 1 kg beef (CAPB), estimated carcass loss of 5% and average carcass weight (126 kg) (Regassa et al., Reference Regassa, Molla and Bekele2010).

 $$\eqalign{{\rm CWL} & = {\rm ANCS}\, \times \,{\rm PH}\, \times \,{\rm CAPB}\, \times \,{\rm 5\% }\, \cr & \quad \times \,126 \,{\rm kg}\,({\rm Kebede}\,et \,al., \,2009).}$$
Economic calculation for trematode infestation
The most economically important trematodes of cattle belong to the genus Fasciola. It causes losses in terms of liver condemnation and carcass weight reduction and mortality in severe cases. Some authors estimated the losses using Antonenkov formula (Ogunrinade and Ogunrinade, Reference Ogunrinade and Ogunrinade1980; Berhe et al., Reference Berhe, Berhane and Tadesse2009).
(a) Losses due to liver condemnation were estimated by considering ANCS per annum, multiplied by the average market price of liver and percentage of liver condemnation due to fascioliasis (Habarugira et al., Reference Habarugira, Mbasinga, Mushonga, Chitura, Kandiwa and Ojok2016; Yatswako and Alhaji, Reference Yatswako and Alhaji2017).
(b) Reduction in meat production was estimated by ANCS per annum, multiplied by CWL in individual animal, average market price of 1 kg meat and prevalence rate of the disease (Ogunrinade and Ogunrinade, Reference Ogunrinade and Ogunrinade1980; Bennett et al., Reference Bennett, Christiansen and Clifton-Hadley1999; Kithuka et al., Reference Kithuka, Maingi, Njeruh and Ombui2002; Habarugira et al., Reference Habarugira, Mbasinga, Mushonga, Chitura, Kandiwa and Ojok2016).
Economic calculation for nematode infestation
Charlier et al. (Reference Charlier, Höglund, von Samson-Himmelstjerna, Dorny and Vercruysse2009) estimated the economic impact of gastrointestinal tract (GIT) nematode; Ostertagia ostertagi. They summed up the cost for decrease production (milk and meat) and reproduction, expenses on diagnosis, medication and risk taken in spending money (prevention) to take anticipatory benefit from it.
Economic losses from parasitic infestation
Economic losses due to parasites are classified in the form of a decrease in production (quantity or percentage) and financial losses (production, treatment, disease and tick control, and mortality). Losses were calculated in the form of a quantitative decrease in production and expenditures spent to control the disease. These losses were compared with herd and number of studied animals or local area according to the available literature. Economically important cattle parasitic diseases are caused by protozoa (TBDs, coccidiosis, trypanosomiasis and cryptosporidiosis), nematodes (spp. of Oesophagostomum, Cooperia, Trichostrongylus, Strongyloides, Ostertagia and Haemonchus), cestodes (Echinococcus granulosus), trematodes (F. hepatica and F. gigantica) and mixed parasitic infections. These parasites are economically important in cattle because of lowering production (milk, meat and reproduction), damaging by-products (hides) and affecting health (treatment, control and mortality) of animals. Tick control costs also affect the farm's profitability. Mainly, GIT parasites share host ingested nutrients and obtain protection, while others related to reproduction cause infertility and abortion. Moreover, TBDs affect host health condition and lysis of RBCs leading to anaemia. Parasites reside in organs (lung, liver, kidney, spleen and heart) which may lead to condemnation of affected organs. Cost and percentage loss from the total loss was performed to calculate a unit economic loss due to parasites for decreased production and condemnation rate of organs. The average decrease in milk production was estimated to be 1.16 L animal−1 day−1, while condemnation rate of organs was 12.95%. Moreover, financial and percentage losses were estimated to be US$ 50.67 animal−1 year−1 and 17.94% from total farm loss, respectively as shown in Tables 1–4.
Decreased quantity of production
Production losses include depreciation of milk, carcass and reproduction, and by-product (hides). Milk is the net profit at every dairy cattle farm. Cross-bred or improved genetic potential animals with normal health condition have better milk production than local breeds and clinically or sub-clinically infected ones (Belem et al., Reference Belem, Ouédraogo and Bessin2001). The losses are dependent on status (mild, moderate or severe) and the stage of parasitic infections (Ogunrinade and Ogunrinade, Reference Ogunrinade and Ogunrinade1980).
Protozoan infestations
The main cattle protozoan parasites are intestinal and blood, while hemoprotozoan parasites include intracellular and extracellular organisms. The extracellular parasite is trypanosoma, while intracellular parasites are Theileria spp., Babesia spp. The spp. of Theileria and Babesia are transmitted by several tick genera like Hyalomma, Ixodes, and Rhipicephalus. After transmission, the blood protozoan parasites damage immune cells and RBCs which may lead to decrease host immunity and anaemia. Therefore, they are the cause of losses due to lowered production, investment on control of the disease and deaths in animals (García-Sanmartín et al., Reference García-Sanmartín, Nagore, García-Pérez, Juste and Hurtado2006; Alim et al., Reference Alim, Das, Roy, Masuduzzaman, Sikder, Mahmudul, Hassan and Hossain2011).
In India, ticks and TBDs are the cause of decreased yield of milk up to 14%, loss of 3000 million units of hides per year and depreciation of hides up to 20 to 30%. The cattle population in India is estimated to be 16.5% of the World cattle population (Ghosh et al., Reference Ghosh, Azhahianambi and de la Fuente2006). In Kenya, immunization of cattle against ECF increased the weight gain by 5–10% and the milk yield by 25% (Nyangito et al., Reference Nyangito, Richardson, Mukhebi, Mundy, Zimmel and Namken1995). From acute and subclinical theileriosis caused by T. orientalis, reduction in milk yield was 288 ± 90.4 and 153 ± 95.9 L cattle−1 per 100 days from a herd of 662 dairy cattle in Australia, respectively (Perera et al., Reference Perera, Gasser, Firestone, Anderson, Malmo, Davis, Beggs and Jabbar2014). Trypanosomiasis caused by T. evansi decreased milk production which was recorded to be 6.6 from 9.0 L day−1 (2.4 L day−1 decrease) from 13 positive and 51 negative cattle, respectively at a Holstein Friesian farm in Thailand (Pholpark et al., Reference Pholpark, Pholpark, Polsar, Charoenchai, Paengpassa and Kashiwazaki1999). In Zambia, control of ticks by immunization and intensive tick control for T. parva infection increases milk yield by 0.09 to 0.28 L day−1 and weight gain from 32.04 to 53.84 g day−1 for suckler calves and 29.12 g day−1 for weaner calves from 89 cattle studied in a field trial (Minjauw et al., Reference Minjauw, Otte, James, De Castro and Sinyangwe1997). In north Tunisia, subclinical theileriosis decreased milk production of 0.77 kg cow−1 day−1 (Gharbi et al., Reference Gharbi, Rekik, Mabrouk, Hassni, Zroud, Mhadhbi, Sassi, Jedidi and Darghouth2015). A study conducted in Pakistan by our (Department of Parasitology, University of Veterinary and Animal Sciences, Lahore, Pakistan) department to evaluate the economic impact of theileriosis caused by Theileria annulata on a commercial Holstein Friesian dairy farm in the District of Ranjanpur, in the Province of Punjab. The overall total expenditure incurred due to theileriosis was US$ 74.98 per animal and it was 13.83% of total farm costs during the study period of 4 months. We found that theileriosis caused significant economic loss of US$ 18 743.76 on that Holstein Friesian dairy farm (Rashid et al., Reference Rashid, Haroon, Rashid, Khalid, Liaquat, Saghir, Wasim, Saher and Shahid2018).
The estimation costs due to Eimeria spp. in Estonia during a 6 months period, was estimated at a weight reduction of 0.11 and 0.18 kg day−1 in housed and pastured cattle, respectively. These parasites caused a total decrease of about 53 kg year−1 in a dairy herd of 100 cattle (Lassen and Østergaard, Reference Lassen and Østergaard2012). Neospora caninum induced a decrease of 0.5% total milk yield that tended to 27 kg cattle−1 annum−1 studied on a dairy herd of 100 cattle in Ireland (O'Doherty et al., Reference O'Doherty, Sayers, O'Grady and Shalloo2015).
Nematode infestation
Important nematodes of cattle belong to the genera are; Oesophagostomum, Cooperia, Trichostrongylus, Strongyloides, Ostertagia and Haemonchus. Gastrointestinal nematodes affect cattle health in the early stage of their lives by increasing first conception interval which may lead to delayed calving age from the standard period. Some authors demonstrated that control of nematodes had a negative effect on milk production and caused abortions (Zinsstag et al., Reference Zinsstag, Ankers, Dempfle, Njie, Kaufmann, Itty, Pfister and Pandey1997a; Reference Zinsstag, Ankers, Itty, Njie, Kaufmann, Pandey and Pfister1997b). In the European Union, control of nematodes increased milk production from 0.4 to 2.1 L cattle−1 day−1 (Charlier et al., Reference Charlier, Höglund, von Samson-Himmelstjerna, Dorny and Vercruysse2009). It was recorded that calving rates in bi-annual anthelmintic treated and non-treated cows were 52.2 and 43.6%, respectively, while abortion rates in the same cow groups were 6.7 and 1.5%, respectively. In a Gambian village, annual weight gain was estimated to 6.3, 9.4 and 17.5% for <1, 1–2 and 2–3 years age of cattle, respectively, under a bi-annual fenbendazole treatments in a 1046 animals of 26 private herds during 1989–1994 (Zinsstag et al., Reference Zinsstag, Ankers, Dempfle, Njie, Kaufmann, Itty, Pfister and Pandey1997a; Reference Zinsstag, Ankers, Itty, Njie, Kaufmann, Pandey and Pfister1997b).
Cestode infestation
Due to its zoonotic importance and organ condemnation at slaughterhouses, E. granulosus is the main economically important cestode species that affects cattle. Actually, in many countries, there is no meat inspection and estimation of organs losses. Losses due to echinococcosis include a decrease in weight gain, milk yield, fecundity and hide value which was estimated to be 2.5–20%, 2.5–12%, 3–12% and 0.2%, respectively (Cardona and Carmena, Reference Cardona and Carmena2013). Moreover, indirect losses due to echinococcosis were estimated to be 10.4% for decreased growth, fecundity and milk production, and 0.12% due to organ condemnation from total farm loss of US$ 20.19 million in Spain (Benner et al., Reference Benner, Carabin, Sánchez-Serrano, Budke and Carmena2010). The average organ condemnation rate was calculated 12.95% from current study as shown in Table 2.
Trematode infestation
The most economically important trematodes in cattle belongs to the genus Fasciola (F. hepatica and F. gigantica). These parasites cause economic losses due to liver condemnation in cattle. The migration of their immature flukes causes liver cirrhosis. Partial or total liver cirrhosis depends on the number of flukes and duration of onset (Ozer et al., Reference Ozer, Serin, Gumurdulu, Gur, Yilmaz and Boyacioglu2003; Marcos et al., Reference Marcos, Yi, Machicado, Andrade, Samalvides, Sánchez and Terashima2007). Liver represents approximately 2.5% of cattle carcass weight and affected liver is totally or partially condemned due to fascioliasis.
The CWL due to fascioliasis was estimated to be 10% at Tigray and Dire Dawa slaughter-houses in Ethiopia and Hai town slaughter-house in Tanzania with prevalence of 24.32, 8.99 and 14.05%, respectively (Berhe et al., Reference Berhe, Berhane and Tadesse2009; Swai and Ulicky, Reference Swai and Ulicky2009; Mebrahtu and Beka, Reference Mebrahtu and Beka2013).
Financial losses
The lowered production due to parasite infections is transformed into the cost. These losses are due to decrease in production, cost of treatments and prevention, the occurrence of abortions and mortalities as shown in Table 3.
Decreased production cost
Clinical and subclinical parasitic infections were the cause of decreased production. The values were represented in terms of costs.
Cost from protozoan
The losses due to TBDs in livestock industry were estimated to be US$ 91 million per annum production (meat losses and mortality) from a total Australian cattle population of 23.6 million in 1994 (http://www.fao.org/ag/AGP/AGPC/doc/Counprof/Australia/australia.htm) as already described (McLeod, Reference McLeod1995).
Median economic loss due to abortions by N. caninum was estimated to be US$ 1298.3 million per annum in ten countries (Netherlands, Spain, UK, Canada, Mexico, USA, Argentina, Brazil, Australia and New Zealand) out of 148.6 million dairy and beef cattle population (Reichel et al., Reference Reichel, Ayanegui-Alcérreca, Gondim and Ellis2013). Out of total population of cattle in India in 2013, 10.66% cattle endowed losses of US$ 200.42 due to T. evansi infection. These losses were due to a decrease in milk production growth rate and reproduction (Kumar et al., Reference Kumar, Jain, Kumar, Sethi, Kumar and Tripathi2017).
Cost from nematodes
In the Netherlands, production (weight gain, feed conversion, forage utilization, conception rate, calving interval, milk production and disease resistance) losses due to Ostertagia ostertagi and Dictyocaulus viviparus were estimated to be US$ 120 million per annum in a total cattle population of 1.61 million dairy cattle (http://www.nationsencyclopedia.com/economies/Europe/The-Netherlands-AGRICULTURE.html). From these losses, the share of cattle was more than calves (Corwin, Reference Corwin1997). In Germany, milk yield losses due to Ostertagia ostertagi infestation were estimated to be US$ 14.30 cow−1 year−1 (Fanke et al., Reference Fanke, Charlier, Steppin, von Samson-Himmelstjerna, Vercruysse and Demeler2017).
Cost from cestode
In Jordan, losses due to echinococcosis were estimated to be US$ 2190.13 million per annum in terms of decrease in weight gain, liver quality, hide value, milk yield and fecundity, (Budke et al., Reference Budke, Deplazes and Torgerson2006). In Hawassa Municipal abattoir, losses due to organs condemnation (lung, liver, spleen, heart and kidney) were US$ 9728.00 out of 632 slaughtered cattle having 333 infected organs and CWL was taken 5% on the basis of its prevalence and number of animals slaughtered during the year (Regassa et al., Reference Regassa, Molla and Bekele2010). Moreover, offal condemnation (direct losses), growth reduction and decrease in milk production and fecundity (indirect losses) were US$ 18.65 million per annum according to country data of Spanish Ministry of Agriculture, Fisheries and Food in 2005 (Benner et al., Reference Benner, Carabin, Sánchez-Serrano, Budke and Carmena2010). In Adama municipal abattoir and six other abattoirs in Northern Ethiopia, organ condemnation (lung, liver, kidney, heart and spleen) losses were US$ 5059.2 and US$ 2807.89 per annum having a prevalence of 46.8 and 22.1%, respectively from a number of 9,518 and 5,194 cattle slaughtered during a year (Kebede et al., Reference Kebede, Hagos, Girma and Lobago2009; Getaw et al., Reference Getaw, Beyene, Ayana, Megersa and Abunna2010). Carcass condemnation rate by Taenia saginata was 34.6% from infected parts of organs with a total loss of US$ 27092 from 1990 to 1993 out of 9501 cattle examined having a prevalence of 7.7% in Iran (Oryan et al., Reference Oryan, Moghaddar and Gaur1995) as shown in Table 2.
Cost from trematode
Fasciola spp. is liver parasites which induce losses due to liver condemnation. In Ethiopia (Dire Dawa Municipal Abattoir) and Tanzania (Hai District), liver condemnation losses were of US$ 3073.65 and 1780 per annum out of 13 975 and 2114 slaughtered cattle having 8.99% and 14.05% prevalence, respectively (Swai and Ulicky, Reference Swai and Ulicky2009; Mebrahtu and Beka, Reference Mebrahtu and Beka2013). While in Southern Ethiopia (Soddo municipal slaughterhouse), Tanzania (Arusha abattoir), Southern Ethiopia (Hawassa Municipal abattoir), North Ethiopia (Adwa Municipal slaughterhouse) and Kenya (38 district slaughterhouses), liver condemnation losses were US$ 4000; 18 000; 8312.5; 4674.2 and 200 000–300 000 per annum for a prevalence of 12.7; 6.7; 28.63; 32.3 and 8%, respectively (Kithuka et al., Reference Kithuka, Maingi, Njeruh and Ombui2002; Mwabonimana et al., Reference Mwabonimana, Kassuku, Ngowi, Mellau, Nonga and Karimuribo2009; Abebe et al., Reference Abebe, Abunna, Berhane, Mekuria, Megersa and Regassa2010; Abunna et al., Reference Abunna, Asfaw, Megersa and Regassa2010; Bekele et al., Reference Bekele, Tesfay and Getachew2010) as shown in Table 4. Moreover, Mekelle municipality slaughter-house of Tigray region in Ethiopia, liver condemnation and CWLs in 1090 animals were estimated to US$ 27 572.64 per annum corresponding to a prevalence of 24.32 and 10% from 4481 animals investigated after slaughtering (Berhe et al., Reference Berhe, Berhane and Tadesse2009). In Great Britain, output or resource wastage (milk, abortion, birth of weak calves and infertility) losses due to low, mild and high infestations by F. hepatica were US$ 10.5; 43.5 and 76.5 million per annum, respectively (1994), upon studying on occurrence of 30 endemic diseases of farm animals (Bennett et al., Reference Bennett, Christiansen and Clifton-Hadley1999). In Germany, F. hepatica infestation causes milk yield decrease, repeated AI and prolong calving interval losses that were estimated to US$ 8.53; 10.87 and 10.09 cow−1 year−1, respectively (Fanke et al., Reference Fanke, Charlier, Steppin, von Samson-Himmelstjerna, Vercruysse and Demeler2017). In Rwanda (Saban-Nyabugogo abattoir), liver condemnation rate was 12.3% corresponding to a loss of US$ 8932.40 from 4751 slaughtered cattle (Habarugira et al., Reference Habarugira, Mbasinga, Mushonga, Chitura, Kandiwa and Ojok2016). In five municipal abattoirs of North-central Nigeria, there condemned 48 552 livers leading to US$ 776 832 loss during a period of 10 years study (Yatswako and Alhaji, Reference Yatswako and Alhaji2017).
Mixed parasitic infestations cost
In Belgian dairy cattle the losses due to mixed infections (nematodes and F. hepatica) for delayed puberty, milk yield losses, increased calving interval and repeated inseminations were estimated to US$ 1.43 day−1; 0.15 kg−1; 0.85 day−1 and 32.94 insemination−1, respectively (Charlier et al., Reference Charlier, Van der Voort, Hogeveen and Vercruysse2012). While in Greece, organs condemnation (liver, lung, rumen, small intestine, muscles) losses in cattle, sheep, goats and swine were estimated to US$ 303.68 and a prevalence of 0.26% from 10 227 slaughtered animals due to hydatidosis, F. hepatica, Dicrocoelium dendriticum, Paramphistomum spp. and Moniezia spp. (Theodoropoulos et al., Reference Theodoropoulos, Theodoropoulou, Petrakos, Kantzoura and Kostopoulos2002).
Disease treatment and prevention cost
Medical care that can be provided to the animals after the onset of infection is treatment; its cost is encountered in treatment cost. Taking preventive measures against any disease before its onset, its associated investment is called control cost.
Protozoan cost
The investment for treatment and control of protozoan diseases, their complications and labour are encountered in their respective cost. Control cost of T. parva was estimated to US$ 205.40 cattle−1 annum−1 in Tanzanian Taurine breed and their crossbred (Kivaria et al., Reference Kivaria, Ruheta, Mkonyi and Malamsha2007). In Turkey (Cappadocia region), treatment and control cost of T. annulata was estimated to 3.15 and 0.24%, respectively, leading to total losses of US$ 598, 133 (0.6million) for 2 years (Inci et al., Reference Inci, Ica, Yildirim, Vatansever, Cakmak, Albasan, Cam, Atasever, Sariozkan and Duzlu2007). While in Zambia, treatment and prevention costs of T. parva were estimated to US$ 7.06 and 33.99 cattle−1 annum−1, respectively (D'haese et al., Reference D'haese, Penne and Elyn1999). In Kenya, costs of acaricide application were estimated to US$ 274 and 48 head−1 annum−1 for small and large farms, respectively (Nyangito et al.,, Reference Nyangito, Richardson, Mukhebi, Mundy, Zimmel, Namken and Perry1994). In Uganda (Lake Mburo National Park), total economic costs (prevention, treatment and mortality) due to TTBIs were estimated to US$ 308 144 per annum in cattle, they represent 73.8% (ranches), 85.6% (pastoral) of total disease control cost with mean of US$ 4.15 ± 0.38 animal−1 year−1 (Ocaido et al., Reference Ocaido, Muwazi and Opuda2009). Mean metaphylactic treatment cost for coccidiosis was US$ 4.88 per calf per year. After treatment, the benefit was US$ 8284.89 herd−1 year−1 in Estonian dairy herd (Lassen and Østergaard, Reference Lassen and Østergaard2012).
In India, reagent costs (chemicals, reagents and kits) for Cryptosporidium diagnosis by polymerase chain reaction (PCR), DFSS (direct faecal smear staining), NSSS (normal saline sedimentation staining) and SFSS (Sheather's flotation sedimentation staining) tests were US$ 7.60; 0.14; 0.15 and 0.32 per sample, respectively (Paul et al., Reference Paul, Chandra, Tewari, Banerjee, Ray, Boral and Rao2009). Control and elimination strategies of bovine trypanosomiasis were performed in Intergovernmental Authority on Development (IGAD) region (Ethiopia, Kenya, Somalia, South Sudan, Sudan and Uganda). Control cost of riverine and Savannah tsetse flies for prophylaxis, acaricides for controlling ticks, targets and aerial spray were US$ 8.0 cattle−1, 0.07 cattle−1, 629 km−2 and 161 km−2, per year, respectively. Moreover, field costs of main techniques for elimination by insecticide-treated cattle, aerial spray, targets and sterile insect were US$ 105; 483; 881 and 1748 km−2, respectively (Shaw et al., Reference Shaw, Torr, Waiswa, Cecchi, Wint, Mattioli and Robinson2013, Reference Shaw, Wint, Cecchi, Torr, Mattioli and Robinson2015). Benefits of trypanosomiasis control in these above regions amounts to US$ 2.5 billion with an average of US$ 3300 km−2 in tsetse infected areas (Shaw et al., Reference Shaw, Cecchi, Wint, Mattioli and Robinson2014).
Nematode cost
In Belgium, nematode treatment cost was US$ 3.66 and 12.20 animal−1 annum−1 for young and adult dairy cattle, respectively (Charlier et al., Reference Charlier, Van der Voort, Hogeveen and Vercruysse2012). While in Pakistan, nematodes (Oesophagostomum spp., Cooperia spp., Trichostrongylus spp., Strongyloides spp., Ostertagia spp. and Haemonchus placei) treatment with oxyclozanide cost was US$ 0.47 dose−1 (Athar et al., Reference Athar, Khan, Sajid and Khan2011). But in Germany, Ostertagia ostertagi treatment cost was US$ 10.73 cow−1 year−1 (Fanke et al., Reference Fanke, Charlier, Steppin, von Samson-Himmelstjerna, Vercruysse and Demeler2017).
Trematode cost
The treatment cost of F. hepatica in Belgium dairy farm was US$ 2.44 and 9.76 for young and adult dairy cattle, respectively (Charlier et al., Reference Charlier, Van der Voort, Hogeveen and Vercruysse2012).
Mixed infections cost
In New Zealand, cattle anthelmintic control cost was US$ 27.9 million year−1 for a total cattle population of 9 million (http://www.stats.govt.nz/browse_for_stats/environment/environmental-reporting-series/environmental-indicators/Home/Land/livestock-numbers.aspx). As the estimated output of dairy products was US$ 3382 million year−1 (Bisset, Reference Bisset1994). Cost of anthelmintic was US$ 8.57 and 0.94 head−1 annum−1 for small and large farms in Kenya, respectively (Nyangito et al., Reference Nyangito, Richardson, Mukhebi, Mundy, Zimmel, Namken and Perry1994).
Loss from mortality
Mostly, mortality due parasitic infections is caused by TBDs that were estimated to 11.6 ± 1.7 and 21.5 ± 5% with per head economic loss of US$ 2.15 in Uganda (Ocaido et al., Reference Ocaido, Muwazi and Opuda2009) and 22.84% from total cost of US$ 598 133 in Turkey (Inci et al., Reference Inci, Ica, Yildirim, Vatansever, Cakmak, Albasan, Cam, Atasever, Sariozkan and Duzlu2007). Out of 22% total cattle mortality, ECF (Taurine and cross-bred cattle) share of deceased was 70% in Tanzania (District of Dar es Salaam) (Kivaria et al., Reference Kivaria, Ruheta, Mkonyi and Malamsha2007). Estimated cattle calf mortality due to coccidiosis was 3% in an Estonian dairy herd of 100 cattle (Lassen and Østergaard, Reference Lassen and Østergaard2012). But its rate due to ECF for calves and mature cattle was 15 and 10% in a farm of Uasin Gishu District of Kenya. After controlling ticks, mortality decreased from 80 to 2–4% in cattle (Nyangito et al., Reference Nyangito, Richardson, Mukhebi, Mundy, Zimmel and Namken1995). While, its rate due to gastrointestinal nematodes in twice treated and non-treated animals were 19 and 14% respectively from 1046 N'Dama cattle during 1989–1994 in Gambia (Zinsstag et al., Reference Zinsstag, Ankers, Itty, Njie, Kaufmann, Pandey and Pfister1997b). Moreover, morbidity and mortality losses due to tropical theileriosis (Theileria annulata infection) were 51.62 and 22.84% from a total loss of US$ 388 875 and US$ 172 000 in Turkey, respectively (Inci et al., Reference Inci, Ica, Yildirim, Vatansever, Cakmak, Albasan, Cam, Atasever, Sariozkan and Duzlu2007).
Ticks control cost
In Zambia, expenditure for ticks control was US$ 8.43; 13.62 and 21.09 animal−1 annum−1 for dipping, spraying and pour-on, respectively. Control costs depend on herd size, the lager the size the lower the per head cost (D'haese et al., Reference D'haese, Penne and Elyn1999). Ticks control (chemical, labour and others) cost in Australia was US$ 41 million according to the Australian Bureau of Agriculture and Resource Economics during the year 1994 (McLeod, Reference McLeod1995). Insecticides consumption for ticks control in India increases more than 100%, it increased from 22 013 to 61 357 tons during 1971 and 1995, respectively (Ghosh et al., Reference Ghosh, Azhahianambi and de la Fuente2006). In Uganda, its cost accounted between 74.37 and 85.13% of total disease control cost. The control cost/head in pastoral and ranch herds were US$ 4.90 ± 0.61 and 6.13 ± 0.85, respectively (Ocaido et al., Reference Ocaido, Muwazi and Opuda2009). While in Kenya, cost of ECF control was US$ 51 and 50 cattle−1 annum−1 for small and large dairy farms from variable cost of US$ 38.64 and 1561, respectively for production (Nyangito et al., Reference Nyangito, Richardson, Mukhebi, Mundy, Zimmel and Namken1995).
Conclusion
The dairy farm is mainly based on investment and outcomes from production. It is necessary to estimate the economic losses caused by parasitic diseases for successful implementation of control programmes. Different parasites cause losses according to their predilection sites and in relation with the respective production system. Parasites affect farm economics in terms of losses form decrease of milk, carcass and hides and, cost from morbidity, treatment, control, abortion and mortality. In literature, there mentioned different methods/models for parasitic economic loss calculation that are classified into two major classes in this study, such as economic evaluation techniques and dynamic analysis. Calculation of losses with these methods/models needs expertise and easy access to them. It is easier to perform economic evaluation techniques than dynamic analyses. In economic evaluation techniques, benefit-cost ratio and cost-effective manner are based upon the ratio of income on cost on production for the estimation of a project. But in dynamic analyses, the retrospective study needs accurate and long-term data availability. While from deterministic models, spread-sheet data will be constructed for the income (production) and cost (treatment, control, mortality) to study the parasitic economic loss. Moreover, software packages including PANACEA® and PARABAN™ that needs their availability or access to them. On the other hand, simulation-based models follow the Monte Carlo simulation technique; it needs expertise and help of accountant for their analysis. So, the farmers and researchers can calculate parasite based losses either by any of them according to the availability, their expertise or collaboration of related person/organization to appreciate their losses. The purpose of parasite economic losses calculation is to find the proper way for the best and economical method for the in time control of these infections and their complications. Tick and TBDs cause losses in production, treatment and mortality, thus, they play a major role in cattle farm profitability. All cattle nematodes have adverse effects on every farm leading to milk, treatment and weight losses due to share of host energy by parasites. In cestode infestation, echinococcus spp. is the most economically harmful being of its zoonotic importance (Budke et al., Reference Budke, Deplazes and Torgerson2006); causes economic losses by a decrease in milk production, organs condemnation, decrease in weight gain and hide quality and increase in treatment costs. Moreover, among trematodal infections, fascioliasis is economically the most important disease. Its loss includes organ condemnation, carcass loss and treatment expenditure. No mortality was recorded due to nematodal, trematodal and cestodal infestations in any of the studied publications but it could happen with ticks and TBDs. Based on unit economic loss analysis, it was found that parasites have a great role on the profitability of cattle farming. From the overall literature review, we came to know that tick-borne disease (Theileriosis), echinococcosis, fascioliasis and Ostertagia ostertagi from phylum of protozoa, cestode, trematode and nematode, respectively are economically important diseases. So, it would be helpful for farmers and researchers to approach the above-enlisted methods/models for calculation of parasitic losses and adopt suitable measures to avoid long-term economic losses.
Acknowledgements
The authors express their sincere gratitude to Rahmat Ullah and Amir Bakhsh, Livestock and Dairy Development Department, Punjab, Pakistan for providing literature concerning this manuscript. This study was not supported by any foundation. We additionally are thankful to Muhammad Munir, Lancaster University, UK for improving the readability of the manuscript.
Declarations
Not applicable.
Ethics approval
Not applicable.
Consent of publication
Not applicable.
Availability of data and materials
Science direct and PubMed database.
Competing interests
Authors declare that they have no competing interests.
Funding
Not applicable.
Author contributions
Muhammad Rashid, searched data and organized the whole manuscript. Muhammad Imran Rashid, gave suggestions, provided a draft of manuscript and submission guidelines. Haroon Akbar, did the revision of manuscript. Liaquat Ahmad, helped in clarifying the models. Kamran Ashraf, helped in inclusion and exclusion criteria. Muhammad Adeel Hassan, Khalid Saeed and Mohamed Gharbi, did proofreading of this manuscript. All authors read and approved the final version of the manuscript.