Introduction
Brazil is one of the largest markets for transgenic glyphosate-resistant (GR) crops such as soybean [Glycine max (L.) Merr.] and corn (Zea mays L.), especially due to weather conditions that allow farmers to grow a second crop in the same year, which in most cases is GR (Roundup Ready® [RR]) corn (Lopez Ovejero et al. Reference Lopez Ovejero, Takano, Nicolai, Ferreira, Melo, Cavenaghi, Christoffoleti and Oliveira2017). For the last 5 yr, more than 90% of soybean fields in South America have been planted with RR varieties (Peterson et al. 2018). The intense use of glyphosate with few herbicide-resistance mitigation practices has led to the selection of eight GR weed species over the past 12 yr in Brazil (Heap Reference Heap2018). Among these species, goosegrass [Eleusine indica (L.) Gaertn.] has evolved multiple resistance to glyphosate and acetyl-CoA carboxylase (ACCase) inhibitors (Osuna et al. Reference Osuna, Goulart, Vidal, Kalsing, Ruiz Santaella and De Prado2012; Takano et al. Reference Takano, Oliveira, Constantin, Braz and Gheno2017).
While E. indica is native to Asia, this species has spread to most tropical and subtropical regions around the world (Mueller et al. Reference Mueller, Barnett, Brosnan and Steckel2011). Species of the genus Eleusine are diploid (2n = 18), self-pollinate, and produce large numbers of seeds (Ng et al. Reference Ng, Ratnam, Surif and Ismail2004a). Eleusine indica is a C4 annual grass that can grow up to 0.8 g d−1 under optimal temperatures (25 to 30 C) and soil moisture (Takano et al. Reference Takano, Oliveira, Constantin, Braz and Padovese2016). When four or more E. indica plants per square meter infest annual crops [e.g., cotton (Gossypium hirsutum L.)], this species can cause more than 27% yield loss (Ma et al. Reference Ma, Wu, Jiang and Yan2015). Moreover, managing E. indica with herbicides is normally more effective on young plants, especially because its leaves accumulate a considerable wax layer as the plant matures, reducing herbicide absorption in older plants (Malpassi Reference Malpassi2006).
The mechanism of glyphosate resistance in E. indica populations from other parts of the world (e.g., Asia and North America) has been associated with either a nonsynonymous single-nucleotide polymorphism (SNP) in EPSPS (5-enolpyruvylshikimate-3-phosphate synthase) and/or EPSPS gene amplification (Baerson et al. Reference Baerson, Rodriguez, Tran, Feng, Biest and Dill2002; Chen et al. Reference Chen, Huang, Zhang, Wei, Huang, Chen and Wang2015; Kaundun et al. Reference Kaundun, Zelaya, Dale, Lycett, Carter, Sharples and Mcindoe2008; Ng et al. Reference Ng, Wickneswari, Salmijah, Teng and Ismail2004b). In such cases, a single mutation (Pro-106-Ser or Pro-106-Thr) and/or increased EPSPS copy number confer intermediate levels of resistance (resistance factor, RF < 10) in this species. However, under very intense glyphosate selection pressure, E. indica can evolve a double mutation (Thr-102-Ile and Pro-106-Ser) (TIPS) in the EPSPS gene, conferring higher levels of resistance (RF > 10) (Yu et al. Reference Yu, Jalaludin, Han, Chen, Sammons and Powles2015). The occurrence of the TIPS mutation is very rare, because it carries significant fitness cost in resistant plants (Han et al. Reference Han, Vila-Aiub, Jalaludin, Yu and Powles2017).
Point mutations in the EPSPS gene have also been documented in other GR weeds such as Italian ryegrass [Lolium perenne L. ssp. multiflorum (Lam). Husnot], rigid ryegrass (Lolium rigidum Gaudin), waterhemp [Amaranthus tuberculatus (Moq.) J. D. Sauer], junglerice [Echinochloa colona (L.) Link], sourgrass [Digitaria insularis (L.) Mez ex Ekman], and horseweed (Erigeron canadensis L.) (Gaines and Heap Reference Gaines and Heap2018). Considering that these mutations in the EPSPS gene are SNPs, their presence can be detected using quantitative PCR techniques (qPCR). Thus, a large number of samples can be screened for resistance at once with no need for full dose–response experiments, which take time and demand more resources. Genotyping assays can be employed for detection of resistance alleles, and they have been used to detect SNPs conferring resistance to acetolactate synthase (Warwick et al. Reference Warwick, Xu, Sauder and Beckie2008) and ACCase (Délye et al. Reference Délye, Michel, Berard, Chauvel, Brunel, Guillemin, Dessaint and Le Corre2010) inhibitors. qPCR assays usually use two probes, each with its own fluorochromes, to discriminate between two different alleles (susceptible and resistant in this case) (Délye et al. Reference Délye, Duhoux, Pernin, Riggins and Tranel2015).
The rapid detection of herbicide resistance is essential for development of weed management strategies to mitigate herbicide resistance. In these studies, we confirmed that the mechanism of glyphosate resistance in E. indica from Brazil is associated with a nonsynonymous SNP in the EPSPS gene resulting in a Pro-106-Ser amino acid substitution on the enzyme. Other target-site and non–target site resistance mechanisms were also evaluated, but no differences were found, suggesting that resistance is conferred solely by this EPSPS mutation. We also designed a qPCR-based genotyping assay for rapid detection of GR E. indica populations containing the resistant SNP in the EPSPS gene.
Material and Methods
Plant Material and Growth
Seeds of the GR E. indica biotype were collected in a soybean field with a 10-yr history of glyphosate application, located in Campo Mourão County, Paraná State, Brazil (24.15°S, 52.48°W). The GS seeds were collected in a neighboring field with no glyphosate spraying history (24.14 S, 52.40 W). The GR biotype was purified with glyphosate application (960 g ha−1). We then performed a recurring selection of GR offspring for three self-pollinated generations to exclude potential contamination with susceptible seeds. Seeds were planted in pots (0.5-L volume) filled with potting soil. Three E. indica plants per pot were grown in the greenhouse under 25/20 C day/night with 12-h daylight until they reached the 3-leaf stage.
Glyphosate Dose Response
The experimental design was completely randomized in a 2 by 10 factorial. The first factor was E. indica biotypes (GR and GS), and the second factor was glyphosate doses (Roundup Transorb®, 480 g ae L−1, Monsanto, São Paulo, Brazil): 0, 60, 120, 240, 480, 960, 1,920, 3,840, 7,680 and 15,360 g ha−1. Four replications were used for each combination of biotype and dose. Application was with a pressurized backpack sprayer equipped with a 1.5-m-long bar fit with three AI 110-02 spray tips (0.5 m between tips). The sprayer was operated with 245 kPa pressure, providing a spray volume of 200 L ha−1.
Eleusine indica survival was evaluated visually at 28 d after treatment using a scale of 0% to 100%, in which 100% represents no control, and 0% represents plant death. Data were subjected to ANOVA, and the nonlinear logistic regression model was fit using the drc package in R (Ritz et al. Reference Ritz, Baty, Streibig and Gerhard2015; Streibig Reference Streibig1988):
 $$y = {a \over {\left[ {1 + {{\left( {{x \over b}} \right)}^c}} \right]}}$$
In this equation, y is survival, x is glyphosate dose (g ae ha−1), a represents the maximum value, b is the dose providing 50% response (LD50), and c is the curve slope around b. The RF was calculated as the ratio of LD50 between the GR and GS biotypes (Burgos et al. Reference Burgos, Tranel, Streibig, Davis, Shaner, Norsworthy and Ritz2013).
Absorption and Translocation
Glyphosate absorption and translocation experiments followed methods similar to those described in Figueiredo et al. (Reference Figueiredo, Leibhart, Reicher, Tranel, Nissen, Westra and Jugulam2017). Eleusine indica seeds were planted in potting soil and kept under controlled conditions in the greenhouse at 25 C with 80% relative humidity. One week after germination, seedlings were transferred to 15-ml Falcon tubes and filled with fine washed sand. Plants were then placed into a growth chamber under fluorescent and incandescent artificial light and the same temperature and humidity conditions as in the greenhouse. Plants were treated when they had four fully expanded leaves. The youngest expanded leaf was marked and covered with aluminum foil before the whole plant was sprayed with 960 g ha−1 glyphosate + 0.25% nonionic surfactant (NIS). The aluminum foil was then removed, and a solution containing [14C]glyphosate and cold glyphosate (8 μg glyphosate cm−2) was prepared and applied on this leaf as five 1-μl droplets. Total radioactivity applied per plant was 300,000 dpm (4.99 kBq).
Measurement time points were at 12, 24, 48, 96, and 192 h after treatment (HAT). For each time point, three replications (plants) were harvested simultaneously, and the experiment was repeated. Treated leaves were removed and washed with 5 ml of washing solution containing 10% methanol and 1% NIS. Scintillation cocktail (Ecoscint XR, National Diagnostics, Atlanta, GA, USA) was then added to the leaf rinse solution, and radioactivity was measured using liquid scintillation spectrometry (LSS) (Packard Tri-carb 2300TR, Packard Instrument, Meriden, CT, USA). Roots were washed with 10 ml of water to remove sand residues, and radioactivity was measured in a 2-ml aliquot with LSS.
Harvested plants were then oven-dried at 60 C for 96 h before exposure to Phosphor Screen film (GE Healthcare, Pittsburgh, PA, USA) for 4 d before being imaged with a Typhoon Trio Imager (GE Healthcare). Separate parts of the dried plant (treated leaf, other leaves, and roots) were oxidized in a biological oxidizer (OX500, RJ Harvey Instrument, Tappan, NY, USA); this was followed by radioactivity measurement with LSS. Absorption values were calculated as:
 $$\% {\mkern 1mu} {H_{{\rm{abs}}}} = \left[ {{\rm{ot}}/\left( {{\rm{ot}} + {\rm{wl}}} \right)} \right] \times 100$$
where %H abs is the proportion of absorbed herbicide, ot is the amount of 14C measured in oxidized tissue, and wl is the amount of 14C detected in the treated leaf washing. For glyphosate translocation, the following equation was used:
 $$\% {\mkern 1mu} {H_{{\rm{tr}}}} = 100 - \left[ {{\rm{al}}/\left( {{\rm{tl}} + {\rm{ol}}} \right) \times 100} \right]$$
where %H tr is the proportion of translocated herbicide, tl is the amount of 14C measured in the treated leaf, and ol is the amount of 14C detected in other leaves. Absorption and translocation over time were analyzed using R (Kniss et al. Reference Kniss, Vassios, Nissen and Ritz2011).
Glyphosate Metabolism
Eleusine indica plants were grown in the greenhouse until the 4-leaf stage as described earlier and treated with 960 g ha−1 glyphosate. Glyphosate and aminomethylphosphonic acid (AMPA) levels were quantified at 24, 48, 72, and 96 HAT. The extraction method started by grinding 2.5 g of leaf tissue with liquid nitrogen and placing ground tissue into 15-ml Falcon tubes. The tissue was then vortexed with 5 ml of water, shaken for 10 min, and centrifuged at 10,000 × g for 5 min. A 1-ml aliquot was taken and used for derivatization with 0.5 ml of borate solution (5%) and 0.5 ml of fluorenylmethyloxycarbonyl chloride (FMOC-Cl) solution. The solution mixture was then vortexed and incubated at room temperature for 12 h. After this period, tubes were centrifuged at 10,000 × g for 5 min and filtered through 0.2-μm nylon syringe filter into an ultra-high performance liquid chromatography vial. Blank samples were prepared by extracting and derivatizing untreated E. indica leaf tissue.
All samples were analyzed by liquid chromatography–tandem mass spectrometry (LC-MS/MS; Shimadzu Scientific Instruments, Columbia, MD, USA). The LC–MS/MS system consisted of a Nexera X2 UPLC with 2 LC-30 AD pumps, an SIL-30 AC MP autosampler, a DGU-20A5 Prominence degasser, a CTO-30A column oven, and an SPD-M30A diode array detector coupled to an 8040-quadrupole mass spectrometer. Glyphosate and AMPA were separated with a stationary-phase C18 column (100 by 2.1 mm, Alliance Atlantis T3, Phenomenex Co, 411 Madrid Avenue, Torrance, CA, USA) at a flow rate of 0.2 ml min−1 using a linear gradient of acetonitrile (B) and 10 mM ammonium acetate (A): 2 min, 10% B; 10 min, 100% B; 10.1 min, 10% B; 17 min, 10% B. The multiple reaction monitorings (MRMs) were optimized to 390.13 >168 and 331.9 >110 for glyphosate-FMOC and AMPA-FMOC, respectively. Standard curves of serial dilutions of authentic standards were used for absolute quantification. Means were compared by t-test (P <0.05) for each time point.
Shikimate Accumulation in vitro
Shikimate was quantified using leaf disks (5-mm diameter) from GR and GS plants in 96-well microtiter plates (Shaner et al. Reference Shaner, Nadler-Hassar, Henry and Koger2005). Six biological replications from each biotype were used. Each excised leaf disk was placed into an individual well containing 100 μl of 10 mM ammonium phosphate buffer (pH 4.4) plus 0.1% (v/v) Tween 80 surfactant. Each analytical-grade glyphosate at 10, 100, 250, and 500 μM was added to its corresponding well. Plates were closed with a lid, sealed with two Parafilm® layers, and incubated in a growth chamber at 150 μM m−2 s−1 fluorescent light and 25 C for 16 h. Plates were then frozen at −80 C and thawed at 60 C for 30 min. After that, 25 μl of 1.25 N HCl was added to each well, and the plate was incubated at 60 C for 15 min. Aliquots of 15 μl were transferred into a new plate containing 100 μl of 2.5 g L−1 periodic acid and 2.5 g L−1 m-periodate. Following incubation at room temperature for 90 min, 100 μl of 0.6 N NaOH and 0.22 M Na2SO3 was added to each well. Absorbance was measured at 380 nm within 30 min, and background values were subtracted from each of the treatments. Shikimate levels were quantified based on a standard curve with known shikimate concentrations.
Shikimate Accumulation in planta
Eleusine indica plants at the 3-leaf stage from GS and GR biotypes were treated with glyphosate (960 g ha−1) as described earlier. Shikimate levels were measured in four replications at 24, 48, 96, and 144 HAT. Shikimate extraction was based on the microwave-based method described by Matallo et al. (Reference Matallo, Almeida, Cerdeira, Franco, Blanco, Menezes, Luchini, Moura and Duke2009). Plants were dried at 65 C for 72 h and ground in a ball mill (MA250, Marconi, São Paulo, Brazil) for 40 s. Samples of 0.4 g of each plant were solubilized in 10 ml of phosphoric acid in water (pH 2), and the solution was homogenized for 30 min using a shaker (MaxQ 4000, Thermo Scientific, Waltham, Maryland, USA) at 32 rpm. Samples were then microwaved (NN-S62, Panasonic, São Paulo, Brazil) for 10 s and cooled at room temperature for 5 min. After extraction, samples were diluted in phosphoric acid (3.5 mM) at 1:50 and filtered through a 0.22-µm membrane (Millex-GV, Merck Millipore, Barueri, São Paulo, Brazil). Shikimic acid concentration was determined using high-performance liquid chromatography (HPLC; LC-20A Prominence, Shimadzu, Barueri, São Paulo, Brazil), with a total run time of 15 to 20 min and a shikimate retention time of 8.1 min. To determine the levels of shikimate accumulation, a calibration curve was generated using known concentrations of analytical shikimate standard. Means were compared by t-test (P <0.05) for each time point.
EPSPS Relative Gene Copy Number and Transcription
Frozen leaf tissue (50 mg) from three plants of each biotype was ground using a Qiagen Tissuelyzer (Qiagen, Valencia, CA, USA). Total RNA was extracted using a Qiagen RNeasy Plant Mini Kit, treated with DNase I, quantified using a NanoDrop spectrophotometer (Thermo Scientific), and checked for quality and integrity by gel electrophoresis. Eleusine indica RNA (200 ng) was used for synthesizing cDNA using a Quanta qScript cDNA synthesis kit (Bio-Rad, 2000 Alfred Nobel Dr, Hercules, CA, USA) with oligo-dT and random primers. Total genomic DNA was also extracted with a DNeasy kit (Qiagen). DNA quality and quantification were measured using a NanoDrop spectrophotometer, and DNA integrity was evaluated by running samples through a 1% agarose gel. For both cDNA and genomic DNA, primers were designed for EPSPS and β-actin as internal standard, according to Chen et al. (Reference Chen, Huang, Zhang, Wei, Huang, Chen and Wang2015): EPSPS_F (5′-CTGATGGCTGCTCCTTTAGCTC-3′) and EPSPS_R (5′-CCCAGCTATCAGAATGCTCTGC-3′), and β-actin_F (5′-AACAGGGAGAAGATGACCCAGA-3′) and β-actin_R (5′-GCCCACTAGCGTAAAGGGACAG-3′). Genomic DNA and cDNA (10 ng each) were amplified using quantitative real-time PCR with 25-μl total volume under the following conditions: 10 min at 95 C, 40 cycles of 95 C for 20 s, and 60 C for 1 min. After completing these cycles, the melting curve was obtained by increasing the temperature from 60 C to 95 C in increments of 0.5 C every 5 s. EPSPS quantification was calculated as ΔCt = (Ct for β-actin – Ct for EPSPS) (Gaines et al. Reference Gaines, Zhang, Wang, Bukun, Chisholm, Shaner, Nissen, Patzoldt, Tranel, Culpepper, Grey, Webster, Vencill, Sammons, Jiang, Preston, Leach and Westra2010), and the relative increase in EPSPS copy number was expressed as 2ΔCt. Each sample was run in three replicates to calculate the mean and standard deviation. Results were represented as the fold increase in EPSPS copy number relative to β-actin. Means were compared by t-test (P <0.05) for both genomic copy number and transcription.
EPSPS Gene Sequencing
To investigate a possible mutation in the specific region of E. indica EPSPS where mutations are known to confer glyphosate resistance, genomic DNA was extracted from GR and GS biotypes. Approximately 0.2 g of leaf tissue was used for DNA extraction (Kaundun et al. Reference Kaundun, Zelaya, Dale, Lycett, Carter, Sharples and Mcindoe2008). Plant tissue was placed in 96 deep-well blocks and stored at −80 C. Tissue was then ground in a bead mill to a dry powder and centrifuged at 2,200 × g for 5 min. Genomic DNA was extracted using the Qiagen DNeasy plant DNA extraction kit as described earlier. A 300-bp EPSPS fragment was amplified using primers described by Kaundun et al. (Reference Kaundun, Zelaya, Dale, Lycett, Carter, Sharples and Mcindoe2008): F-CTCTTCTTGGGGAATGCTGGA and R-TAACCTTGCCACCAGGTAGCCCTC. PCR was performed using a PCR kit (Multiplex, Qiagen) with 7.5 ml of Master Mix, 1.5 µl of Q-Solution, 1.5 µl of the primer mix (0.2 µM of final concentration of each primer, forward and reverse), 2.5 µl of ultrapure water, and 2.0 µl of DNA template (10 ng L−1); this provided a final reaction volume of 15 µl. The PCR cycling settings were established in accordance with the specifications of the manufacturer: 1 cycle of 95 C for 15 min, 36 cycles of 94 C for 30 s, 60 C for 90 s, 72 C for 60 s, and a final extension at 72 C for 10 min. Before sequencing, PCR products were purified using a PCR Purification Kit (QIAquick, Qiagen). Once purified, the integrity of the PCR product was confirmed by capillary electrophoresis (QIAxel, Qiagen). The PCR products of three GS and three GR samples were sequenced using an ABI-Prism 3500 Genetic Analyzer (Applied Biosystems, Carlsbad, CA, USA).
EPSPS Enzyme Activity
Protein extraction and EPSPS assay were conducted following the procedures developed by Monsanto and described in Dayan et al. (Reference Dayan, Owens, Corniani, Silva, WatsonSB, Howell and Shaner2015) and Salas et al. (Reference Salas, Dayan, Pan, Watson, Dickson, Scott and Burgos2012). Initially, 20 g of young leaf tissue from GS and GR biotypes was ground in liquid nitrogen with a mortar and pestle. Ground tissue samples were homogenized for 5 min with constant stirring in cold extraction buffer (100 mM MOPS, 5 mM EDTA, 10% glycerol, 50 mM KCl, and 0.5 mM benzamidine) with 1% polyvinylpolypyrrolidone (PVPP) and 10 μl of β-mercaptoethanol. Samples were centrifuged at 20,000 × g and 4 C for 40 min, and the supernatant was filtered through a cheesecloth into a cold beaker. Ammonium sulfate was slowly added to the solution to reach 450 g L−1 concentration, stirred for 30 min, and centrifuged at 30,000 × g and 4 C for 30 min. Ammonium sulfate was slowly added to the supernatant until 700 g L−1 concentration was reached, after which the supernatant was centrifuged again at 30,000 × g and 4 C for 30 min. The pellet was dissolved in 2 ml of extraction buffer, but without EDTA and PVPP. Extracted samples were dialyzed overnight in dialysis buffer using Slide-A-Lyzer™ dialysis cassettes (Thermo Scientific) in 2 L of dialysis buffer (10 mM MOPS, 0.5 mM EDTA, 10% glycerol, and 5 mM β-mercaptoethanol) at 4 C on a stir plate.
EPSPS activity for GS and GR biotypes was measured in the presence of increasing concentrations of glyphosate (0, 0.1, 1, 10, 100, and 1000 μM). The assay for inorganic phosphate release was conducted using the EnzCheck phosphate assay kit (Invitrogen, Carlsbad, CA, USA) in three replications. The cuvette in which the reaction was conducted contained 500 μl of 2 × assay buffer (100 mM of MOPS, 1 mM of MgCl2, 10% glycerol, 2 mM of sodium molybdate, and 200 mM of NaF), 215 μl of HPLC-grade water, 200 μl of 1 mM 2-amino-6-mercapto7-methylpurine riboside, 10 μl 100 U ml−1 unit of purine-nucleoside phosphorylase, 25 μl of 50 mM phosphoenolpyruvate (PEP), 10 μl of glyphosate, and 10 μl of dialyzed EPSPS. After the solution was allowed to react for 5 min, 50 μl of 10 mM shikimate-3-phosphate was added. Inorganic phosphate release (μmol) per microgram of total soluble protein per minute was measured at 360 nm by calculating the slope of the phosphate release above background. Enzyme activity was expressed as μmol Pi μg−1 protein min−1 and values were regressed using the drc package in R (Ritz et al. Reference Ritz, Baty, Streibig and Gerhard2015).
SNP Genotyping for Pro-106-Ser on EPSPS Gene
The methodology developed in Warwick et al. (Reference Warwick, Xu, Sauder and Beckie2008) was employed with some alterations for genotyping 240 GR plants and 60 GS plants totaling 300 individuals. To provide a quick technique for surveying GR E. indica populations, an SNP genotyping protocol was developed for the Pro-106-Ser target-site mutation in the EPSPS gene, considering that GS plants carry the codon CCA, whereas GR plants carry the codon TCA. Minor groove-binding group (MGB) probes and primers (Table 1) were custom designed and synthesized based on the EPSPS sequence provided (TaqMan, Applied Biosystems). Two primers were designed to amplify a 58-bp fragment containing the SNP, and the two MGB probes were designed to discriminate C or T alleles, that is, the Fluor VIC probe for the resistant T allele and the Fluor FAM probe for the susceptible C allele.
Table 1 Primers and TaqMan probes used for single-nucleotide polymorphism genotyping assay in the Eleusine indica 5-enolpyruvylshikimate-3-phosphate synthase (EPSPS) gene.

a MGB, minor groove-binding.
Each SNP genotyping PCR reaction (10 µl) contained 20 ng of genomic DNA, 0.5 µl of Custom TaqMan SNP Genotyping Assays containing primers and MGB probes, and 5 µl of TaqMan Universal PCR Master Mix (Applied Biosystems). The product was amplified under the following conditions: 15 min at 95 C, followed by 36 cycles of 30 s at 94 C and 1 min at 72 C in a Viia 7 RT-PCR System (Thermo Scientific). Two technical replicates for each of the 300 samples were performed to check technical consistency.
Results and Discussion
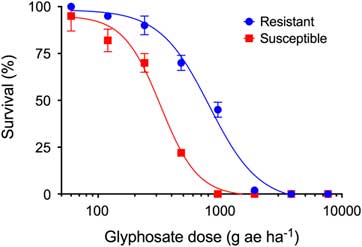
Both biotypes were completely controlled with glyphosate doses of 3,840 g ha−1 or above (Figure 1). All plants of the GS biotype were killed by 960 g ha−1 glyphosate, whereas 41% of the GR biotypes survived the same dose. The RF was 4.2, calculated from the relative LD50 values derived from the dose–response curves (Table 2). This RF is similar to those found in biotypes from other countries, including Malaysia (RF 8), the United States (RF 3 to 8), and China (RF 4 to 6) (Chen et al. Reference Chen, Huang, Zhang, Wei, Huang, Chen and Wang2015; Lee and Ngim Reference Lee and Ngim2000; Molin et al. Reference Molin, Wright and Nandula2013; Mueller et al. Reference Mueller, Barnett, Brosnan and Steckel2011). In such cases, resistance is conferred mainly by alterations in the target site that provide low to intermediate levels of glyphosate resistance. A similar range of RF values indicates that the resistance mechanism across these different locations could be the same.

Figure 1 Survival (%) of glyphosate-resistant (blue) and glyphosate-susceptible (red) Eleusine indica biotypes at 28 d after treatment. Data were pooled from two experiments with three replications per treatment and biotype.
Table 2 Lethal dose for 50% response (LD50), estimated parameters of the model (Equation 1) and resistance factor (RF) for survival (%), in vitro shikimate assay (μg ml−1), and EPSPS enzyme activity (μmol Pi μg−1 total soluble protein min−1) of glyphosate susceptible (GS) and glyphosate resistant (GR) Eleusine indica biotypes.

In vitro and in planta shikimate levels in the GS biotype were higher than those measured in the GR biotype, supporting the differences in glyphosate sensitivity observed with the whole-plant dose response (Figure 2). The average shikimate accumulation in GS divided by the average shikimate accumulation in GR provides an RF of 3.8-fold in planta and 4.1-fold based on LD50 values in vitro (Table 2). These data are consistent with our whole-plant resistance to glyphosate (RF 4.2) and another GR E. indica biotype from Tennessee (Mueller et al. Reference Mueller, Barnett, Brosnan and Steckel2011). Glyphosate inhibits EPSPS, a key enzyme of the shikimate pathway, competing with PEP, one of the substrates for EPSPS. Inhibition of EPSPS leads to reduced feedback inhibition of the pathway, resulting in increased carbon flow to shikimate-3-phosphate, which is then converted into high levels of shikimate (Duke and Powles Reference Duke and Powles2008). Because shikimate accumulation is normally proportional to EPSPS inhibition, greater accumulation of shikimate in GS than in GR indicates a stronger inhibition of EPSPS activity in GS than GR E. indica.

Figure 2 Shikimate accumulation in vitro (A) and in planta (B) for glyphosate-resistant and glyphosate-susceptible Eleusine indica biotypes. Samples for the in planta assay were extracted from plants treated with 960 g ha−1 glyphosate and analyzed with high-performance liquid chromatography. The in vitro assay was conducted using E. indica leaf disks exposed to increasing glyphosate concentrations. Data were pooled from two experiments with three replications per treatment and biotype.
[14C]glyphosate absorption increased similarly over time for both GS and GR biotypes (Figure 3). No significant difference was found for maximum absorption (A max) between these two biotypes (GS: 66.9 ± 1.8; GR: 66.1 ± 1.7). The translocation of this herbicide throughout other parts of the plant was also very similar for GS and GR, suggesting that differential absorption and translocation do not contribute to glyphosate resistance in this E. indica biotype. This is supported by the times for 90% of total translocation (t 90) out of the treated leaf (GS: 32.5 ± 8.3; GR: 39.7 ± 11.6) and to roots (GS: 64.2 ± 12.9; GR: 55.9 ± 9.8), which were also similar between biotypes. These data corroborate previous studies that have not found differences in glyphosate metabolism rate or absorption and translocation between GR and GS E. indica biotypes (Baerson et al. Reference Baerson, Rodriguez, Tran, Feng, Biest and Dill2002; Kaundun et al. Reference Kaundun, Zelaya, Dale, Lycett, Carter, Sharples and Mcindoe2008; Ng et al. Reference Ng, Wickneswari, Salmijah, Teng and Ismail2003, Reference Ng, Ratnam, Surif and Ismail2004a).

Figure 3 Absorption (A) and translocation of [14C]glyphosate in the treated leaf (B), other leaves (C), and roots (D) of glyphosate-resistant and glyphosate-susceptible Eleusine indica biotypes from Brazil. Data were pooled from two experiments with three replications per treatment and biotype. Differences between biotypes were not significant (P <0.05).
The levels of both glyphosate and AMPA were statistically similar for GS and GR biotypes, indicating that glyphosate metabolism is also not associated with the mechanism of resistance in this E. indica biotype (Figure 4). Metabolic degradation of glyphosate into less-toxic compounds does not occur very commonly in weeds, and the relationship between glyphosate metabolites and resistance levels is often unclear (reviewed in Sammons and Gaines Reference Sammons and Gaines2014). However, glyphosate metabolism has been reported in other species such as D. insularis (Carvalho et al. Reference Carvalho, Alves, González-Torralva, Cruz-Hipolito, Rojano-Delgado, De Prado, Gil-Humanes, Barro and Luque de Castro2012). Some recent research using RNA sequencing to investigate the mechanism of GR in a E. indica population from China found overexpression of a glutathione transferase gene family in the resistant biotype compared with the susceptible biotype (Chen et al. Reference Chen, Huang, Wei, Huang, Wang and Zhang2017a). However, the hypothesis of whether or not there is a connection between this gene family and glyphosate resistance remains to be proven.

Figure 4 Levels of glyphosate (A) and aminomethylphosphonic acid (AMPA) (B) at 24, 48, 96, and 192 h after glyphosate treatment (960 g ha−1) in glyphosate-resistant and glyphosate-susceptible Eleusine indica. Data were pooled from two experiments with three replications per treatment and biotype. Means did not differ by t-test (P <0.05).
The first case of EPSPS gene amplification conferring glyphosate resistance in a weedy species was reported in Palmer amaranth (Amaranthus palmeri S. Watson) (Gaines et al. Reference Gaines, Zhang, Wang, Bukun, Chisholm, Shaner, Nissen, Patzoldt, Tranel, Culpepper, Grey, Webster, Vencill, Sammons, Jiang, Preston, Leach and Westra2010). Since then, this mechanism has been documented in other GR species such as A. tuberculatus (Lorentz et al. Reference Lorentz, Gaines, Nissen, Westra, Strek, Dehne and Beffa2014), spiny amaranth (Amaranthus spinosus L.) (Nandula et al. Reference Nandula, Wright, Bond, Ray, Eubank and Molin2014), kochia [Bassia scoparia (L.) A. J. Scott] (Jugulam et al. Reference Jugulam, Niehues, Godar, Koo, Danilova, Friebe, Sehgal, Varanasi, Wiersma, Westra and Stahlman2014; Wiersma et al. Reference Wiersma, Gaines, Preston, Hamilton, Giacomini, Buell, Leach and Westra2015), L. multiflorum (Salas et al. Reference Salas, Dayan, Pan, Watson, Dickson, Scott and Burgos2012), ripgut brome (Bromus diandrus Roth) (Malone et al. Reference Malone, Morran, Shirley, Boutsalis and Preston2016), and windmillgrass (Chloris truncata R. Br.) (Ngo et al. Reference Ngo, Malone, Boutsalis, Gill and Preston2018). While relative EPSPS genomic copy number was 16.8-fold higher in a GR compared with a GS E. indica biotype from China (Chen et al. Reference Chen, Jiang, Huang, Wei, Huang, Wang and Zhang2017b), both the biotypes from Brazil had only one copy of EPSPS and similar levels of the EPSPS transcript (Figure 5). Consequently, EPSPS gene amplification is not associated with the mechanism of glyphosate resistance in E. indica from Brazil.

Figure 5 Relative quantification of EPSPS genomic copy number and EPSPS transcription in glyphosate-resistant and glyphosate-susceptible Eleusine indica from Brazil, using β-actin as the reference gene. Data were pooled from two experiments with three replications per treatment and biotype. Means did not differ by t-test (P <0.05).
A nonsynonymous mutation in a codon encoding for Pro-106 (CCA) to a serine (TCA) (Pro-106-Ser) was observed in a 330-bp EPSPS fragment from the GR biotype (Figure 6). This mutation is prevalent in other GR E. indica populations around the world, as well as in other GR species (Baerson et al. Reference Baerson, Rodriguez, Tran, Feng, Biest and Dill2002; Chen et al. Reference Chen, Huang, Zhang, Wei, Huang, Chen and Wang2015; Kaundun et al. Reference Kaundun, Zelaya, Dale, Lycett, Carter, Sharples and Mcindoe2008; Molin et al. Reference Molin, Wright and Nandula2013; Ng et al. Reference Ng, Wickneswari, Salmijah, Teng and Ismail2004b). This amino acid substitution confers low to intermediate levels of glyphosate resistance, supporting dose–response and shikimate data reported in this research. Other GR species such as E. colona, L. perenne ssp. multiflorum, and L. rigidum that harbor the same EPSPS mutation (Pro-106-Ser) also have similar levels of resistance to glyphosate (Sammons and Gaines Reference Sammons and Gaines2014).

Figure 6 EPSPS gene fragment comparison of Arabidopsis thaliana EPSPS sequence [GenBank: CAA29828.1]; susceptible (S) and resistant (R) biotypes of Eleusine indica from Malaysia (AY157642 MS and AY157643 MR) and from Brazil (BS and BR). The colored bases show a proline (red) to a serine (blue) codon substitution at position 106 in the GR biotype.
As expected, EPSPS activity from the GR biotype was less inhibited than in GS plants (Figure 7). The LD50 values for GS and GR were 6.4 and 23.4, respectively, providing an RF of 3.8, which is consistent with shikimate accumulation (RF = 3.4 to 3.8) and whole-plant dose response (RF = 4.2) (Table 2). The single point mutation Pro-106-Ser decreases the affinity of glyphosate (Ki) to its binding site in E. indica EPSPS (Baerson et al. Reference Baerson, Rodriguez, Tran, Feng, Biest and Dill2002; Kaundun et al. Reference Kaundun, Zelaya, Dale, Lycett, Carter, Sharples and Mcindoe2008). Because this target-site mutation confers intermediate levels of resistance, it may not be enough to provide full dose resistance in polyploid species (e.g., E. colona) due to a dilution effect (Alarcón-Reverte et al. Reference Alarcón-Reverte, García, Watson, Abdallah, Sabaté, Hernández, Dayan and Fischer2015). Therefore, polyploid plants containing Pro-106-Ser in only one of their genomes can become susceptible when glyphosate is applied under mild temperatures (Han et al. Reference Han, Yu, Widderick and Powles2016).

Figure 7 EPSPS enzyme activity of glyphosate-resistant and glyphosate-susceptible Eleusine indica biotypes from Brazil. Enzyme activity is represented in amount of inorganic phosphate (Pi) released (μmol) per μg of total soluble protein (TSP) per minute. Means are of three biological replications per glyphosate dose and biotype.
A qPCR-based SNP genotyping assay was developed to discriminate individuals from GS (homozygous CCA) and GR (homozygous TCA) nucleotides for the Pro-106 codon (Figure 8). Plants of the GS biotype carried the homozygous susceptible allele (C), whereas those of the GR biotype contained the homozygous resistance allele (T). Therefore, this assay can be useful for the detection of the Pro-106-Ser mutation and, consequently, glyphosate resistance in E. indica. Rapid SNP genotyping assays, like the one described here, should be adopted more widely in other species and with other herbicides for which the mechanism of resistance involves point mutations [e.g., ALS-resistant B. scoparia (Warwick et al. Reference Warwick, Xu, Sauder and Beckie2008) and ACCase-resistant blackgrass (Alopecurus myosuroides Huds.) (Délye et al. Reference Délye, Michel, Berard, Chauvel, Brunel, Guillemin, Dessaint and Le Corre2010)].

Figure 8 Single-nucleotide polymorphism genotyping assay developed in this study using quantitative PCR for the C-to-T substitution resulting in a Pro-106-Ser mutation in Eleusine indica. The y-axis corresponds to fluorescence measures for the Fluor VIC probe for the T allele, and the x-axis corresponds to the Fluor FAM probe for the C allele. The three clusters correspond to genotypes: TT-homozygote (GR), CC-homozygote (GS), and the negative control.
The development of a simple, rapid, and accurate diagnostic test is needed to detect resistant biotypes before herbicide application. Genotyping assays are inexpensive and suitable for the screening of large numbers of individuals to detect even low-frequency resistant alleles in individuals within a population. Such assays can inform herbicide applicators to make better decisions when choosing herbicides. Hopefully, these decisions would minimize the spread of the resistant biotypes by encouraging farmers to adopt more proactive approaches (Corbett and Tardif Reference Corbett and Tardif2006). SNP genotyping assays, like the TaqMan assay used herein, are high-throughput techniques, and they have already been widely applied in human genetics and molecular plant breeding (Giancola et al. Reference Giancola, McKhann, Berard, Camilleri, Durand, Libeau, Roux, Reboud, Gut and Brunel2006; Ranade et al. Reference Ranade, Chang, Ting, Pei, Hsiao, Olivier, Pesich, Hebert, Chen, Dzau, Curb, Olshen, Risch, Cox and Botstein2001). This technology has been adopted in a number of areas in weed science, especially for diagnosing herbicide resistance and identifying genetically related species (Küpper et al. Reference Küpper, Borgato, Patterson, Netto, Nicolai, Carvalho, Nissen, Gaines and Christoffoleti2017; Patterson et al. Reference Patterson, Fleming, Kessler, Nissen and Gaines2017).
The GR E. indica biotype from Brazil had a resistance factor of 4.2 in greenhouse dose–response studies. There were no differences between susceptible and resistant biotypes for glyphosate metabolism, absorption, or translocation. The two biotypes also had a similar EPSPS gene copy number and EPSPS transcription. However, the resistant biotype has an SNP resulting in a Pro-106-Ser amino acid substitution in the EPSPS, conferring similar resistance levels for enzyme activity and shikimate accumulation. The EPSPS of susceptible plants was 3.8-fold more sensitive to glyphosate inhibition than the enzyme from resistant plants, while shikimate accumulation was 3.8- to 4.1-fold greater in the susceptible than in the resistant biotype. Consistent with biotypes from other regions of the globe, the Pro-106-Ser is associated with the mechanism of glyphosate resistance in E. indica from Brazil, characterizing the first report of this target-site mutation for this species in South America. Therefore, a qPCR-based SNP genotyping assay was developed based on this amino acid substitution for the rapid and precise identification of glyphosate-resistant Eleusine indica populations.
Acknowledgments
We thank Scott Nissen and Marcelo Figueiredo for technical assistance with radiolabeled glyphosate studies. This research was partially funded by Monsanto Company, the Brazilian governmental scholarship program for graduate students (CAPES), and Colorado State University. No conflicts of interest have been declared.