I. INTRODUCTION
Since its first use as a negative electrode material in the 1980s, graphite holds an important role in battery technology, especially for Li-ion batteries (LIBs) (Tarascon and Armand, Reference Tarascon and Armand2001). Electrochemical cell voltages exceeding 3.6 V incorporating graphite electrodes and a range of lithium-based transition metal oxide or phosphate positive electrodes are possible. Graphite's theoretical capacity of 372 mAh g−1 and low potential against Li+/Li forms the backbone of LIB technology (Tarascon and Armand, Reference Tarascon and Armand2001). Furthermore, the abundance and low cost of graphite strengthens its commercial implementation in LIBs (Park et al., Reference Park, Yeo, Seo, Miyawaki, Mochida and Yoon2013).
Nevertheless, the use of graphite in LIBs is not without flaws. A number of challenges remain such as the need for more capacity and faster charging times, with future energy storage systems requiring improved safety and higher power output (Tarascon and Armand, Reference Tarascon and Armand2001). Another significant challenge for lithium-ion technology is the rarity of lithium and the materials associated with the positive electrode (e.g. cobalt) that increase the already high cost of batteries further (Tarascon and Armand, Reference Tarascon and Armand2001; Palomares et al., Reference Palomares, Serras, Villaluenga, Hueso, Carretero-Gonzalez and Rojo2012). The increasing price for lithium and its associated technology is typically considered to be incompatible with the increasing demand for large-scale energy storage coupled with sustainable and clean energy sources such as solar and wind technology (Choi et al., Reference Choi, Chen, Freunberger, Ji, Sun, Amine and Bruce2012). The unstable supply of energy generated from these renewable energy sources requires cheap, efficient, and reliable energy storage systems to ensure the availability of stored energy (Sawicki and Shaw, Reference Sawicki and Shaw2015).
Sodium-ion batteries (SIBs) were proposed as a low-cost alternative for LIBs (Pan et al., Reference Pan, Hu and Chen2013; Kang et al., Reference Kang, Liu, Cao, Zhao, Jiao, Wang and Yuan2015; Pramudita et al., Reference Pramudita, Rawal, Choucair, Pontiroli, Magnani, Gaboardi and Sharma2017a, Reference Pramudita, Sehrawat, Goonetilleke and Sharma2017b). Sodium's abundance not only results in reduced costs relative to lithium, but also ensures that enough sodium can be acquired to fulfil the demand for large-scale applications (Slater et al., Reference Slater, Kim, Lee and Johnson2013). However, SIB development faces a significant hurdle due to the lack of a suitable negative electrode material comparable in performance to graphite in LIBs. Graphite was shown to react unfavourably with Na to form NaC64 and produce low capacities of ~35 mAh g−1 (Stevens and Dahn, Reference Stevens and Dahn2001). Thus, researchers have explored the use of alternative forms and formats of carbonaceous materials as negative SIB electrodes, such as hard carbon, which produces capacities of 300 mAh g−1 after 120 cycles at C/10 (Ponrouch et al., Reference Ponrouch, Goñi and Palacín2013), pitch-cokes that produce 83 mAh g−1 after 10 cycles at 7 mA g−1 (Thomas et al., Reference Thomas, Ghanbaja and Billaud1999), or expanded graphite with capacities of 136 mAh g−1 after 1000 cycles at 100 mA g−1 (Kang et al., Reference Kang, Liu, Cao, Zhao, Jiao, Wang and Yuan2015). These results imply the practical transition from LIBs to SIBs is not straightforward (Wen et al., Reference Wen, He, Zhu, Han, Xu, Matsuda and Wang2014).
Previously, potassium was not considered useful in rechargeable, room temperature, non-aqueous batteries because of its larger size compared with lithium and sodium in light of the unsuccessful intercalation of sodium into graphite (Nobuhara et al., Reference Nobuhara, Nakayama, Nose, Nakanishi and Iba2013; Wen et al., Reference Wen, He, Zhu, Han, Xu, Matsuda and Wang2014; Jian et al., Reference Jian, Luo and Ji2015; Komaba et al., Reference Komaba, Hasegawa, Dahbi and Kubota2015). Using density functional theory (DFT) based calculations, it was shown that Li–graphite intercalation compounds (Li-GICs) and potassium–graphite intercalation compounds (K-GICs) are energetically stable at the high alkali-metal densities of LiC6 and KC8, while at the low Na density NaC16 is unstable (Nobuhara et al., Reference Nobuhara, Nakayama, Nose, Nakanishi and Iba2013). This is also in agreement with earlier practical work that stabilised the eighth-stage NaC64 compound (Ge and Fouletier, Reference Ge and Fouletier1988). K-GICs are known to form in “stages” based on the number of graphene layers separating the K-intercalated layer, where stage four K-GICs have four graphene layers for every K-intercalated layer, stage three have three, and stage one has all layers intercalated (Nixon and Parry, Reference Nixon and Parry1968). Regarding the implications of the greater mass of potassium relative to lithium and sodium for battery applications, it is noted that the alkali metal weight is not relevant because the pure metal is typically not used due to safety considerations in commercial batteries (Tarascon and Armand, Reference Tarascon and Armand2001; Komaba et al., Reference Komaba, Hasegawa, Dahbi and Kubota2015) and the comparison should therefore be undertaken on the positive electrode material. For example, the mass ratio of the intercalate in P2-type K2/3CoO2 compared with O3-type LiCoO2 is 1.19 (Taniguchi et al., Reference Taniguchi, Ebina, Takada and Sasaki2005). Whilst there are a number of assumptions in this comparison, generally the use of a heavier charge-balancing ion may not significantly affect the total mass of the battery as outlined in recent reviews of potassium-based batteries (Eftekhari et al., Reference Eftekhari, Jian and Ji2016; Pramudita et al., Reference Pramudita, Rawal, Choucair, Pontiroli, Magnani, Gaboardi and Sharma2017a, Reference Pramudita, Sehrawat, Goonetilleke and Sharma2017b).
The aforementioned studies open up new possibilities for potassium-ion batteries (KIBs). KIBs hold some advantages compared with LIBs, e.g., K being more abundant and thus cheaper (Luo et al., Reference Luo, Wan, Ozdemir, Bao, Chen, Dai and Hu2015). Compared with Na-ions in SIBs, the K-ion has a lower standard reduction potential, suggesting a higher working voltage. Additionally, the fact that graphite can intercalate potassium means that graphite negative electrodes can be used (Luo et al., Reference Luo, Wan, Ozdemir, Bao, Chen, Dai and Hu2015). Several studies have demonstrated the use of graphite negative electrodes in KIBs; however, there still remains a debate on the mechanism of potassium-ion intercalation into graphite (Jian et al., Reference Jian, Luo and Ji2015; Komaba et al., Reference Komaba, Hasegawa, Dahbi and Kubota2015; Luo et al., Reference Luo, Wan, Ozdemir, Bao, Chen, Dai and Hu2015). The first investigation of potassium-ion intercalation in a K/graphite half-cell used ex situ X-ray diffraction (XRD) and indicated that insertion occurs through stages of K-GICs, the first being stage three, KC36, detected between 0.3–0.2 V, followed by the stage two KC24 phase between 0.2–0.1 V via a two-phase reaction (KC36 to KC24), before the pure stage one KC8 was observed near 0.01 V (Jian et al., Reference Jian, Luo and Ji2015). Shortly after, DFT calculations supported the three stage formation mechanism (Luo et al., Reference Luo, Wan, Ozdemir, Bao, Chen, Dai and Hu2015). However, theoretical calculations and ex situ studies often miss important intermediates, thus further studies on the mechanism of potassium-ion intercalation into graphite within batteries are required, ideally using time-resolved techniques. In this study, we report what is to the best of our knowledge the first in situ characterisation of potassium-ion intercalation into graphite in KIBs providing new insights on the intercalation mechanism.
II. EXPERIMENTAL
A. Electrochemical characterisation
The graphite electrode for this study was obtained commercially from the MTI corporation. K/graphite coin-type half-cells (CR 2032) were assembled using K metal of ~1 mm thickness and glass-fibre separator soaked in a 1 M potassium hexafluorophosphate (KPF6) in dimethyl carbonate and ethylene carbonate (1:1 wt%) electrolyte solution. Cells were cycled at 1.5 mA g−1 in the voltage range 0.01–2.5 V.
B. Data collection and analysis
In situ synchrotron XRD data were collected from a K/graphite coin-type half-cell (CR 2032) within 3–4 days after cell construction. The coin cell was modified to include 3 mm diameter holes in the casing and a 5 mm diameter hole in the stainless steel spacer. The spacer is a stainless steel plate used to induce pressure inside the coin cell, and it is a standard in coin cell construction. The cells were first discharged to 0.01 V at 5 mA g−1, and then at 6.5 and 8 mA g−1. These procedures were used to ensure sufficient information could be extracted from the limited beamtime available. In situ synchrotron XRD data were collected at the Powder Diffraction beamline (Wallwork et al., Reference Wallwork, Kennedy and Wang2007) at the Australian Synchrotron with a wavelength (λ) of 0.70874(2) Å, determined by using the NIST 660b La11B6 standard reference material. Using the multiple battery carousel system developed at the Australian Synchrotron, data for this battery were acquired, amongst batteries used in other research, over 3.4 min every 27.7 min in transmission geometry during charge/discharge (Gu et al., Reference Gu, Kimpton, Brand, Wang and Chou2017).
III. RESULTS AND DISCUSSION
A. Electrochemical characterisation
Figure 1 shows the electrochemical performance of graphite in a typical cell. The first discharge capacity was found to be relatively high, at 521 mAh g−1; however, this decreased to 249 mAh g−1 after the first charge. This is typical for carbon-based electrodes and is attributed to the formation of the solid electrolyte interface (SEI) and side reactions occurring during the first cycle (Jian et al., Reference Jian, Luo and Ji2015). By the second discharge, the cell capacity was 274 mAh g−1, in good agreement with previous studies that report a second discharge capacity of 273 mAh g−1, which is close to the theoretical value of 279 mAh g−1 for full potassiation, where the phase KC8 forms (Jian et al., Reference Jian, Luo and Ji2015). Results for the extended cycling of the cell can be seen in Figure 1(b). This reveals a fade of cell capacity, which is 107 mAh g−1 after the 10th cycle, 73 mAh g−1 after the 20th cycle, and only 34 mAh g−1 after the 50th cycle. This behaviour, though not as severe, has been noted previously, with steady capacity fade from 197 to 100 mAh g−1 by the 50th cycle (Jian et al., Reference Jian, Luo and Ji2015). Capacity fade is thought to arise from the large volume expansion of graphite during potassium insertion/extraction and/or a less stable and lower conducting SEI compared with the Li counterpart (Jian et al., Reference Jian, Luo and Ji2015; Pramudita et al., Reference Pramudita, Rawal, Choucair, Pontiroli, Magnani, Gaboardi and Sharma2017a, Reference Pramudita, Sehrawat, Goonetilleke and Sharma2017b). The electrochemical performance can be improved by using an electrolyte composed of 0.5 M KPF6 in ethylene carbonate:diethyl carbonate or 1 M potassium bis(fluorosulfonyl)imide (KFSI) in ethylene carbonate:diethyl carbonate, where a capacity above 200 mAh g−1 can be maintained until the 50th cycle (Komaba et al., Reference Komaba, Hasegawa, Dahbi and Kubota2015).

Figure 1. (Colour online) (a) Charge–discharge profile and (b) extended cycling of graphite in a typical potassium half-cell.
B. In situ X-ray diffraction
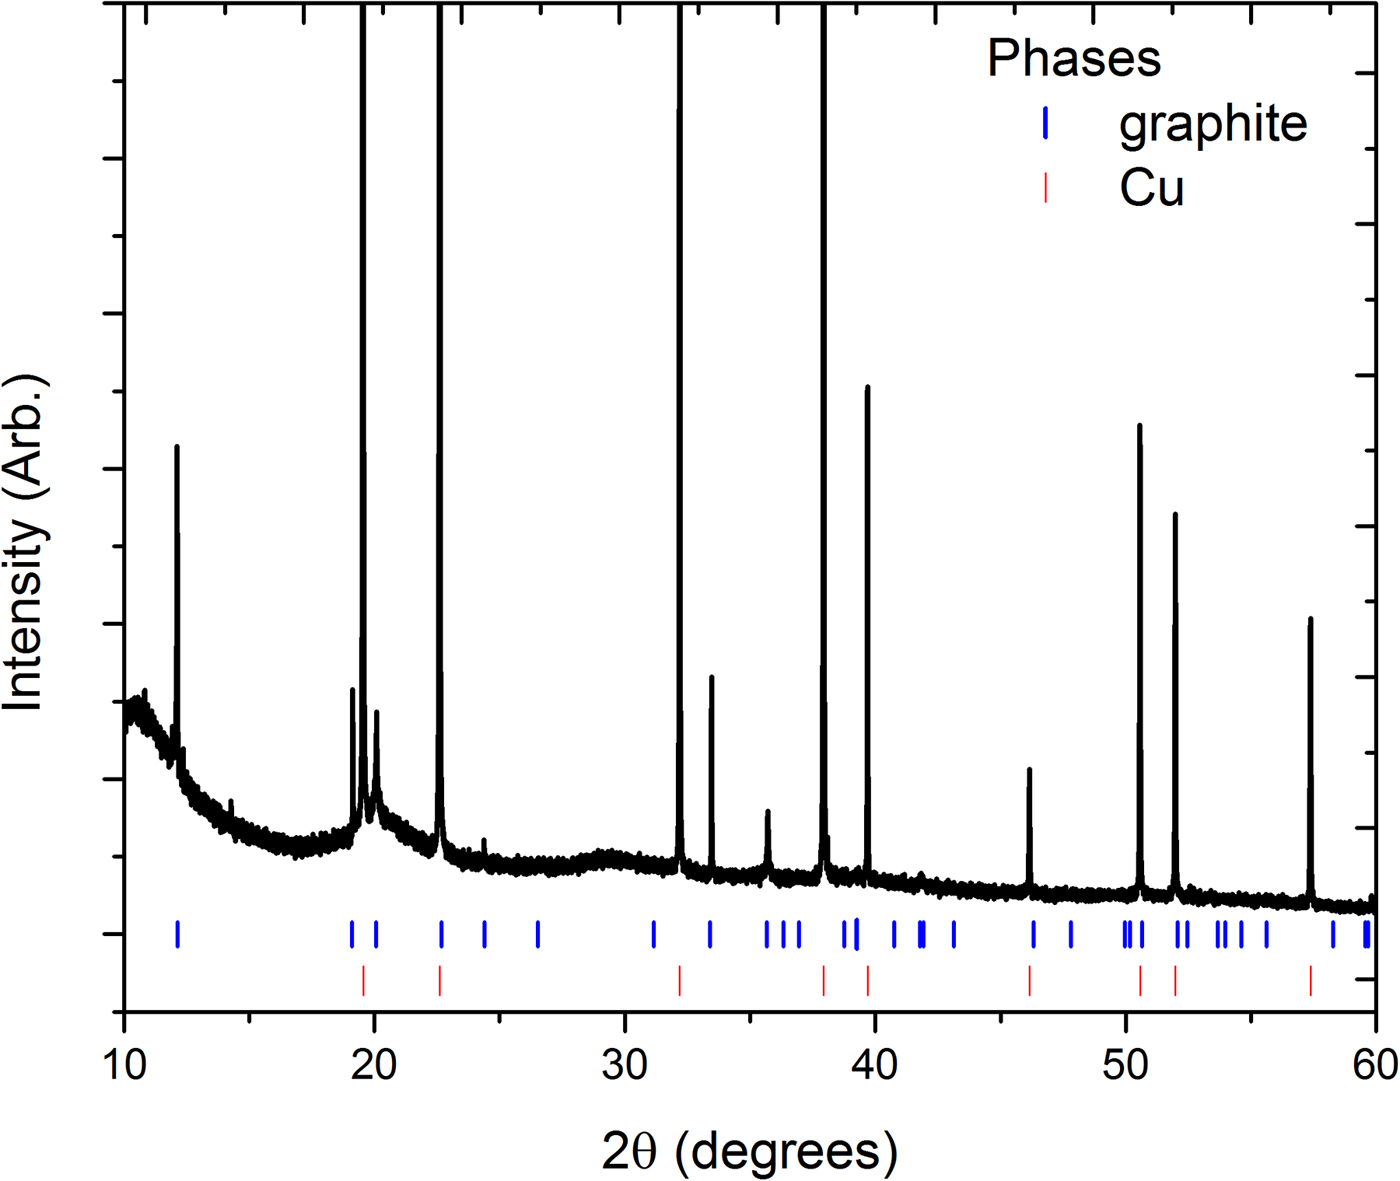
In situ XRD was performed for the first time on a potassium-ion cell to understand the mechanism for K+ insertion into graphite. Figure 2 shows the XRD data for the cell at the beginning of the insertion process. All reflections aside from three very small reflections at ~11.9°, 12.4°, and 14.3°2θ could be indexed to phases of graphite (Hassel and Mark, Reference Hassel and Mark1924) with space group P63/mmc and lattice parameters a = 2.4630(8) Å and c = 6.7182(2) Å, and the Cu phase of the current collector.

Figure 2. (Colour online) XRD data for the uncycled cell. Vertical lines are Bragg reflection markers for the graphite and copper current collector.
Figure 3 shows a contour plot of the in situ XRD data highlighting graphite reflections during the cell discharge. Detector issues at ~550 min resulted in a drop in intensity and data in this region were removed. Small fluctuations in both 2θ and intensity of all reflections (particularly evident for the stronger reflections at higher scattering angles) were noted, possibly arising from the irreproducibility in sample position between repeat rotations of the sample environment carousel. Nevertheless, the in situ data contain phase information that gives insight into the potassiation process. The strongest graphite reflection, 002, decreases in intensity as the discharge proceeds until it disappears at ~0.25 V. Similarly, the graphite 100 reflection decreases in intensity during discharge, but does not completely disappear. The graphite 101 and weaker 004 reflections also decrease in intensity and disappear at ~0.2–0.3 V. The 110 reflection decreases in intensity and also shows a subtle shift to a lower 2θ value by ~0.1°. The last two identifiable reflections, the graphite 112 and 300 reflections, also steadily decrease in intensity during discharge and disappear at ~0.2 V.

Figure 3. (Colour online) Selected 2θ regions of the in situ synchrotron XRD data highlighting the evolution of reflections of interest from graphite, the (a) graphite 002, 100, and 101, and (b) 004, 110, 112, and 300 reflections. The area without data is a consequence of detector issues. The black horizontal lines show times where the current increased, first one to 6.5 mA g−1 and then to 8 mA g−1.
Figures 4(a) and 4(b) show the phase evolution of new reflections appearing during graphite potassiation occurring during the cell discharge. Previous work investigating the gas-phase (Nishitani et al., Reference Nishitani, Uno and Suematsu1983) and chemical (Mizutani et al., Reference Mizutani, Ihara, Abe, Asano, Harada, Ogumi and Inaba1996) potassiation of graphite revealed a complex staging process of K-GICs consisting of up to seven phases, each found to have predominantly P6/mmm symmetry (Böhm et al., Reference Böhm, Schulte and Schlögl1996). The dominant features of XRD data for these potassiated phases are the [00l] basal-plane reflections and we consider our data with respect to reflections associated with the stacking c-axis of these P6/mmm phases in which higher order reflections follow the expected d001/l spacing.

Figure 4. (Colour online) Selected 2θ regions of in situ synchrotron XRD data highlighting the evolution of the graphite 002 reflections and new reflections associated with the potassiation of graphite, (a) the graphite 002, KC36 004, KC x , KC8 002, and (b) KC36 007 reflections. The area without data is a consequence of detector issues. The black horizontal lines show times where the current increased, first one to 6.5 mA g−1 and then to 8 mA g−1.
Following the decrease of intensity of the graphite 002 reflection, a new reflection at 2θ = 14.3° appears at ~0.62 V. The d-spacing of this reflection [d = 2.853(5) Å] is near to the 004 reflection of the “stage three” KC36 phase previously observed at d ≈ 3.0 Å (Jian et al., Reference Jian, Luo and Ji2015), and the corresponding KC36 007 reflection can be seen appearing also at ~0.62 V. At this stage in the discharge the graphite 002 reflection is still present. Interestingly, at ~ 0.3 V we see the appearance of a reflection at 2θ = 15.2° [d = 2.680(2) Å] near to the 002 reflection of the “stage one” potassiated graphite phase, KC8 at d ≈ 2.7 Å, at 0.01 V (Jian et al., Reference Jian, Luo and Ji2015), at a much higher potential than previously reported using ex situ characterisation. The graphite 002 reflection disappears at ~0.25 V, where the KC36 and KC8 reflections remain. At ~0.2 V new reflections appear at 2θ = 14.6o and 14.7° [d = 2.790(1) and 2.766(1) Å], which do not correspond to higher order 00l reflections for any previously reported phases. Further, the co-appearance of these two reflections suggests they arise from the same phase, denoted the unknown KC x phase. Satellite reflections due to modulation effects in potassium-intercalated graphite have been observed at low potassium concentrations using XRD (Zabel, Reference Zabel1981; Purewal, Reference Purewal2010), and the very low reflection intensity and close appearance of these reflections is consistent with this. Regardless, the relatively-small Q range over which these powder data were collected limits further analysis of these reflections, which will be the subject of future work. Close to 0.05 V the KC36 phase disappears. Finally, at the 0.01 V discharged state, the potassiated graphite comprises the fully potassiated KC8 phase alongside the two reflections of the KC x phase. The reflection d-spacing and their phase association is summarised in Table I.
Table I. Potassiated graphite reflections observed in this study and in the previous ex situ study (Mizutani et al., Reference Mizutani, Ihara, Abe, Asano, Harada, Ogumi and Inaba1996; Jian et al., Reference Jian, Luo and Ji2015).

In situ data clearly show the formation of the KC8 phase earlier in the discharge process than previously observed in ex situ XRD experiments (Jian et al., Reference Jian, Luo and Ji2015), and that this phase co-exists alongside the graphite and KC36 phases. Our measurements capture the non-equilibrium states of the reaction as it proceeds, and this may in part explain the presence of different stages of K-GICs at the end of the discharge cycle where pure or mostly pure KC8 is expected. Further, throughout the discharge process a change in the background, especially at the lower 2θ range, was observed. This suggests that additional processes involving non-crystalline or disordered phases are likely present. In contrast to the intercalation process of Li into graphite, the solid solution processes that are strongly observed during the lithiation of graphite have not been observed for the corresponding potassiation (Senyshyn et al., Reference Senyshyn, Dolotko, Mühlbauer, Nikolowski, Fuess and Ehrenberg2013; Sharma and Peterson, Reference Sharma and Peterson2013).
The time evolution of the individual K-GIC reflections was examined using single-peak fitting and results are shown in Figure 5 and Table II. The rate of change of the intensity was obtained by linear fitting of the data. The graphite 002 reflection shows a two-step process, gradually decreasing in relative intensity at −0.198(2) counts min−1 to 0.25 V, then more slowly at −0.0592(2) counts min−1 which corresponds to the appearance of the KC8 phase before disappearing. The stage one KC8 002 reflection intensity steadily increases at 0.0338(1) counts min−1, slower than the decay in the graphite reflection.

Figure 5. (Colour online) Results from single peak fitting of the (a) graphite 002 (R 2 = 0.98639 and 0.98121 sequentially) and KC8 002 (R 2 = 0.92657), (b) KC36 004 (R 2 = 0.67671 and 0.69858 sequentially), and (c) unknown KC x phase (R 2 = 0.4259) reflections plotted with the voltage profile. Dashed line shows the linear fit of the reflection intensity variation with time. Data in (a) and (b) are presented as fractional change from the maximum value, which was 85.45 counts for the graphite 002 reflection, 10.47 counts for the KC8 reflection, and 3.36 counts for the reflection in (b).
Table II. Rate of change of reflection intensities obtained from the linear fit to data shown in Figure 5.

Figures 5(b) and 5(c) show the time evolution of the KC36 004 reflection and the reflection for the unknown KC x reflection at 2θ = 14.6°. The results of these fits are less reliable due to their relatively weaker overall intensities. The KC36 004 reflection intensity grows at 0.0377(3) counts min−1 reaching a maximum at ~0.04 V before decreasing rapidly at a rate of −0.219(4) counts min−1 and disappearing. This suggests that the formation of the KC36 phase is relatively slow, but its transformation to a higher potassiated phase is much faster. Lastly, the formation of the unknown KC x phase is relatively slow, growing at 0.0447(8) counts min−1.
While a more detailed study is clearly warranted to fully determine and characterise the potassium intercalation phases of graphite, it can be clearly seen that the mechanism observed in this in situ study bears some significant differences compared to the previous ex situ studies. In particular, an earlier (in terms of potential) formation of the different stages of potassium intercalation compounds and a different order of appearance than previously observed (Jian et al., Reference Jian, Luo and Ji2015; Luo et al., Reference Luo, Wan, Ozdemir, Bao, Chen, Dai and Hu2015) was found.
IV. CONCLUSION
The first in situ XRD measurement of potassium-ion intercalation into graphite in a potassium-ion battery was undertaken. The K/graphite electrochemical cell produced a reversible capacity of 249 mAh g−1 which is comparable with the literature; however, it does not retain its capacity over a long period of cycling, also as expected. The in situ XRD study shows the transformation of the graphite phase to various potassium intercalation compounds. The sequence of the formation of various potassium intercalation phases is found to occur at different potentials than noted in previous work using ex situ XRD. Notably, we find the formation of stage three KC8 at the higher potential of 0.3 V. Thus, this study reveals the importance of studying in situ the formation of these phases in order to examine the non-equilibrium states of potassium-ion intercalation into graphite in potassium-ion batteries, promoting a deeper understanding of electrode function to realise commercial potassium-ion batteries.
ACKNOWLEDGEMENTS
James C. Pramudita would like to thank UNSW/ANSTO and AINSE for PhD scholarships. Neeraj Sharma would like to thank the Australian Research Council for support (DE160100237/DP170100269). Part of this research was undertaken on the Powder Diffraction beamline at the Australian Synchrotron, Victoria, Australia.