


Introduction
Atmospheric dust is potentially an important source of dissolved iron (DFe) which is the limiting nutrient required for primary production in vast regions of the remote Southern Ocean, including Antarctica’s marginal seas (Sedwick et al. Reference Sedwick, DiTullio and Mackey2000, Boyd et al. Reference Boyd, Mackie and Hunter2010). Despite being seasonally iron (Fe) limited, the high-nutrient, high-chlorophyll regime of the Ross Sea is the most biologically productive continental shelf region in Antarctica, and supports intense phytoplankton blooms in the summer (Arrigo et al. Reference Arrigo, van Dijken and Long2008). Although the flux of Fe into the Ross Sea plays a critical role in determining its productivity, the origin(s) of this Fe remains poorly constrained (Sedwick et al. Reference Sedwick, Marsay, Sohst, Aguilar-Islas, Lohan, Long, Arrigo, Dunbar, Saito, Smith and DiTullio2011).
Dust deposition in Antarctica
Global ‘background’ dust is characterized by fine particles having a mass modal diameter<5 µm, long atmospheric residence time and modern mass deposition rates in the order of 0.001–0.02 g m-2 yr-1 in the Southern Ocean (Wagener et al. Reference Wagener, Guieu, Losno, Bonnet and Mahowald2008 and references therein). The isolated, snow and ice-covered central East Antarctic Plateau (EAP) has proven to be an excellent location for investigating long-range transport of dust representative of the broader Southern Hemisphere, both at present and in the past (Delmonte et al. Reference Delmonte, Robert Petit, Basile-Doelsch, Jagoutz and Maggi2007, Reference Delmonte, Andersson, Hansson, Schöberg, Petit, Basile-Doelsch and Maggi2008). Moreover, the high EAP has much lower accumulation rates of ~ 0.0002–0.0006gm-2yr-1 during the Holocene (Albani et al. Reference Albani, Delmonte, Maggi, Baroni, Petit, Stenni, Mazzola and Frezzotti2012). Recently, it has become apparent that peripheral areas of the Antarctic ice sheet, close to high elevation ice-free mountain ranges, such as the Transantarctic Mountains (TAM), can receive significant additional dust inputs from exposed Antarctic sources, some of which have been ice-free for millions of years (Delmonte et al. Reference Delmonte, Baroni, Andersson, Narcisi, Salvatore, Petit, Scarchilli, Frezzotti, Albani and Maggi2013 and references therein).
The relative contribution of much smaller, patchy but proximal dust sources to the atmospheric dust load over Antarctica and the Southern Ocean is not well known. The largest expanse of contiguous ice-free ground in Antarctica is found in the McMurdo Dry Valleys, a series of west-to-east oriented, glacially carved valleys located between the high EAP and the Ross Sea in southern Victoria Land. However, the dustiest known place in Antarctica is located in the south-western (SW) Ross Sea, associated with the so-called ‘debris bands’ area on the McMurdo Ice Shelf (Kellogg et al. Reference Kellogg, Kellogg and Stuiver1990) (Fig. 1). In this region, dust deposition flux (~1 gm-2yr-1) is at least two orders of magnitude greater than fallout of long-range transported dust measured in ice cores from the EAP (Atkins & Dunbar Reference Atkins and Dunbar2009, Delmonte et al. Reference Delmonte, Baroni, Andersson, Narcisi, Salvatore, Petit, Scarchilli, Frezzotti, Albani and Maggi2013, Chewings et al. Reference Chewings, Atkins, Dunbar and Golledge2014) and is, potentially, an important source of bioavailable Fe to the Ross Sea (Winton et al. Reference Winton, Dunbar, Bertler, Millet, Delmonte, Atkins, Chewings and Andersson2014).
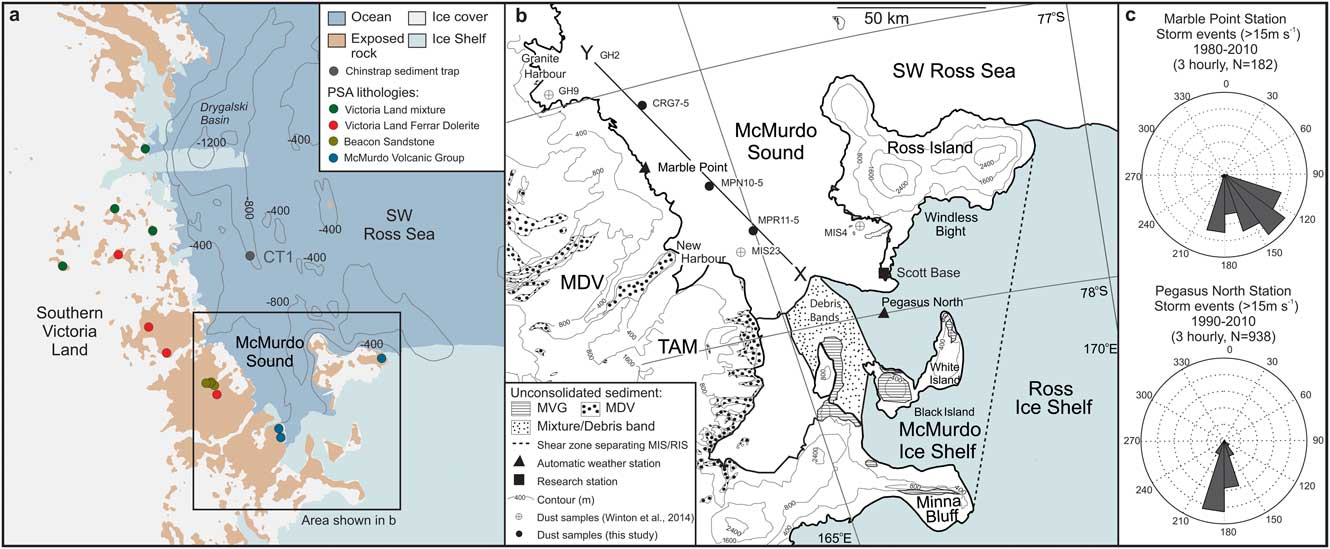
Fig. 1 a. Map of the south-western (SW) Ross Sea showing the location of SW Ross Sea Chinstrap sediment trap (CT1). b. Insert of McMurdo Sound within the SW Ross Sea showing location of McMurdo Sound snow on sea ice samples (solid: this study, cross: Winton et al. (Reference Winton, Dunbar, Bertler, Millet, Delmonte, Atkins, Chewings and Andersson2014), shaded: exposed areas of unconsolidated sediment). Samples are named based on their location: MP=Marble Point, CR=Cape Robert, GH=Granite Harbour, MIS=McMurdo Sea Ice, MDV=McMurdo Dry Valleys, MIS=McMurdo Ice Shelf, MVG=McMurdo Volcanic Group, RIS=Ross Ice Shelf, TAM=Transantarctic Mountains. c. Wind roses illustrating the direction of storm events at Pegasus North and Marble Point automatic weather stations (AWS). Locations of AWS shown in Fig. 1b. Modified from Winton et al. (Reference Winton, Dunbar, Bertler, Millet, Delmonte, Atkins, Chewings and Andersson2014).
Dust provenance in Antarctica can be determined from the 87Sr/86Sr and 143Nd/144Nd radiogenic isotope composition of dust in snow and ice by comparison with potential source areas (PSAs) (e.g. Delmonte et al. Reference Delmonte, Baroni, Andersson, Schoberg, Hansson, Aciego, Petit, Albani, Mazzola, Maggi and Frezzotti2010). This geochemical method allows mantle-derived (basaltic rocks, tephra and soils derived from them, weathered and eroded mafic rocks) and crustal-derived sediments and soils to be identified. Both the geochemical fingerprint and particle size of dust deposited on the EAP suggest it originates from arid regions in southern South America during glacial periods (Gaiero et al. Reference Gaiero, Brunet, Probst and Depetris2007, Delmonte et al. Reference Delmonte, Andersson, Hansson, Schöberg, Petit, Basile-Doelsch and Maggi2008). However, for dust deposition during interglacial periods, that is when dust input to inner Antarctica was extremely low, the source is less certain (Delmonte et al. Reference Delmonte, Robert Petit, Basile-Doelsch, Jagoutz and Maggi2007), and an Australian contribution is probable (Revel-Rolland et al. Reference Revel-Rolland, De Deckker, Delmonte, Hesse, Magee, Basile-Doelsch, Grousset and Bosch2006, Delmonte et al. Reference Delmonte, Robert Petit, Basile-Doelsch, Jagoutz and Maggi2007, Reference Delmonte, Andersson, Hansson, Schöberg, Petit, Basile-Doelsch and Maggi2008). In addition to atmospheric circulation, dust transport efficiency is dependent on particle size; for example, long-range dust deposited on the EAP has a mass modal size of around 2μm (Delmonte et al. Reference Delmonte, Petit and Maggi2002). When investigating the provenance of dust, the fractionation of Sr isotopes into different grain size fractions needs to be considered, as there is a correlation between grain size and 87Rb/86Sr ratios, and thus 87Sr/86Sr ratios. In coarse (fine) grained suspended particulate matter, Sr is enriched (depleted) in less radiogenic Sr isotopic ratios (e.g. Andersson et al. Reference Andersson, Wasserburg, Ingri and Stordal1994). In contrast, Nd isotopic ratios are not influenced to the same extent by particle size (e.g. Andersson et al. Reference Andersson, Wasserburg, Ingri and Stordal1994).
Iron fertilization in the Ross Sea
The Ross Sea is one of the most productive regions in the Southern Ocean and an important oceanic sink for atmospheric carbon dioxide (CO2) (e.g. Arrigo et al. Reference Arrigo, van Dijken and Long2008). The environmental factors responsible for controlling the rates of phytoplankton production and incomplete utilization of inorganic macronutrients include: grazing (Banse Reference Banse1991), temperature (Bunt & Wood Reference Bunt and Wood1963), light availability (e.g. Mitchell et al. Reference Mitchell, Brody, HolmHansen, McClain and Bishop1991), micro-nutrient availability (e.g. Fe and Mn) (Sedwick & DiTullio Reference Sedwick and DiTullio1997, Sedwick et al. Reference Sedwick, DiTullio and Mackey2000), or a combination of these (e.g. Arrigo et al. Reference Arrigo, DiTullio, Dunbar, Robinson, VanWoert, Worthen and Lizotte2000). Collier et al. (Reference Collier, Dymond, Honjo, Manganini, Francois and Dunbar2000) show that a Ross Sea diatom productivity event, captured during the 1996–97 deployment of moored Antarctic Environment and Southern Ocean Process Study (AESOPS) sediment traps, is correlated with elevated lithogenic particle accumulation rates, excess Fe (determined from high Fe/Al ratios), and with an early breakout of sea ice caused by katabatic winds. They go on to suggest that there may be a causal relationship between the retreat of sea ice, the supply of particulate Fe, and diatom production and export. The source of this lithogenic Fe to the Ross Sea is unknown but could be derived from either dust released into the ocean from melting sea ice from local and/or from distal sources, or new particulate Fe derived from ice shelves, icebergs, upwelling of resuspended continental sediments from the sea floor, Circumpolar Deep Water or some combination thereof.
Multiple sources of new Fe to the Ross Sea region have been identified, which include local dust sourced mainly from the McMurdo Ice Shelf (Atkins & Dunbar Reference Atkins and Dunbar2009, de Jong et al. Reference De Jong, Schoemann, Maricq, Mattielli, Langhorne, Haskell and Tison2013, Chewings et al. Reference Chewings, Atkins, Dunbar and Golledge2014, Winton et al. Reference Winton, Dunbar, Bertler, Millet, Delmonte, Atkins, Chewings and Andersson2014), sea ice melt (Sedwick & DiTullio Reference Sedwick and DiTullio1997, de Jong et al. Reference De Jong, Schoemann, Maricq, Mattielli, Langhorne, Haskell and Tison2013), and lithogenic sediments resuspended from the sea floor (Sedwick et al. Reference Sedwick, Marsay, Sohst, Aguilar-Islas, Lohan, Long, Arrigo, Dunbar, Saito, Smith and DiTullio2011, de Jong et al. Reference De Jong, Schoemann, Maricq, Mattielli, Langhorne, Haskell and Tison2013, Marsay et al. Reference Marsay, Sedwick, Dinniman, Barrett, Mack and McGillicuddy2014, Gerringa et al. Reference Gerringa, Laan, van Dijken, van Haren, De Baar, Arrigo and Alderkamp2015). However, the relative importance of these sources for stimulating primary production remains an open question. Winton et al. (Reference Winton, Dunbar, Bertler, Millet, Delmonte, Atkins, Chewings and Andersson2014) estimate that the supply of soluble aeolian Fe in dust from the debris bands, southern McMurdo Sound to the adjacent ocean could support up to ~ 15% of primary production in the area. The implication being that Fe supporting the remaining 85% of productivity was derived largely from other sources, such as lithogenic sediment resuspended from the sea floor (Sedwick et al. Reference Sedwick, Marsay, Sohst, Aguilar-Islas, Lohan, Long, Arrigo, Dunbar, Saito, Smith and DiTullio2011, de Jong et al. Reference De Jong, Schoemann, Maricq, Mattielli, Langhorne, Haskell and Tison2013, Marsay et al. Reference Marsay, Sedwick, Dinniman, Barrett, Mack and McGillicuddy2014, Gerringa et al. Reference Gerringa, Laan, van Dijken, van Haren, De Baar, Arrigo and Alderkamp2015, Kustka et al. Reference Kustka, Kohut, White, Lam, Milligan, Dinniman, Mack, Hunter, Hiscock, Smith and Measures2015, McGillicuddy et al. Reference McGillicuddy, Sedwick, Dinniman, Arrigo, Bibby, Greenan, Hofmann, Klinck, Smith, Mack, Marsay, Sohst and van Dijken2015).
As Fe is critical for seasonal phytoplankton growth in the Ross Sea, this study aimed to further investigate the source(s) of lithogenic Fe as a driver of the vast summer phytoplankton blooms in the SW Ross Sea by examining the provenance of lithogenic material sinking in the upper 200 m below sea level (m.b.s.l.) of the water column, and comparing its origin to both known local and global sources. This paper reports the Sr-Nd isotopic composition of i) size-selected dust from snow samples on sea ice from McMurdo Sound, and ii) sediment trap material from the Research on Ocean – Atmosphere Variability and Ecosystem Response in the Ross Sea (ROAVERRS) moorings programme (1996–98) that represents accumulation of sediment settling out of the water column. When investigating PSAs to Antarctica, previous studies have size-selected the PSA samples prior to Sr analysis to be comparable to that of the fine size range of dust deposited in Antarctica (Delmonte et al. Reference Delmonte, Andersson, Hansson, Schöberg, Petit, Basile-Doelsch and Maggi2008), and a similar approach is used here.
Methods
Samples used in this study for Nd and Sr isotopic ration and concentration analysis
Previous studies have focused on dust flux and particle size distribution patterns in McMurdo Sound (Atkins & Dunbar Reference Atkins and Dunbar2009, Dunbar et al. Reference Dunbar, Bertler and McKay2009, Chewings et al. Reference Chewings, Atkins, Dunbar and Golledge2014). This study is based on the following samples:
-
- Samples of dust-laden snow collected from sea ice along a south–north X–Y transect in McMurdo Sound, collected in November 2010 and described in Chewings et al. (Reference Chewings, Atkins, Dunbar and Golledge2014) and Winton et al. (Reference Winton, Dunbar, Bertler, Millet, Delmonte, Atkins, Chewings and Andersson2014) (Fig. 1b).
-
- A Ross Sea sediment trap sample from 200m.b.s.l., collected between 25 December 1997 and 3 January 1998 from the ROAVERRS programme Chinstrap site (76°20.5'S, 165°1.78'E) in the SW Ross Sea. This site was anchored in 830 m water depth in the southern extension of the Drygalski Basin (Fig. 1a).
Sample processing – McMurdo Sound surface snow on sea ice samples
The samples analysed in this work were size-selected in order to be comparable to provenance measurements made of dust from ice core PSAs and with similar studies on dust in Antarctica (e.g. Delmonte et al. Reference Delmonte, Basile-Doelsch, Petit, Maggi, Revel-Rolland, Michard, Jagoutz and Grousset2004, Reference Delmonte, Andersson, Hansson, Schöberg, Petit, Basile-Doelsch and Maggi2008, Reference Delmonte, Baroni, Andersson, Schoberg, Hansson, Aciego, Petit, Albani, Mazzola, Maggi and Frezzotti2010). Both the bulk (all particle sizes) and fine (< 10 µm) fraction of McMurdo Sound dust were analysed to check for particle size induced bias in the isotopic fractionation of samples. The coarse fraction was removed from bulk samples by using a pre-washed 10 µm SEFAR Nitex® open mesh while the fraction 0.4 µm<∅<10 µm was collected on 0.4 µm Isopore™ polycarbonate membranes. After filtration the membranes were put into pre-cleaned Corning® tubes filled with ~ 10 ml of ultra-pure water, and micro-particles were removed from the filter by sonication. Samples were transported to the Department of Geosciences, Swedish Museum of Natural History, Sweden, where the liquid was evaporated in acid-cleaned 15 ml Savillex® beakers. Dry dust samples, ranging between 0.1 and 1.2 mg, were weighed a minimum of five times to obtain a mean weight, which was used for subsequent calculations.
Sample processing – sediment trap samples
Isotopic analysis of bulk sediment revealed that the biogenic fraction of the sediment (up to 70% total mass estimated from AESOPS sediment trap data reported in Collier et al. (Reference Collier, Dymond, Honjo, Manganini, Francois and Dunbar2000)) incorporated marine Sr, and thus the isotopic signature could not be distinguished from that of seawater (Table I). To remove the biogenic silica and calcium carbonate fraction, the sediment was leached with 6 M HCl in Savillex® beakers and centrifuged following the method of Freydier et al. (Reference Freydier, Michard, De Lange and Thomson2001). The lithogenic residue was then rinsed three times with ultra-pure water and dried.
Table I Nd and Sr concentrations and isotopic composition of McMurdo Sound and Chinstrap sediment trap samples analysed in this study.
a Internal precision, 2 standard errors of the mean.
b Nd isotopic ratios expressed as epsilon units εNd(0)=[(143Nd/144Nd)sample/(143Nd/144Nd)CHUR-1]x104; CHUR=chondritic uniform reservoir.
c Uncertainty estimates based upon external precision for standard runs. Internal precision is used if it exceeds the external.
d Internal precision, 2 standard errors of the mean.
e Corrected to a NBS987 87Sr/86Sr ratio of 0.710245.
f Uncertainty estimates based upon external precision for standard runs. Internal precision is used if it exceeds the external.
Sample digestion
The chemical treatment of the dust samples and leached sediment, including digestion and elemental separation (Rb-Sr and Sm-Nd) using ion exchange chromatography, was performed at the Swedish Museum of Natural History following the established method of Delmonte et al. (Reference Delmonte, Andersson, Hansson, Schöberg, Petit, Basile-Doelsch and Maggi2008). The samples were spiked with a mixed 147Sm/150Nd spike and 84Sr-enriched spike for the isotope dilution determination of the concentrations. Samples were digested in an acid mixture of 1.5 ml of HNO3, HF and HClO4 heated to 90°C in closed Savillex® beakers for 24 h. The solution was evaporated to complete dryness on a hot plate and the residue re-dissolved in 4 ml 6 M HCl.
Ion exchange
To achieve separation of potential interfering elements (Fe, Ba, Rb, Sm, Ce and Pr), and obtain high column yield and low blanks, the residue was subjected to chemical procedures described in Delmonte et al. (Reference Delmonte, Andersson, Hansson, Schöberg, Petit, Basile-Doelsch and Maggi2008). The total blank, including dissolution, chemical separation and mass spectrometry, was frequently monitored in each ion exchange batch and blank concentrations were<5 pg for Nd and<130 pg for Sr.
Mass spectrometry
Isotopic analysis of Nd and Sr was performed with a Thermo Scientific TRITON Thermal Ionisation Mass Spectrometer. Neodymium was loaded mixed with colloidal graphite, Alfa Aesar, on double rhenium filaments and analysed as metal ions in static mode using rotating gain compensation. Concentrations and ratios were calculated assuming exponential fractionation. The calculated ratios were normalized to 146Nd/144Nd=0.7219. Epsilon units are calculated as follows:
 $$\eqalignno{ {\rm {\rvarepsilon}}_{{{\rm Nd}}} ( {\rm 0} \right){\rm \,{\equals}\,} [ {( {{}^{{{\rm 143}}}{\rm Nd/}^{{{\rm 144}}} {\rm Nd}} \right)_{{{{\!}\rm sample}}} {\rm /}( {{}^{{{\rm 143}}}{\rm Nd\,/}^{{{\rm 144}}} {\rm Nd}} )_{\rm CHUR}\:{\rm {{\hbox }^{-1}}}} ]{\rm {\times}}\!{\rm 10}^{{\rm 4}} {\rm ,}\cr$$
where CHUR is the chondritic uniform reservoir with (143Nd/144Nd)CHUR=0.512638.
The external precision for 143Nd/144Nd is estimated from analysis of the nNdβ standard (Wasserburg et al. Reference Wasserburg, Jacousen, DePaolo, McCulloch and Wen1981) by analysing a range, 4–12 ng loads, of nNdβ standard. The external precision becomes larger for smaller loads, with an estimated precision of ~ 40 ppm for small loads, ~ 30 ppm for intermediate loads and ~ 20 ppm for larger loads. These values have been used to estimate the errors for the samples shown in Table I. The mean 143Nd/144Nd ratio for the nNdβ was 0.511895±22 (n=20). Literature values for repeated analysis of standard nNdβ (Andreasen & Sharma Reference Andreasen and Sharma2006) yielded 143Nd/144Nd=0.511892±3 (2σ, n=23), and thus no accuracy correction was applied.
Purified Sr samples were mixed with tantalum activator and loaded on a single rhenium filament. Two hundred 8 s integrations were recorded in multi-collector static mode, applying a rotating gain compensation. Measured 87Sr intensities were corrected for Rb interference assuming 87Rb/85Rb=0.38600, and ratios were calculated using the exponential fractionation law and 88Sr/86Sr=8.375209. External precision for 87Sr/86Sr, estimated from analysing NBS SRM987 standard, was calculated as ±0.000016 (n=12), while repeated measurements of prepared CIT #39 seawater gave a reproducibility of ±0.0000082 or 12 ppm (n=21) which was taken to be the best estimate of the external precision. Accuracy correction was applied to the 87Sr/86Sr ratios corresponding to a 87Sr/86Sr ratio of 0.710245 for NBS SRM 987 standard (NBS 987: literature value 0.710245, Department of Geosciences value 0.710217±16 (n=12); difference: 0.000028).
The accuracy of the Nd and Sr isotopic composition of small dust samples was determined using the Basalt Columbia River rock standard (BCR-2), a certified reference material. Preparation and analysis of 150–600 µg aliquots of BCR-2 in each batch of ion exchange resulted in a recovery of>79% (n=6) for concentration and>99% (n=6) for isotopic composition. Due to the small dust samples and the difficulty of weighing such small masses an Sr and Nd concentration error of ±10% was estimated by repeated weighing of BCR-2 standards (~ 0.3 mg).
Results
The Sr and Nd isotopic composition of dust are primarily related to lithology and geologic age of parent materials, although the Sr isotopic composition, for particles between 2–50 µm, can also be influenced by size. The Sr and Nd isotopic composition of the fine (<10 µm) and bulk (all sizes included) dust samples collected in this study are well characterized and reported in Table I and Fig. 2 along with additional isotopic data from McMurdo Sound measured in an earlier study (Winton et al. Reference Winton, Dunbar, Bertler, Millet, Delmonte, Atkins, Chewings and Andersson2014). Samples in Fig. 2 are grouped by geographical location. The samples collected from the snow on sea ice in McMurdo Sound display a narrow isotopic composition (0.70533<87Sr/86Sr<0.70915 and -1.1<εNd(0)<3.45). Our fine dust (<10 µm) samples have relatively higher 87Sr/86Sr ratios compared to the bulk samples (Fig. 2), consistent with previous studies of size-dependent fractionation (Andersson et al. Reference Andersson, Wasserburg, Ingri and Stordal1994). The Nd isotopes do not fractionate with the particle size (with the exception of MPN10-5 which could be related to the different size fractions originating from different sources; Fig. 2), also consistent with previous studies. The Δ87Sr/86Sr is ~ 0.00115, that is slightly smaller than the 87Sr/86Sr increase of ~0.0028 units observed between 63 µm and 2 µm dust particles by Gaiero et al. (Reference Gaiero, Brunet, Probst and Depetris2007). The isotopic ratios of leached (lithogenic sediment fraction) and unleached (lithogenic and biogenic sediment fraction) Ross Sea sediment obtained from the upper Chinstrap sediment trap (200 m.b.s.l.) are reported in Table I. Leaching had a significant effect on the Sr isotopic ratio of this sample and removed an Sr seawater overprint from the sediment. After leaching, the remaining lithogenic sediment has an isotopic signature between the McMurdo Volcanic Group (MVG) and southern Victoria Land PSAs (Fig. 2).
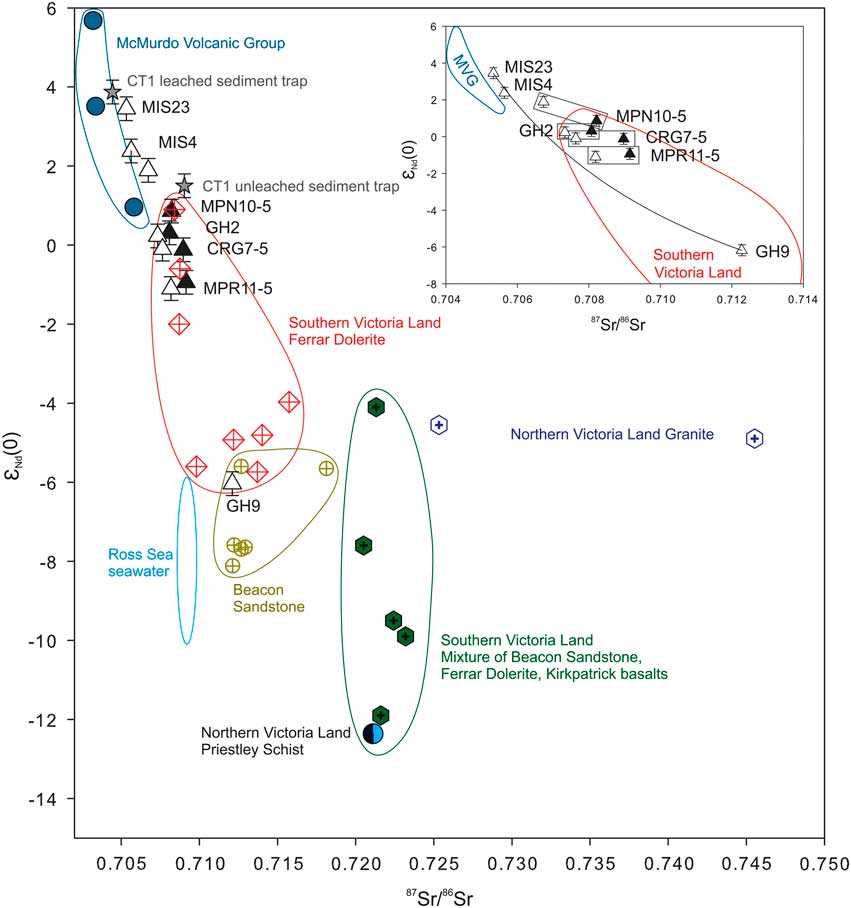
Fig. 2. Nd and Sr isotope signature of fine (black triangles) and bulk (white triangles) McMurdo Sound dust, including bulk McMurdo Sound data (GH9, MIS4 and MIS23; Winton et al. Reference Winton, Dunbar, Bertler, Millet, Delmonte, Atkins, Chewings and Andersson2014), and leached and unleached Chinstrap sediment trap material. Data from southern Victoria Land potential dust sources that include different parent lithologies shown in Fig. 1 (Delmonte et al. Reference Delmonte, Basile-Doelsch, Petit, Maggi, Revel-Rolland, Michard, Jagoutz and Grousset2004, Reference Delmonte, Baroni, Andersson, Schoberg, Hansson, Aciego, Petit, Albani, Mazzola, Maggi and Frezzotti2010, Reference Delmonte, Baroni, Andersson, Narcisi, Salvatore, Petit, Scarchilli, Frezzotti, Albani and Maggi2013) and the isotopic composition of Ross Sea seawater (Elderfield Reference Elderfield1986, Basak et al. Reference Basak, Pahnke, Frank, Lamy and Gersonde2015) are also plotted. Insert top right: McMurdo Sound dust highlighting the fractionation between fine and coarse particle sizes and a hypothetical mixing line between the two end members McMurdo Volcanic Group and southern Victoria Land, Transantarctic Mountains.
Discussion
Dust provenance - McMurdo Sound
The overwhelming majority of dust deposited in snow on sea ice in McMurdo Sound is locally sourced. It is not possible to detect any contribution from South American or Australian sources with our approach. Sedimentological, meteorological and geochemical evidence consistently points to the debris bands on the McMurdo Ice Shelf (Kellogg et al. Reference Kellogg, Kellogg and Stuiver1990) as the dominant local dust source in the McMurdo Sound region (Fig. 1) (Atkins & Dunbar Reference Atkins and Dunbar2009, Chewings et al. Reference Chewings, Atkins, Dunbar and Golledge2014, Winton et al. Reference Winton, Dunbar, Bertler, Millet, Delmonte, Atkins, Chewings and Andersson2014). Studies of spatial variability of dust and particle size for the greater McMurdo Sound region show a distinct decrease in particle size and dust flux along transect X–Y (Fig. 1b) as part of a dust plume extending northwards from the debris bands (Atkins & Dunbar Reference Atkins and Dunbar2009, Chewings et al. Reference Chewings, Atkins, Dunbar and Golledge2014). As the plume extends northwards away from the debris bands the particle size and dust accumulation rate decrease, although secondary elevated patches of both occur near coastal headlands. Overall, dust accumulation declines exponentially from 55gm-2yr-1 near the debris bands to ~0.2gm-2yr-1 120 km north of the debris bands (Atkins & Dunbar Reference Atkins and Dunbar2009, Chewings et al. Reference Chewings, Atkins, Dunbar and Golledge2014). This northward dust dispersal is consistent with the local meteorology whereby the highest wind speeds, i.e. those most competent with respect to entraining silt and fine sand, are predominately from the south (Fig. 1c), dispersing dust from the debris bands north along the southern Victoria Land coastline.
In addition to sedimentological considerations, geochemical evidence also points to dust being locally sourced. The Sr isotopic composition of modern seawater is homogenous (87Sr/86Sr=0.70924; Elderfield Reference Elderfield1986), and has a similar Sr isotopic composition to the geology in McMurdo Sound (Fig. 2). However, the Nd isotopic composition of the local geology and Ross Sea seawater (-10<εNd(0)<-6; Basak et al. Reference Basak, Pahnke, Frank, Lamy and Gersonde2015) is distinguished in Fig. 2, and combined with other provenance indicators (coarse particle size, high dust flux and Fe/Al elemental ratios; Atkins & Dunbar Reference Atkins and Dunbar2009, de Jong et al. Reference De Jong, Schoemann, Maricq, Mattielli, Langhorne, Haskell and Tison2013) allows tracing of dust to local PSAs. Winton et al. (Reference Winton, Dunbar, Bertler, Millet, Delmonte, Atkins, Chewings and Andersson2014) report two Sr and Nd isotopic ratios of the bulk sediment from snow on sea ice in southern McMurdo Sound and one from Granite Harbour (Fig. 1). The values are consistent with dust originating from MVG, although within the Granite Harbour embayment there is also evidence for dust derived from TAM lithologies. The possibility that the volcanic signature of McMurdo Sound dust on sea ice is derived from volcanic rocks in Marie Byrd Land can be ruled out (0.7026<87Sr/86Sr<0.7032 and 1.99<εNd(0)<6.87) (Futa & LeMasurier Reference Futa and LeMasurier1983, Hole & LeMasurier Reference Hole and LeMasurier1994) due to the northerly direction of the prevailing winds (Chewings et al. Reference Chewings, Atkins, Dunbar and Golledge2014).
Consequently, only local PSAs are considered for comparison to the new isotopic dataset. Overall, the Sr isotopic ratios for McMurdo Sound samples analysed in this study, and in Winton et al. (Reference Winton, Dunbar, Bertler, Millet, Delmonte, Atkins, Chewings and Andersson2014), are tightly grouped and range between 0.705<87Sr/86Sr<0.709 while εNd(0) ranges between 3.45<εNd(0)<-1.1. These new isotopic data form a linear array in Fig. 2. McMurdo Sound dust can be considered the result of a two-component mixture derived from isotopically distinct end-members: i) the MVG volcanic rocks and ii) southern Victoria Land lithologies found in the TAM, such as Ferrar Dolerites and sandstones of the Beacon Supergroup (Fig. 2). The narrow range of isotopic ratios of McMurdo Sound dust along the south–north transect X–Y represents northwards dust dispersal downwind from the debris bands, that is a mixture of TAM and MVG sources, with minor localized additions of TAM dust input from coastal outcrops from New Harbour and Marble Point that contribute to the dominant south to north dust plume (Fig. 1). This is consistent with field observations showing sediment on the McMurdo Ice Shelf debris bands is itself a mixture of MVG and TAM lithologies (Kellogg et al. Reference Kellogg, Kellogg and Stuiver1990).
Previous studies have shown dust deposited within embayments or adjacent to headlands along the south Victoria Land coastline is not widely dispersed (Barrett et al. Reference Barrett, Pyne and Ward1983, de Jong et al. Reference De Jong, Schoemann, Maricq, Mattielli, Langhorne, Haskell and Tison2013, Chewings et al. Reference Chewings, Atkins, Dunbar and Golledge2014). Within the narrow range of isotopic ratios of McMurdo Sound dust, GH9 is isotopically distinct and displays a dominant TAM signature (Fig. 2). This sample is not situated under the main northward-directed dust plume and hence represents localized dust accumulation within the Granite Harbour embayment (Fig. 1). In contrast, the isotopic composition of GH2 lies within the tight cluster of McMurdo Sound dust and thus highlights that the mass of dust on the sea ice immediately seawards of Granite Harbour originates from the south. A single source from the debris bands is also consistent with Fe concentrations within dust samples that were uniform along the transport pathway (Winton et al. Reference Winton, Dunbar, Bertler, Millet, Delmonte, Atkins, Chewings and Andersson2014).
Dust provenance - south-western Ross Sea
The isotopic signature of the lithogenic fraction of sediment from the upper 200 m.b.s.l. Chinstrap sediment trap, located ~170 km north of the debris bands (87Sr/86Sr=0.704, εNd(0)=3.9), falls outside of the isotopic range of dust originating in Australia (0.709<87Sr/86Sr<0.763,-2.9<εNd(0)<-15.4; Delmonte et al. Reference Delmonte, Basile-Doelsch, Petit, Maggi, Revel-Rolland, Michard, Jagoutz and Grousset2004, Revel-Rolland et al. Reference Revel-Rolland, De Deckker, Delmonte, Hesse, Magee, Basile-Doelsch, Grousset and Bosch2006) and South America (0.704<87Sr/86Sr<0.713, -8.9<εNd(0)<-8.3; Delmonte et al. Reference Delmonte, Basile-Doelsch, Petit, Maggi, Revel-Rolland, Michard, Jagoutz and Grousset2004). These two potential Southern Hemisphere sources supply dust to the high elevation EAP at very low deposition rates (e.g. Delmonte et al. Reference Delmonte, Andersson, Hansson, Schöberg, Petit, Basile-Doelsch and Maggi2008). The signature of the lithogenic fraction of sediment from SW Ross Sea (Chinstrap) matches that of the local geology and dust on sea ice in McMurdo Sound. Thus, the lithogenic particles, and their associated Fe, collected here are ‘locally’ sourced from the Ross Sea region (Fig. 2).
Dust transport and deposition - south-western Ross Sea
Deposition of local dust into the SW Ross Sea can occur by direct atmospheric fallout into ice-free surface waters, and release into surface waters by sea ice melt associated with subsequent northwards advection (Atkins & Dunbar Reference Atkins and Dunbar2009, de Jong et al. Reference De Jong, Schoemann, Maricq, Mattielli, Langhorne, Haskell and Tison2013, Chewings et al. Reference Chewings, Atkins, Dunbar and Golledge2014). The geographical area over which local dust is transported into the Ross Sea, and hence contributes to Fe fertilization, is potentially large. Although dust accumulation measurements only exist up to 120 km from the debris bands and decrease exponentially from the source, local dust deposition probably extends far beyond this point. Extrapolating the dust flux trend observed by Chewings et al. (Reference Chewings, Atkins, Dunbar and Golledge2014) suggests that the Chinstrap site may represent a northern extension of the dust and DFe dispersal pattern reported by Winton et al. (Reference Winton, Dunbar, Bertler, Millet, Delmonte, Atkins, Chewings and Andersson2014). The estimated annual accumulation rate from aeolian dust at the Chinstrap site is ~ 0.01 g m-2 yr-1, although we do not have accumulation rate data from the Chinstrap sediment trap with which to compare this estimate. Whether or not locally sourced aeolian sediment is the main source of the lithogenic sediment in the Chinstrap site remains somewhat of an open question. However, when the relationship between DFe and phytoplankton productivity in McMurdo Sound is considered we suggest this is unlikely to be the case (Fig. 3).
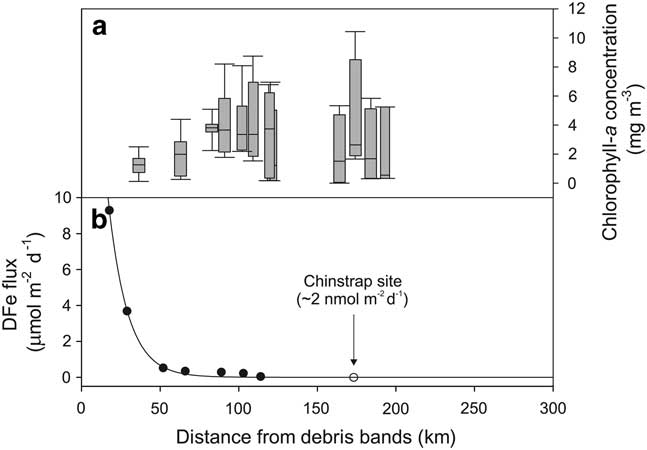
Fig. 3 a. Rate of primary production with distance from McMurdo Sound. As the dust flux exponentially decreases, the rate of primary production increases. Primary production inferred from the annual mean chlorophyll a concentration (2000–09) in the McMurdo Sound polynya (72.0°S–78.083°S, 160.916°E–179.040°W) from SeaWiFS satellite data (http://giovanni.gsfc.nasa.gov). b. Extrapolation of the annual DFe flux from McMurdo Sound into the south-western Ross Sea (DFe data sourced from Winton et al. (Reference Winton, Dunbar, Bertler, Millet, Delmonte, Atkins, Chewings and Andersson2014)). The predicted dust flux at the Chinstrap site is estimated at ~0.01 gm-2yr-1 with a corresponding DFe flux of ~2 nmolm-2d-1.
Implications for iron fertilization
By extrapolating the dust flux trend observed by Chewings et al. (Reference Chewings, Atkins, Dunbar and Golledge2014) and its associated contribution to DFe (Winton et al. Reference Winton, Dunbar, Bertler, Millet, Delmonte, Atkins, Chewings and Andersson2014) into the SW Ross Sea, the upper bound of the DFe at the Chinstrap site from the debris bands can be estimated (Fig. 3). Assuming a lithogenic dust flux of ~ 0.01 g m-2 yr-1 and an associated total Fe content of 4% and 11% of this Fe is soluble (Winton et al. Reference Winton, Dunbar, Bertler, Millet, Delmonte, Atkins, Chewings and Andersson2014), the maximum DFe flux is estimated to be ~ 2 nmol m-2 d-1 to the Chinstrap site (Fig. 3). However, when this is considered relative to the spatial distribution of primary production in the SW Ross Sea, using averaged annual Sea-Viewing Wide Field-of-View Sensor (SeaWiFS) satellite chlorophyll a data, the gradient in increasing chlorophyll a concentration with distance from the debris bands within the McMurdo Sound polynya does not match the pattern of decreasing dust accumulation (Fig. 3). This pattern suggests that DFe from dust does not regulate growth in the SW Ross Sea. A seasonal phytoplankton bloom occurs in the McMurdo Sound polynya SW Ross Sea each summer and is dominated by diatoms. The rate of primary production is greatest in the centre of the McMurdo Sound polynya. As the dust flux decreases and primary production increases with distance from McMurdo Sound, it is difficult to reconcile these patterns at the Chinstrap site assuming only a local dust source (Fig. 3).
Some further insight into the origin of sediment in the water column in the SW Ross Sea may be inferred from the data published by Collier et al. (Reference Collier, Dymond, Honjo, Manganini, Francois and Dunbar2000). They show a significantly elevated lithogenic accumulation rate in deep AESOPS sediment traps compared to accumulation rates measured in the upper AESOPS sediment traps at other sites in the Ross Sea (e.g. MS-7; 76°30'S, 178°1'W). In addition, lithogenic Fe fluxes between 1–90 µg m-2 d-1 have been measured for the upper 200 m.b.s.l. AESOPS trap (MIS-7b) and 40–850 µg m-2 d-1 for the deep trap (MS-7a). The greater mass of sediment and lithogenic Fe flux in the deep traps in the Ross Sea highlight that concentrations of suspended sediment in the water column at these sites cannot simply result from sediment input at the surface (whereby the accumulation in each trap would be the same regardless of depth). Instead, the increase in accumulation with depth probably reflects resuspension and horizontal near-bottom transport processes. While we do not have the data to constrain these processes at Chinstrap we infer, based on the provenance of the lithogenic sediment and distance from known local sources, that the lithogenic sediment accumulating there is most probably dominated by resuspended bottom sediments, potentially from sills either side of the Drygalski Basin but also locally sourced material falling through the water column sourced from atmospheric deposition or ice rafting. Although no Fe flux data for the Chinstrap site are available, future work could examine the relationship between Fe fluxes in the Chinstrap sediment trap and those DFe fluxes reported for locally derived dust at McMurdo Sound.
Despite McMurdo Sound representing the upper bound of locally derived dust and associated DFe to Antarctic waters, previous studies have ruled out local dust as the major source of DFe supply for phytoplankton blooms in the Ross Sea. Dissolved Fe in McMurdo Sound dust can only support up to 15% of primary production in the region (Winton et al. Reference Winton, Dunbar, Bertler, Millet, Delmonte, Atkins, Chewings and Andersson2014). Furthermore, based on regional scale estimates of dust deposition to the Southern Ocean, primary production triggered by long-range transported dust is likely to be less significant than local dust (e.g. Edwards & Sedwick Reference Edwards and Sedwick2001). Evidence from the extrapolation of the mass accumulation rate to the upper 200 m.b.s.l. Chinstrap trap, the sedimentological study of Chewings et al. (Reference Chewings, Atkins, Dunbar and Golledge2014), sedimentation in the water column, and the low contribution of local aeolian DFe to phytoplankton blooms, suggest that it is unlikely that aeolian dust deposition is the dominant process by which lithogenic Fe is supplied to the water column in the SW Ross Sea. Considered together, these lines of evidence point to a combination of resuspended bottom sediments with smaller additions of local dust sourced from atmospheric deposition or ice rafting as the sources of Fe-bearing sediment to the water column in the SW Ross Sea.
More broadly, Sedwick et al. (Reference Sedwick, Marsay, Sohst, Aguilar-Islas, Lohan, Long, Arrigo, Dunbar, Saito, Smith and DiTullio2011) noted that the phytoplankton-Fe limitation must be overcome by continuous replenishment from new sources to sustain the significant biomass observed over summer. They considered the following as potential sources of new DFe: vertical mixing, lateral advection, aerosol input and dissolution of particulate Fe from any or all of these sources. Consistent with upwelling of DFe as a major source of DFe in the Ross Sea, Marsay et al. (Reference Marsay, Sedwick, Dinniman, Barrett, Mack and McGillicuddy2014) reported high DFe concentrations within 50 m of the sea floor in the summer of 2012. Most recently, Gerringa et al. (Reference Gerringa, Laan, van Dijken, van Haren, De Baar, Arrigo and Alderkamp2015) measured seawater DFe concentrations in the 2013–14 summer, and concluded that DFe from the sea floor and land mass sediments are the main sources of DFe which support phytoplankton in the upper mixed layer of the Ross Sea polynya in the early summer. Similarly, phytoplankton blooms in the Pennell Bank region of the Ross Sea are supported by upwelling of DFe (Kustka et al. Reference Kustka, Kohut, White, Lam, Milligan, Dinniman, Mack, Hunter, Hiscock, Smith and Measures2015). However, Kustka et al. (Reference Kustka, Kohut, White, Lam, Milligan, Dinniman, Mack, Hunter, Hiscock, Smith and Measures2015) also highlight the spatial variability of processes supplying DFe in the Ross Sea. For example, circulation patterns around bathymetric features can alter the input of DFe from increased upwelling rates and higher concentrations of DFe. Numerical modelling of DFe supply by McGillicuddy et al. (Reference McGillicuddy, Sedwick, Dinniman, Arrigo, Bibby, Greenan, Hofmann, Klinck, Smith, Mack, Marsay, Sohst and van Dijken2015) suggests that the largest sources to the euphotic zone are wintertime mixing and melting sea ice (e.g. Sedwick & DiTullio Reference Sedwick and DiTullio1997, de Jong et al. Reference De Jong, Schoemann, Maricq, Mattielli, Langhorne, Haskell and Tison2013) with smaller inputs from Circumpolar Deep Water and from melting glacial ice.
Conclusions
Dust extracted from surface snow on McMurdo Sound sea ice enables us to document the present day provenance of dust reaching the SW Ross Sea. Based on our measurements of Sr and Nd isotopic ratios of dust deposited in surface snow on sea ice at McMurdo Sound and in the Chinstrap sediment trap in the SW Ross Sea we conclude the following: i) The Sr and Nd isotopic signature of lithogenic sediment from the upper Chinstrap sediment trap in the SW Ross Sea (εNd(0)=3.9, 87Sr/86Sr=0.70434) matches local dust sources. ii) McMurdo Sound has been well characterized in terms of the Sr and Nd isotopic composition of locally derived dust deposited on sea ice. Dust found there displays a narrow isotopic field between 0.70533<87Sr/86Sr<0.70819 and -1.1<εNd(0)<3.45 for the bulk fraction and 0.70807<87Sr/86Sr<0.70915 and -0.94<εNd(0)<0.86 for the fine fraction. Due to Sr isotopic fractionation with particle size, the signature of the fine fraction adds to the PSA database for comparison to Antarctic ice core dust provenance studies. iii) Locally derived dust from McMurdo Sound is unlikely to be the major source of DFe for seasonal phytoplankton blooms in the SW Ross Sea. Although, Sr and Nd isotopic ratios of local dust on sea ice show similarities to lithogenic marine sediment, we acknowledge the limited transport distance of coarse-sized dust in this region. As dust transport varies from year to year, we cannot completely exclude the possibility that local dust can contribute to DFe to the greater Ross Sea region although this is not the dominant source of lithogenic Fe. iv) We surmise that there is significant remobilization and upwelling of Fe from the sea floor that contributes to Fe fertilization of phytoplankton during the summer in the SW Ross Sea. Finally, v) source information of dust inputs to regions, such as the Ross Sea, improves the ability to predict how such supply will change as the climate changes. As local sources are important to the SW Ross Sea, this data could be included in models that predict changes in snow and ice cover in the region.
Acknowledgements
We would like to thank Antarctica New Zealand and Scott Base personnel for logistics support. Thank you to Jane Chewings, Associate Professor Brent Alloway and Assistant Professor Ana Aguilar-Islas for the collection of McMurdo Sound and Granite Harbour dust samples. Additional thanks to Professor Robert Dunbar for Chinstrap sediment trap samples from the ROAVERRS mooring programme. V.H.L.W would like to thank Curtin University (Australian Postgraduate Award and Curtin Research Scholarship) and Antarctic Science (Antarctic Science Bursary) for scholarship and other funding support. This project was funded by Curtin University (Curtin Research Fellowship to R.E.: RES-SE-DAP-AW-47679-1), and New Zealand Ministry of Science and Innovation through contracts to Victoria University of Wellington (Contracts: VUW0704; RDF-VUW1103) and GNS Science (Contracts: 540GCT32; C05X1001). Isotopic analyses for provenance characterization were carried out at the Swedish Museum of Natural History and were supported by the Department of Geosciences, Swedish Museum of Natural History. Thank you to Karin Wallner and Hans Schöberg for technical support. The isotopic dataset for this paper is freely available from the Curtin University Research Data repository http://doi.org/10.4225/06/5643EBA1C8473. The chlorophyll a data was obtained freely from the Sea-Viewing Wide Field-of-View Sensor (http://giovanni.gsfc.nasa.gov/). Additional thanks for the helpful comments and suggestions of Jeroen de Jong and an anonymous reviewer that aided in revision of this manuscript.
Author contributions
V.H.L.W, G.B.D, C.B.A and N.A.N.B designed the research; G.B.D and C.B.A collected the samples; V.H.L.W, B.D and P.S.A prepared the samples and analysed the data; V.H.L.W, G.B.D, C.B.A, B.D and P.S.A evaluated the data; all authors contributed to the interpretation of the data and the writing of the manuscript.


