


Introduction
Autism spectrum disorders (ASDs) are neurodevelopmental conditions characterized by severe impairment in reciprocal social interactions and communication skills, and the presence of restricted, stereotypical behaviors (APA, 2000). ASDs commence in early childhood, follow a persistent course and are highly disabling (Newschaffer et al. Reference Newschaffer, Croen, Daniels, Giarelli, Grether, Levy, Mandell, Miller, Pinto-Martin, Reaven, Reynolds, Rice, Schendel and Windham2007). Despite the high community and individual cost of ASDs (Kogan et al. Reference Kogan, Strickland, Blumberg, Singh, Perrin and van Dyck2008), these disorders have received little attention in the global public health arena. This has major implications in terms of the effective prioritization of health and community services.
In the past decade, there have been reports that childhood community rates of ASDs are higher than previously thought (Lauritsen et al. Reference Lauritsen, Pedersen and Mortensen2004; Chakrabarti & Fombonne, Reference Chakrabarti and Fombonne2005; Baird et al. Reference Baird, Simonoff, Pickles, Chandler, Loucas, Meldrum and Charman2006). Reported prevalence estimates range widely from 0.02% in Norway (Sponheim & Skjeldal, Reference Sponheim and Skjeldal1998) to 0.9% in South Korea (Kim et al. Reference Kim, Leventhal, Koh, Fombonne, Laska, Lim, Cheon, Kim, Kim, Lee, Song and Grinker2011) for autistic disorder, and from 0.06% in Venezuela (Montiel-Nava & Pena, Reference Montiel-Nava and Pena2008) to 1.7% in South Korea (Kim et al. Reference Kim, Leventhal, Koh, Fombonne, Laska, Lim, Cheon, Kim, Kim, Lee, Song and Grinker2011) for other ASDs. However, study methodology is highly variable, making it difficult to compare and pool findings to arrive at a comprehensive picture of the distribution of ASDs.
For the first time, the Global Burden of Disease (GBD) initiative has considered childhood-onset mental disorders including attention-deficit/hyperactivity disorder (ADHD), conduct disorder (CD) and ASDs within the scope of the mental disorder burden. The GBD framework was developed for the 1993 World Development Report (World Bank, 1993) and uses disorder-specific information on mortality, prevalence and disability to estimate years of life lost due to premature mortality (YLLs) and years lived with disability (YLDs). YLLs and YLDs are aggregated into disability-adjusted life years (DALYs), an overall summary measure of health loss. The three major aims of the latest study (GBD 2010) were to systematically describe the epidemiology of disease across populations, provide comparative measures of health loss across all major diseases (incorporating fatal and non-fatal outcomes) and assess spatial and temporal differences in population health (Murray et al. Reference Murray, Ezzati, Flaxman, Lim, Lozano, Michaud, Naghavi, Salomon, Shibuya, Vos, Wikler and Lopez2012).
The achievement of these aims has not been without challenges, particularly with regard to ASDs. The epidemiological data for ASDs are sparse at best, particularly in older people and low- and middle-income (LMI) countries. The available data are based on inconsistently defined disorder categories and variable approaches to sample ascertainment, for instance relying on clinically coded data such as administrative area registries, school data and, less commonly, community case-finding surveys. These factors make it difficult to synthesize the information on the prevalence and health outcomes of ASDs.
This study builds on the 2013 Lancet report, which provided a broad overview of the global burden of mental and substance use disorders (Whiteford et al. Reference Whiteford, Degenhardt, Rehm, Baxter, Ferrari, Erskine, Charlson, Norman, Flaxman, Johns, Burstein, Murray and Vos2013). Whiteford and colleagues reported that mental and substance use disorders collectively were the most disabling of all disease and injury categories in 2010. In the current study we focused on the epidemiological models and burden of ASDs, disaggregating the specific burden due to autistic disorder and other ASDs. Here, we: (1) report the results of the systematic review for epidemiological data; (2) use these data to generate global and regional prevalence estimates for autistic disorder and other ASDs; and (3) estimate the burden of disease attributable to autistic disorder and other ASDs for 1990 and 2010, benchmarking ASDs in comparison to other mental disorders with onset in childhood. Implications from these findings are discussed from the perspective of informing public health policy.
Method
Defining ASDs
ASDs can be conceptualized in two ways: (a) as a spectrum disorder with hierarchical levels of severity, as described in DSM-5 (APA, 2013), or (b) as a series of discrete conditions such as those described in earlier versions of the DSM (APA, 1994, 2000) and in ICD-10 (WHO, 1993). In DSM-IV, ASDs comprise autistic disorder (299.00); Asperger's disorder (299.80); pervasive developmental disorders not otherwise specified, including atypical autism (PDD-NOS) (299.80); Rett's disorder (299.80); and childhood disintegrative disorder (299.10). For the purposes of GBD 2010, we disaggregated ASDs into two categories or ‘health states’: autistic disorder and other ASDs. Autistic disorder was defined as cases meeting the DSM (APA, 2000) or ICD (WHO, 1993) diagnostic classificatory system for autistic disorder. A second category of ‘Other ASDs’ was modeled separately and included Asperger's disorder, and PDD-NOS. There were insufficient epidemiological data to include Rett's disorder and childhood disintegrative disorder. We acknowledge that these categories may not be ideal from a clinical perspective but broad assumptions were required, based on the limited data available, to capture sufficient information on disease distributions so that the burden of ASDs could be included in the GBD 2010 estimates. Here, we use the term autism spectrum disorders (ASDs) to refer to autistic disorder and other ASDs combined.
Data collection
Our search strategy involved a systematic search of the peer-reviewed literature, ascertainment of any unpublished data, and expert consultation to identify population-representative studies reporting estimates of prevalence, incidence, remission and excess all-cause mortality for autistic disorder and other ASDs. We conducted searches of electronic databases (Medline, Embase and PsychINFO) using a search string devised with the assistance of a research librarian. The search then extended to a manual search of reference lists for review articles, reports, editorials and resource texts, and an online search of government, university and non-government websites to identify further non-peer-reviewed data sources. Where possible, authors were contacted to clarify details of study methodology and to obtain additional information such as estimates of uncertainty. Experts in international epidemiology and mental health were asked to critically review the shortlisted studies and to suggest any additional sources of published or unpublished data.
Inclusion criteria specified that estimates must specifically relate to either autistic disorder or other ASDs (as defined previously). Given that separate models and burden estimates were to be calculated for these categories, studies that reported only overall estimates of ASDs were not included. Studies were included if published between 1980 and 2009 (unless earlier or later data sources were provided through expert consultation); the study samples were representative of the population; and ‘caseness’ was based on DSM or ICD diagnostic criteria. No limitations were set on language of publication. Studies were excluded if samples could be considered at greater or lesser risk compared to the general population, for instance hospitalized patients, pharmacological treatment samples and case studies. We also excluded studies that did not report sufficient data to determine external validity of findings.
Inclusion criteria allowed annual incidence and also cumulative incidence where studies reported person-years, permitting annual onset to be calculated. Remission studies were accepted where estimates were based on cases no longer meeting diagnostic criteria and had a minimum follow-up period of 2 years. We included data on mortality reported as relative risk (RR), hazard ratios (HRs) or standardized mortality rates (SMRs). Further details on GBD 2010 systematic review protocols have been reported elsewhere (Baxter et al. Reference Baxter, Patton, Degenhardt, Scott and Whiteford2013).
Studies reported highly variable data collection periods so we coded study year to the mid-year of data collection. Each study was coded by country and GBD world region. World regions comprised 21 broad geographic regions identified by epidemiological similarities such as major causes of death and country-specific adult/child mortality levels (Murray et al. Reference Murray, Ezzati, Flaxman, Lim, Lozano, Michaud, Naghavi, Salomon, Shibuya, Vos, Wikler and Lopez2012). We also extracted information on study methods so that covariates could be coded and applied to the model to adjust for systematic bias.
Prevalence models
In GBD 2010, a Bayesian meta-regression tool, DisMod-MR, was used to pool heterogeneous information and derive missing data by making use of the mathematical relationship between incidence, prevalence, remission and mortality parameters (Vos et al. Reference Vos, Flaxman, Naghavi, Lozano, Michaud, Ezzati, Shibuya, Salomon, Abdalla, Aboyans, Abraham, Ackerman, Aggarwal, Ahn, Ali, Alvarado, Anderson, Anderson, Andrews, Atkinson, Baddour, Bahalim, Barker-Collo, Barrero, Bartels, Basáñez, Baxter, Bell, Benjamin, Bennett, Bernabé, Bhalla, Bhandari, Bikbov, Abdulhak, Birbeck, Black, Blencowe, Blore, Blyth, Bolliger, Bonaventure, Boufous, Bourne, Boussinesq, Braithwaite, Brayne, Bridgett, Brooker, Brooks, Brugha, Bryan-Hancock, Bucello, Buchbinder, Buckle, Budke, Burch, Burney, Burstein, Calabria, Campbell, Canter, Carabin, Carapetis, Carmona, Cella, Charlson, Chen, Cheng, Chou, Chugh, Coffeng, Colan, Colquhoun, Colson, Condon, Connor, Cooper, Corriere, Cortinovis, de Vaccaro, Couser, Cowie, Criqui, Cross, Dabhadkar, Dahiya, Dahodwala, Damsere-Derry, Danaei, Davis, De Leo, Degenhardt, Dellavalle, Delossantos, Denenberg, Derrett, Des Jarlais, Dharmaratne, Dherani, Diaz-Torne, Dolk, Dorsey, Driscoll, Duber, Ebel, Edmond, Elbaz, Ali, Erskine, Erwin, Espindola, Ewoigbokhan, Farzadfar, Feigin, Felson, Ferrari, Ferri, Fèvre, Finucane, Flaxman, Flood, Foreman, Forouzanfar, Fowkes, Franklin, Fransen, Freeman, Gabbe, Gabriel, Gakidou, Ganatra, Garcia, Gaspari, Gillum, Gmel, Gosselin, Grainger, Groeger, Guillemin, Gunnell, Gupta, Haagsma, Hagan, Halasa, Hall, Haring, Haro, Harrison, Havmoeller, Hay, Higashi, Hill, Hoen, Hoffman, Hotez, Hoy, Huang, Ibeanusi, Jacobsen, James, Jarvis, Jasrasaria, Jayaraman, Johns, Jonas, Karthikeyan, Kassebaum, Kawakami, Keren, Khoo, King, Knowlton, Kobusingye, Koranteng, Krishnamurthi, Lalloo, Laslett, Lathlean, Leasher, Lee, Leigh, Lim, Limb, Lin, Lipnick, Lipshultz, Liu, Loane, Ohno, Lyons, Ma, Mabweijano, MacIntyre, Malekzadeh, Mallinger, Manivannan, Marcenes, March, Margolis, Marks, Marks, Matsumori, Matzopoulos, Mayosi, McAnulty, McDermott, McGill, McGrath, Medina-Mora, Meltzer, Mensah, Merriman, Meyer, Miglioli, Miller, Miller, Mitchell, Mocumbi, Moffitt, Mokdad, Monasta, Montico, Moradi-Lakeh, Moran, Morawska, Mori, Murdoch, Mwaniki, Naidoo, Nair, Naldi, Narayan, Nelson, Nelson, Nevitt, Newton, Nolte, Norman, Norman, O'Donnell, O'Hanlon, Olives, Omer, Ortblad, Osborne, Ozgediz, Page, Pahari, Pandian, Rivero, Patten, Pearce, Padilla, Perez-Ruiz, Perico, Pesudovs, Phillips, Phillips, Pierce, Pion, Polanczyk, Polinder, Pope, Popova, Porrini, Pourmalek, Prince, Pullan, Ramaiah, Ranganathan, Razavi, Regan, Rehm, Rein, Remuzzi, Richardson, Rivara, Roberts, Robinson, De Leòn, Ronfani, Room, Rosenfeld, Rushton, Sacco, Saha, Sampson, Sanchez-Riera, Sanman, Schwebel, Scott, Segui-Gomez, Shahraz, Shepard, Shin, Shivakoti, Singh, Singh, Singh, Singleton, Sleet, Sliwa, Smith, Smith, Stapelberg, Steer, Steiner, Stolk, Stovner, Sudfeld, Syed, Tamburlini, Tavakkoli, Taylor, Taylor, Taylor, Thomas, Thomson, Thurston, Tleyjeh, Tonelli, Towbin, Truelsen, Tsilimbaris, Ubeda, Undurraga, van der Werf, van Os, Vavilala, Venketasubramanian, Wang, Wang, Watt, Weatherall, Weinstock, Weintraub, Weisskopf, Weissman, White, Whiteford, Wiersma, Wilkinson, Williams, Williams, Witt, Wolfe, Woolf, Wulf, Yeh, Zaidi, Zheng, Zonies, Lopez and Murray2012). The model input comprised: epidemiological data identified in the systematic search; world super-region, region and country random effect intercepts; age-specific fixed effects; and covariates to adjust for differences in study methods. DisMod-MR derived sex patterns based on the epidemiological data and then applied these to data where only ‘person’ estimates (that is, male and female combined) were reported.
Diagnostic criteria (Mattila et al. Reference Mattila, Kielinen, Jussila, Linna, Bloigu, Ebeling and Moilanen2007; King & Bearman, Reference King and Bearman2009) and case-finding methods (Wazana et al. Reference Wazana, Bresnahan and Kline2007) affect the prevalence estimates for ASDs. Covariates were used to adjust for the variable study methods, as described further in the results and discussion. Dichotomous study-level covariates were coded to mark comprehensiveness of the case-finding method (comprehensive epidemiological case-finding versus less comprehensive, for instance administrative identification of diagnosed individuals), diagnostic system (DSM versus ICD criteria) and most recent criteria (DSM-IV/ICD-10 versus earlier DSM and ICD versions). In the case of other ASDs, studies that only reported Asperger's disorder were marked using a specific disorder covariate to adjust these estimates to reflect those that captured a broader range of disorders (e.g. Asperger's disorder plus PDD-NOS). Where outliers were identified, we used a high estimate covariate to mark these estimates and adjust them accordingly rather than excluding studies from an already sparse dataset.
Nested random effects were included for region and country to capture unexplained systematic variation besides the measurement error and study-level unexplained variation. Studies with a data collection period of 1997 or earlier contributed to the 1990 estimates, and studies conducted after 1997 contributed to estimates for 2010. To calculate uncertainty around the final prevalence estimates, DisMod-MR fitted a randomized Markov chain Monte Carlo (MCMC) algorithm (Vos et al. Reference Vos, Flaxman, Naghavi, Lozano, Michaud, Ezzati, Shibuya, Salomon, Abdalla, Aboyans, Abraham, Ackerman, Aggarwal, Ahn, Ali, Alvarado, Anderson, Anderson, Andrews, Atkinson, Baddour, Bahalim, Barker-Collo, Barrero, Bartels, Basáñez, Baxter, Bell, Benjamin, Bennett, Bernabé, Bhalla, Bhandari, Bikbov, Abdulhak, Birbeck, Black, Blencowe, Blore, Blyth, Bolliger, Bonaventure, Boufous, Bourne, Boussinesq, Braithwaite, Brayne, Bridgett, Brooker, Brooks, Brugha, Bryan-Hancock, Bucello, Buchbinder, Buckle, Budke, Burch, Burney, Burstein, Calabria, Campbell, Canter, Carabin, Carapetis, Carmona, Cella, Charlson, Chen, Cheng, Chou, Chugh, Coffeng, Colan, Colquhoun, Colson, Condon, Connor, Cooper, Corriere, Cortinovis, de Vaccaro, Couser, Cowie, Criqui, Cross, Dabhadkar, Dahiya, Dahodwala, Damsere-Derry, Danaei, Davis, De Leo, Degenhardt, Dellavalle, Delossantos, Denenberg, Derrett, Des Jarlais, Dharmaratne, Dherani, Diaz-Torne, Dolk, Dorsey, Driscoll, Duber, Ebel, Edmond, Elbaz, Ali, Erskine, Erwin, Espindola, Ewoigbokhan, Farzadfar, Feigin, Felson, Ferrari, Ferri, Fèvre, Finucane, Flaxman, Flood, Foreman, Forouzanfar, Fowkes, Franklin, Fransen, Freeman, Gabbe, Gabriel, Gakidou, Ganatra, Garcia, Gaspari, Gillum, Gmel, Gosselin, Grainger, Groeger, Guillemin, Gunnell, Gupta, Haagsma, Hagan, Halasa, Hall, Haring, Haro, Harrison, Havmoeller, Hay, Higashi, Hill, Hoen, Hoffman, Hotez, Hoy, Huang, Ibeanusi, Jacobsen, James, Jarvis, Jasrasaria, Jayaraman, Johns, Jonas, Karthikeyan, Kassebaum, Kawakami, Keren, Khoo, King, Knowlton, Kobusingye, Koranteng, Krishnamurthi, Lalloo, Laslett, Lathlean, Leasher, Lee, Leigh, Lim, Limb, Lin, Lipnick, Lipshultz, Liu, Loane, Ohno, Lyons, Ma, Mabweijano, MacIntyre, Malekzadeh, Mallinger, Manivannan, Marcenes, March, Margolis, Marks, Marks, Matsumori, Matzopoulos, Mayosi, McAnulty, McDermott, McGill, McGrath, Medina-Mora, Meltzer, Mensah, Merriman, Meyer, Miglioli, Miller, Miller, Mitchell, Mocumbi, Moffitt, Mokdad, Monasta, Montico, Moradi-Lakeh, Moran, Morawska, Mori, Murdoch, Mwaniki, Naidoo, Nair, Naldi, Narayan, Nelson, Nelson, Nevitt, Newton, Nolte, Norman, Norman, O'Donnell, O'Hanlon, Olives, Omer, Ortblad, Osborne, Ozgediz, Page, Pahari, Pandian, Rivero, Patten, Pearce, Padilla, Perez-Ruiz, Perico, Pesudovs, Phillips, Phillips, Pierce, Pion, Polanczyk, Polinder, Pope, Popova, Porrini, Pourmalek, Prince, Pullan, Ramaiah, Ranganathan, Razavi, Regan, Rehm, Rein, Remuzzi, Richardson, Rivara, Roberts, Robinson, De Leòn, Ronfani, Room, Rosenfeld, Rushton, Sacco, Saha, Sampson, Sanchez-Riera, Sanman, Schwebel, Scott, Segui-Gomez, Shahraz, Shepard, Shin, Shivakoti, Singh, Singh, Singh, Singleton, Sleet, Sliwa, Smith, Smith, Stapelberg, Steer, Steiner, Stolk, Stovner, Sudfeld, Syed, Tamburlini, Tavakkoli, Taylor, Taylor, Taylor, Thomas, Thomson, Thurston, Tleyjeh, Tonelli, Towbin, Truelsen, Tsilimbaris, Ubeda, Undurraga, van der Werf, van Os, Vavilala, Venketasubramanian, Wang, Wang, Watt, Weatherall, Weinstock, Weintraub, Weisskopf, Weissman, White, Whiteford, Wiersma, Wilkinson, Williams, Williams, Witt, Wolfe, Woolf, Wulf, Yeh, Zaidi, Zheng, Zonies, Lopez and Murray2012) informed by: error estimates from the epidemiological data input; estimated age patterns; regional and country patterns; and study and country covariates. For comparison of regional prevalence estimates, we used the direct standardization method and the 2001 standard population proposed by the World Health Organization (Ahmad et al. Reference Ahmad, Boschi-Pinto, Lopez, Murray, Lozano and Inoue2001).
Calculating burden
GBD conceptualizes burden as health loss due to morbidity (YLDs) and mortality (YLLs), which are then summed to derive overall burden in terms of DALYs. No deaths or YLLs were attributed to ASDs in GBD 2010 as these are not recognized underlying causes of death in ICD. However, excess all-cause mortality is taken into account in the modeling process. Here we report global and regional estimates for YLDs and DALYs.
YLDs are the product of age-, sex- and region-specific prevalent cases of disease and disability weights (Salomon et al. Reference Salomon, Vos, Hogan, Gagnon, Naghavi, Mokdad, Begum, Shah, Karyana, Kosen, Farje, Moncada, Dutta, Sazawal, Dyer, Seiler, Aboyans, Baker, Baxter, Benjamin, Bhalla, Abdulhak, Blyth, Bourne, Braithwaite, Brooks, Brugha, Bryan-Hancock, Buchbinder, Burney, Calabria, Chen, Chugh, Cooley, Criqui, Cross, Dabhadkar, Dahodwala, Davis, Degenhardt, Díaz-Torné, Dorsey, Driscoll, Edmond, Elbaz, Ezzati, Feigin, Ferri, Flaxman, Flood, Fransen, Fuse, Gabbe, Gillum, Haagsma, Harrison, Havmoeller, Hay, Hel-Baqui, Hoek, Hoffman, Hogeland, Hoy, Jarvis, Karthikeyan, Knowlton, Lathlean, Leasher, Lim, Lipshultz, Lopez, Lozano, Lyons, Malekzadeh, Marcenes, March, Margolis, McGill, McGrath, Mensah, Meyer, Michaud, Moran, Mori, Murdoch, Naldi, Newton, Norman, Omer, Osborne, Pearce, Perez-Ruiz, Perico, Pesudovs, Phillips, Pourmalek, Prince, Rehm, Remuzzi, Richardson, Room, Saha, Sampson, Sanchez-Riera, Segui-Gomez, Shahraz, Shibuya, Singh, Sliwa, Smith, Soerjomataram, Steiner, Stolk, Stovner, Sudfeld, Taylor, Tleyjeh, van der Werf, Watson, Weatherall, Weintraub, Weisskopf, Whiteford, Wilkinson, Woolf, Zheng and Murray2012). The prevalence estimates derived from DisMod-MR provided the necessary prevalence inputs. Disability weights were developed for GBD 2010 by Salomon et al. (Reference Salomon, Vos, Hogan, Gagnon, Naghavi, Mokdad, Begum, Shah, Karyana, Kosen, Farje, Moncada, Dutta, Sazawal, Dyer, Seiler, Aboyans, Baker, Baxter, Benjamin, Bhalla, Abdulhak, Blyth, Bourne, Braithwaite, Brooks, Brugha, Bryan-Hancock, Buchbinder, Burney, Calabria, Chen, Chugh, Cooley, Criqui, Cross, Dabhadkar, Dahodwala, Davis, Degenhardt, Díaz-Torné, Dorsey, Driscoll, Edmond, Elbaz, Ezzati, Feigin, Ferri, Flaxman, Flood, Fransen, Fuse, Gabbe, Gillum, Haagsma, Harrison, Havmoeller, Hay, Hel-Baqui, Hoek, Hoffman, Hogeland, Hoy, Jarvis, Karthikeyan, Knowlton, Lathlean, Leasher, Lim, Lipshultz, Lopez, Lozano, Lyons, Malekzadeh, Marcenes, March, Margolis, McGill, McGrath, Mensah, Meyer, Michaud, Moran, Mori, Murdoch, Naldi, Newton, Norman, Omer, Osborne, Pearce, Perez-Ruiz, Perico, Pesudovs, Phillips, Pourmalek, Prince, Rehm, Remuzzi, Richardson, Room, Saha, Sampson, Sanchez-Riera, Segui-Gomez, Shahraz, Shibuya, Singh, Sliwa, Smith, Soerjomataram, Steiner, Stolk, Stovner, Sudfeld, Taylor, Tleyjeh, van der Werf, Watson, Weatherall, Weintraub, Weisskopf, Whiteford, Wilkinson, Woolf, Zheng and Murray2012) with the results of this study reported in the 2012 GBD Lancet series (Salomon et al. Reference Salomon, Vos, Hogan, Gagnon, Naghavi, Mokdad, Begum, Shah, Karyana, Kosen, Farje, Moncada, Dutta, Sazawal, Dyer, Seiler, Aboyans, Baker, Baxter, Benjamin, Bhalla, Abdulhak, Blyth, Bourne, Braithwaite, Brooks, Brugha, Bryan-Hancock, Buchbinder, Burney, Calabria, Chen, Chugh, Cooley, Criqui, Cross, Dabhadkar, Dahodwala, Davis, Degenhardt, Díaz-Torné, Dorsey, Driscoll, Edmond, Elbaz, Ezzati, Feigin, Ferri, Flaxman, Flood, Fransen, Fuse, Gabbe, Gillum, Haagsma, Harrison, Havmoeller, Hay, Hel-Baqui, Hoek, Hoffman, Hogeland, Hoy, Jarvis, Karthikeyan, Knowlton, Lathlean, Leasher, Lim, Lipshultz, Lopez, Lozano, Lyons, Malekzadeh, Marcenes, March, Margolis, McGill, McGrath, Mensah, Meyer, Michaud, Moran, Mori, Murdoch, Naldi, Newton, Norman, Omer, Osborne, Pearce, Perez-Ruiz, Perico, Pesudovs, Phillips, Pourmalek, Prince, Rehm, Remuzzi, Richardson, Room, Saha, Sampson, Sanchez-Riera, Segui-Gomez, Shahraz, Shibuya, Singh, Sliwa, Smith, Soerjomataram, Steiner, Stolk, Stovner, Sudfeld, Taylor, Tleyjeh, van der Werf, Watson, Weatherall, Weintraub, Weisskopf, Whiteford, Wilkinson, Woolf, Zheng and Murray2012; Vos et al. Reference Vos, Flaxman, Naghavi, Lozano, Michaud, Ezzati, Shibuya, Salomon, Abdalla, Aboyans, Abraham, Ackerman, Aggarwal, Ahn, Ali, Alvarado, Anderson, Anderson, Andrews, Atkinson, Baddour, Bahalim, Barker-Collo, Barrero, Bartels, Basáñez, Baxter, Bell, Benjamin, Bennett, Bernabé, Bhalla, Bhandari, Bikbov, Abdulhak, Birbeck, Black, Blencowe, Blore, Blyth, Bolliger, Bonaventure, Boufous, Bourne, Boussinesq, Braithwaite, Brayne, Bridgett, Brooker, Brooks, Brugha, Bryan-Hancock, Bucello, Buchbinder, Buckle, Budke, Burch, Burney, Burstein, Calabria, Campbell, Canter, Carabin, Carapetis, Carmona, Cella, Charlson, Chen, Cheng, Chou, Chugh, Coffeng, Colan, Colquhoun, Colson, Condon, Connor, Cooper, Corriere, Cortinovis, de Vaccaro, Couser, Cowie, Criqui, Cross, Dabhadkar, Dahiya, Dahodwala, Damsere-Derry, Danaei, Davis, De Leo, Degenhardt, Dellavalle, Delossantos, Denenberg, Derrett, Des Jarlais, Dharmaratne, Dherani, Diaz-Torne, Dolk, Dorsey, Driscoll, Duber, Ebel, Edmond, Elbaz, Ali, Erskine, Erwin, Espindola, Ewoigbokhan, Farzadfar, Feigin, Felson, Ferrari, Ferri, Fèvre, Finucane, Flaxman, Flood, Foreman, Forouzanfar, Fowkes, Franklin, Fransen, Freeman, Gabbe, Gabriel, Gakidou, Ganatra, Garcia, Gaspari, Gillum, Gmel, Gosselin, Grainger, Groeger, Guillemin, Gunnell, Gupta, Haagsma, Hagan, Halasa, Hall, Haring, Haro, Harrison, Havmoeller, Hay, Higashi, Hill, Hoen, Hoffman, Hotez, Hoy, Huang, Ibeanusi, Jacobsen, James, Jarvis, Jasrasaria, Jayaraman, Johns, Jonas, Karthikeyan, Kassebaum, Kawakami, Keren, Khoo, King, Knowlton, Kobusingye, Koranteng, Krishnamurthi, Lalloo, Laslett, Lathlean, Leasher, Lee, Leigh, Lim, Limb, Lin, Lipnick, Lipshultz, Liu, Loane, Ohno, Lyons, Ma, Mabweijano, MacIntyre, Malekzadeh, Mallinger, Manivannan, Marcenes, March, Margolis, Marks, Marks, Matsumori, Matzopoulos, Mayosi, McAnulty, McDermott, McGill, McGrath, Medina-Mora, Meltzer, Mensah, Merriman, Meyer, Miglioli, Miller, Miller, Mitchell, Mocumbi, Moffitt, Mokdad, Monasta, Montico, Moradi-Lakeh, Moran, Morawska, Mori, Murdoch, Mwaniki, Naidoo, Nair, Naldi, Narayan, Nelson, Nelson, Nevitt, Newton, Nolte, Norman, Norman, O'Donnell, O'Hanlon, Olives, Omer, Ortblad, Osborne, Ozgediz, Page, Pahari, Pandian, Rivero, Patten, Pearce, Padilla, Perez-Ruiz, Perico, Pesudovs, Phillips, Phillips, Pierce, Pion, Polanczyk, Polinder, Pope, Popova, Porrini, Pourmalek, Prince, Pullan, Ramaiah, Ranganathan, Razavi, Regan, Rehm, Rein, Remuzzi, Richardson, Rivara, Roberts, Robinson, De Leòn, Ronfani, Room, Rosenfeld, Rushton, Sacco, Saha, Sampson, Sanchez-Riera, Sanman, Schwebel, Scott, Segui-Gomez, Shahraz, Shepard, Shin, Shivakoti, Singh, Singh, Singh, Singleton, Sleet, Sliwa, Smith, Smith, Stapelberg, Steer, Steiner, Stolk, Stovner, Sudfeld, Syed, Tamburlini, Tavakkoli, Taylor, Taylor, Taylor, Thomas, Thomson, Thurston, Tleyjeh, Tonelli, Towbin, Truelsen, Tsilimbaris, Ubeda, Undurraga, van der Werf, van Os, Vavilala, Venketasubramanian, Wang, Wang, Watt, Weatherall, Weinstock, Weintraub, Weisskopf, Weissman, White, Whiteford, Wiersma, Wilkinson, Williams, Williams, Witt, Wolfe, Woolf, Wulf, Yeh, Zaidi, Zheng, Zonies, Lopez and Murray2012). In brief, disability was defined as any short- or long-term health loss due to a particular cause. Community samples were administered surveys using a face-to-face questionnaire in Bangladesh, Indonesia, Peru, the United Republic of Tanzania and the USA (n = 16 328) and online through an open-access internet survey (n = 13 902). Surveys included lay descriptions of health states, which were presented as pair-wise comparison questions. All 220 lay descriptions were required to be 35 words or less and use uncomplicated, non-clinical language. In the survey, participants were asked to nominate which of the two presented conditions they deemed ‘unhealthier’. Responses were converted into discrete values between 0 (perfect health) and 1 (death). In the online survey, additional data were collected on population health equivalence for a proportion of the health states to help anchor results on the 0 to 1 scale. The disability weights generated for autistic disorder and other ASDs were 0.26 [95% uncertainty interval (UI) 0.18–0.36] and 0.11 (95% UI 0.07–0.16) respectively. The lay descriptions for these disorder categories can be found in the online Appendix. In sensitivity analyses, Salomon et al. (Reference Salomon, Vos, Hogan, Gagnon, Naghavi, Mokdad, Begum, Shah, Karyana, Kosen, Farje, Moncada, Dutta, Sazawal, Dyer, Seiler, Aboyans, Baker, Baxter, Benjamin, Bhalla, Abdulhak, Blyth, Bourne, Braithwaite, Brooks, Brugha, Bryan-Hancock, Buchbinder, Burney, Calabria, Chen, Chugh, Cooley, Criqui, Cross, Dabhadkar, Dahodwala, Davis, Degenhardt, Díaz-Torné, Dorsey, Driscoll, Edmond, Elbaz, Ezzati, Feigin, Ferri, Flaxman, Flood, Fransen, Fuse, Gabbe, Gillum, Haagsma, Harrison, Havmoeller, Hay, Hel-Baqui, Hoek, Hoffman, Hogeland, Hoy, Jarvis, Karthikeyan, Knowlton, Lathlean, Leasher, Lim, Lipshultz, Lopez, Lozano, Lyons, Malekzadeh, Marcenes, March, Margolis, McGill, McGrath, Mensah, Meyer, Michaud, Moran, Mori, Murdoch, Naldi, Newton, Norman, Omer, Osborne, Pearce, Perez-Ruiz, Perico, Pesudovs, Phillips, Pourmalek, Prince, Rehm, Remuzzi, Richardson, Room, Saha, Sampson, Sanchez-Riera, Segui-Gomez, Shahraz, Shibuya, Singh, Sliwa, Smith, Soerjomataram, Steiner, Stolk, Stovner, Sudfeld, Taylor, Tleyjeh, van der Werf, Watson, Weatherall, Weintraub, Weisskopf, Whiteford, Wilkinson, Woolf, Zheng and Murray2012) found a high degree of consistency between the different countries surveyed in terms of the disability weights assigned to each health state.
To correct for any co-morbidities in YLDs between ASDs and all other causes included in GBD 2010, a co-morbidity correction was carried out using micro-simulation methods across YLD estimates (Vos et al. Reference Vos, Flaxman, Naghavi, Lozano, Michaud, Ezzati, Shibuya, Salomon, Abdalla, Aboyans, Abraham, Ackerman, Aggarwal, Ahn, Ali, Alvarado, Anderson, Anderson, Andrews, Atkinson, Baddour, Bahalim, Barker-Collo, Barrero, Bartels, Basáñez, Baxter, Bell, Benjamin, Bennett, Bernabé, Bhalla, Bhandari, Bikbov, Abdulhak, Birbeck, Black, Blencowe, Blore, Blyth, Bolliger, Bonaventure, Boufous, Bourne, Boussinesq, Braithwaite, Brayne, Bridgett, Brooker, Brooks, Brugha, Bryan-Hancock, Bucello, Buchbinder, Buckle, Budke, Burch, Burney, Burstein, Calabria, Campbell, Canter, Carabin, Carapetis, Carmona, Cella, Charlson, Chen, Cheng, Chou, Chugh, Coffeng, Colan, Colquhoun, Colson, Condon, Connor, Cooper, Corriere, Cortinovis, de Vaccaro, Couser, Cowie, Criqui, Cross, Dabhadkar, Dahiya, Dahodwala, Damsere-Derry, Danaei, Davis, De Leo, Degenhardt, Dellavalle, Delossantos, Denenberg, Derrett, Des Jarlais, Dharmaratne, Dherani, Diaz-Torne, Dolk, Dorsey, Driscoll, Duber, Ebel, Edmond, Elbaz, Ali, Erskine, Erwin, Espindola, Ewoigbokhan, Farzadfar, Feigin, Felson, Ferrari, Ferri, Fèvre, Finucane, Flaxman, Flood, Foreman, Forouzanfar, Fowkes, Franklin, Fransen, Freeman, Gabbe, Gabriel, Gakidou, Ganatra, Garcia, Gaspari, Gillum, Gmel, Gosselin, Grainger, Groeger, Guillemin, Gunnell, Gupta, Haagsma, Hagan, Halasa, Hall, Haring, Haro, Harrison, Havmoeller, Hay, Higashi, Hill, Hoen, Hoffman, Hotez, Hoy, Huang, Ibeanusi, Jacobsen, James, Jarvis, Jasrasaria, Jayaraman, Johns, Jonas, Karthikeyan, Kassebaum, Kawakami, Keren, Khoo, King, Knowlton, Kobusingye, Koranteng, Krishnamurthi, Lalloo, Laslett, Lathlean, Leasher, Lee, Leigh, Lim, Limb, Lin, Lipnick, Lipshultz, Liu, Loane, Ohno, Lyons, Ma, Mabweijano, MacIntyre, Malekzadeh, Mallinger, Manivannan, Marcenes, March, Margolis, Marks, Marks, Matsumori, Matzopoulos, Mayosi, McAnulty, McDermott, McGill, McGrath, Medina-Mora, Meltzer, Mensah, Merriman, Meyer, Miglioli, Miller, Miller, Mitchell, Mocumbi, Moffitt, Mokdad, Monasta, Montico, Moradi-Lakeh, Moran, Morawska, Mori, Murdoch, Mwaniki, Naidoo, Nair, Naldi, Narayan, Nelson, Nelson, Nevitt, Newton, Nolte, Norman, Norman, O'Donnell, O'Hanlon, Olives, Omer, Ortblad, Osborne, Ozgediz, Page, Pahari, Pandian, Rivero, Patten, Pearce, Padilla, Perez-Ruiz, Perico, Pesudovs, Phillips, Phillips, Pierce, Pion, Polanczyk, Polinder, Pope, Popova, Porrini, Pourmalek, Prince, Pullan, Ramaiah, Ranganathan, Razavi, Regan, Rehm, Rein, Remuzzi, Richardson, Rivara, Roberts, Robinson, De Leòn, Ronfani, Room, Rosenfeld, Rushton, Sacco, Saha, Sampson, Sanchez-Riera, Sanman, Schwebel, Scott, Segui-Gomez, Shahraz, Shepard, Shin, Shivakoti, Singh, Singh, Singh, Singleton, Sleet, Sliwa, Smith, Smith, Stapelberg, Steer, Steiner, Stolk, Stovner, Sudfeld, Syed, Tamburlini, Tavakkoli, Taylor, Taylor, Taylor, Thomas, Thomson, Thurston, Tleyjeh, Tonelli, Towbin, Truelsen, Tsilimbaris, Ubeda, Undurraga, van der Werf, van Os, Vavilala, Venketasubramanian, Wang, Wang, Watt, Weatherall, Weinstock, Weintraub, Weisskopf, Weissman, White, Whiteford, Wiersma, Wilkinson, Williams, Williams, Witt, Wolfe, Woolf, Wulf, Yeh, Zaidi, Zheng, Zonies, Lopez and Murray2012). For each country, year, age and sex category, a hypothetical population of 20 000 individuals was created who could have zero, one, two or more co-morbid conditions using the prevalence estimates as probabilities. A combined disability weight was then derived using a multiplicative function for all co-occurring health states and reapportioned to each health state relative to the sum of co-morbid disability weights.
We report the disability caused by ASDS, relative to other mental disorders, in terms of YLDs. Overall burden estimates (DALYs) are presented as both crude (absolute) numbers and the age-standardized rate per 100 000 population.
Results
Epidemiological data
Our review identified prevalence data for ASDs from 18 out of the 187 countries included in GBD 2010. These studies included samples up to 27 years of age with no population-representative data found for adults meeting our inclusion criteria. There were 27 prevalence studies that met our review criteria for autistic disorder and 14 for other ASDs (see Fig. 1 for results of the systematic review, and the online Supplementary material for data sources). The majority of prevalence studies for other ASDs captured both Asperger's disorder and PDD-NOS, with the exception of five studies that reported Asperger's disorder only.
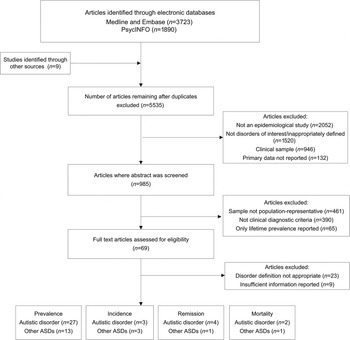
Fig. 1. Flowchart showing results of the systematic review. ASD, Autism spectrum disorder.
There were seven different diagnostic tools reported including: the Autism Diagnostic Interview Revised (ADI-R); Autism Diagnostic Observation Schedule – Generic (ADOS-G); Development And Well-Being Assessment (DAWBA); Childhood Autism Rating Scale (CARS); Autism Behavioral Checklist (ABC); Autism Spectrum Screening Questionnaire (ASSQ); and clinical interview or notes.
There was a dearth of epidemiological data outside of high-income countries, with regions in Africa, Latin America and Central and Eastern Europe largely unrepresented. Figure 2 shows specific regions where data were available with references for each data source listed in the Supplementary material. Estimates were largely reported for persons only, with few sex-specific estimates available across epidemiological studies.
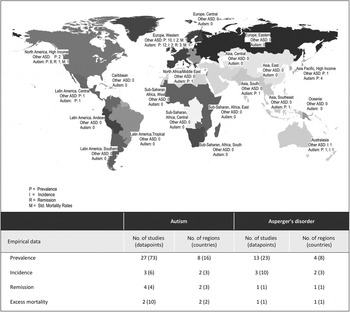
Fig. 2. Number and distribution of epidemiological studies and individual data points used as input for global prevalence models.
Only three incidence studies met our inclusion criteria (Powell et al. Reference Powell, Edwards, Edwards, Pandit, Sungum-Paliwal and Whitehouse2000; Lauritsen et al. Reference Lauritsen, Pedersen and Mortensen2004; Williams et al. Reference Williams, Glasson, Wray, Tuck, Helmer, Bower and Mellins2005). The most common reason for non-inclusion of prevalence and incidence data was the use of non-representative samples (for instance those ascertained through registry data only; Wong & Hui, Reference Wong and Hui2008) and classification of disorders that did not allow estimation for specific disorders (for example ‘all’ ASDs; Scott et al. Reference Scott, Baron-Cohen, Bolton and Brayne2002). There were also limited data on remission and mortality from community-representative samples. We found four remission studies for ASDs (Cantwell & Baker, Reference Cantwell and Baker1989; Howlin et al. Reference Howlin, Goode, Hutton and Rutter2004; Billstedt et al. Reference Billstedt, Gillberg and Gillberg2005; Cederlund et al. Reference Cederlund, Hagberg, Billstedt, Gillberg and Gillberg2008) and two for excess all-cause mortality (Shavelle et al. Reference Shavelle, Strauss and Pickett2001; Mouridsen et al. Reference Mouridsen, Bronnum-Hansen, Rich and Isager2008) (see Fig. 1).
Model covariates
For autistic disorder, but not other ASDs, studies that used more comprehensive epidemiological case-finding methods were associated with substantially higher prevalence estimates compared with less comprehensive studies such as those that used administrative data, resulting in approximately 43% higher reported prevalence estimates. The exponentiated coefficient for less comprehensive case-finding methods compared with more comprehensive methods was 0.57 (95% UI 0.45–0.73). For autistic disorder, we found that more recent diagnostic criteria (DSM-IV and ICD-10) were associated with higher case-finding rates than earlier criteria (DSM-III, DSM-III-R and ICD-9), resulting in approximately twofold higher reported estimates of prevalence once other factors had been accounted for; the exponentiated coefficient for older criteria with most recent criteria was 0.47 (95% UI 0.37–0.61). Similarly to autistic disorder, newer diagnostic criteria were related to higher case-finding for other ASDs; however, the difference was not significant (0.76, 95% UI 0.51–1.12).
Our models suggested that diagnosis by a lay interviewer was associated with significantly lower rates of autistic disorder, compared with diagnosis by a clinician (0.29, 95% UI 0.11–0.78), but the finding was not significant for other ASDs. Once other factors were considered, we found that prevalence estimates for other ASDs were not significantly higher if more than one specific disorder (i.e. PDD-NOS in addition to Asperger's disorder) was captured in comparison to Asperger's disorder alone. Sample size, response rate and classificatory systems showed no association with reported prevalence and so we excluded these covariates from the final models.
Estimated prevalence
Global and regional prevalence
In 2010 there were an estimated 52 million cases of ASDs around the world, equating to a population prevalence of 7.6 per 1000 or one in 132 persons. Once variable study methods were considered, our model showed no evidence of a time change in the prevalence of either autistic disorder or other ASDs. In 1990, age-standardized point prevalence for ASDs was 7.5 per 1000 compared with 7.6 per 1000 in 2010. Given the lack of change over time, we report 2010 estimates only from this point forward. Further results for ASDs in 1990 are available from the corresponding author.
In 2010, the global point prevalence of autistic disorder was 2.4 per 1000 (95% UI 2.3–2.6). Autistic disorder was three times more common in males (3.6 per 1000, 95% UI 3.4–3.9) compared with females (1.2 per 1000, 95% UI 1.2–1.3). The age trajectory follows a similar pattern for males and females, with a sharp rise in prevalence prior to 5 years of age before peaking between 5 and 20 years of age. As there was no information on prevalence in adulthood, the age pattern from this point was informed entirely by remission and mortality data.
The estimated prevalence for other ASDs was 5.1 per 1000 (95% UI 4.8–5.4). The gender difference was more than fourfold for other ASDs with prevalence of 8.2 per 1000 (95% UI 7.7–8.8) in males and 2.0 per 1000 (95% UI 1.8–2.1) in females.
Worldwide, little regional variation was found in the prevalence of autism. Although some variation is observed, particularly for North America high income at the highest end of the scale, there was a great deal of overlap between uncertainty intervals. Figure 3 shows the estimated prevalence for autistic disorder and other ASDs by age group for each GBD world region. Regional prevalence estimates (with 95% UIs) for males, females and persons can be found the Supplementary material.
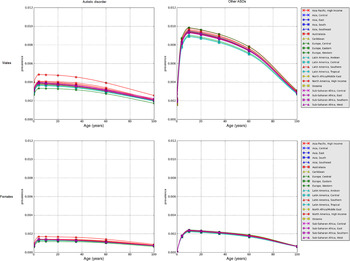
Fig. 3. Estimated point prevalence of autistic disorder and other autism spectrum disorders (ASDs) for males and females in 2010, by Global Burden of Disease Study 2010 (GBD 2010) world region.
Burden of ASDs
In children under 5 years of age, ASDs were the leading cause of disability, in terms of YLDs, among all mental disorders. Of the 291 diseases and injuries considered in GBD 2010, autistic disorder and other ASDs were ranked among the 20 leading causes of disability for the under 5-year age group. In children aged 5 to 14 years, ASDs were the fourth leading cause of disability out of the mental disorders.
ASDs accounted for 7.7 million DALYs in 2010. Of these, just over half were caused by autistic disorder (4.0 million DALYs, 95% UI 2.8–5.6 million) and the remainder by other ASDs (3.7 million DALYs, 95% UI 2.5–5.2 million). Standardized by age and sex, this equated to 111 DALYs per 100 000 population (95% UI 77–154) in 2010. Globally, ASDs accounted for 170 DALYs per 100 000 males (95% UI 119–237) and 50 DALYs per 100 000 females (95% UI 35–68).
Crude DALYs for ASDs increased by 38% between 1990 and 2010, from 337.8 million in 1990 to 467.6 million in 2010. This increase is attributable entirely to population growth, with no change ascribed to changing age structure or population prevalence. Global DALY rates for autistic disorder and other ASDs are reported by age for 2010 in the Supplementary material.
Regional variation
Burden rates per capita varied somewhat across world regions and countries. The United Arab Emirates had the highest estimated DALY rates for ASDs at 137 per 100 000 compared with lower rates of 99 per 100 000 across most countries in Western Europe. However, differences were minimal and fell well within uncertainty bounds (see Tables 1 and 2). In particular, there was very minimal variation in regional burden for other ASDs with this reflective of the limited epidemiological data available. DALY numbers and age-standardized rates for 2010 are reported by world region in Tables 1 and 2.
Table 1. Estimated DALYs for autistic disorder, by sex and GBD world region in 2010
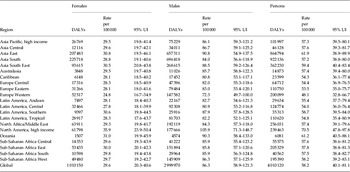
DALYs, Disability-adjusted life-years; GBD, Global Burden of Disease Study; UI, uncertainty interval.
Rounding of numbers may not add up to the ‘Total’.
Table 2. Estimated DALYs for other ASDs, by sex and GBD world region in 2010

ASD, Autism spectrum disorder; DALYs, disability-adjusted life-years; GBD, Global Burden of Disease Study; UI, uncertainty interval.
Rounding of numbers may not add up to the ‘Total’.
Discussion
This paper reports estimates of global prevalence and burden of disease for ASDs for the first time. In 2010, an estimated one in 132 individuals had an ASD, with this translating to 52 million cases of ASDs and 7.7 million DALYs across the globe. Previous iterations of GBD have not represented the disease burden caused by ASDs and their inclusion assists in the more comprehensive calculation of global disease burden due to mental disorders.
In comparison to other mental disorders that commence in childhood, the total burden of ASDs was greater than that of conduct disorder and ADHD combined (DALYs = 6.2 million) (Erskine et al. Reference Erskine, Ferrari, Polanczyk, Moffitt, Murray, Vos, Whiteford and Scott2014). Unlike disorders such as ADHD, which demonstrate substantial remission from adolescence onwards (Faraone et al. Reference Faraone, Biederman and Mick2006), there is limited clinical or epidemiological evidence of remission in ASDs. This results in burden that commences in infancy and persists across the lifespan.
There are multiple challenges in trying to identify and quantify cases of ASD. Population-representative data are often sparse for ASDs as they can be considered low public health priorities and case-finding is difficult outside clinical settings. As ASDs are commonly perceived to be childhood disorders, there is a dearth of data for ASD epidemiology beyond childhood and adolescence. In our systematic review, for example, we found no estimates of prevalence beyond the age of 27. Only recently have there been any studies of ASDs in adult samples (Brugha et al. Reference Brugha, McManus, Meltzer, Smith, Scott, Purdon, Harris and Bankart2009, Reference Brugha, Cooper, McManus, Purdon, Smith, Scott, Spiers and Tyrer2012). This finding highlights the necessity for epidemiological studies to continue to investigate ASDs beyond childhood and assess their prevalence and outcome over the lifespan.
An additional challenge in estimating prevalence is establishing age of onset. ASDs are difficult to detect in very young (non-verbal) children where there is a substantial overlap with behavior in normally developing children (de Bildt et al. Reference de Bildt, Sytema, Ketelaars, Kraijer, Mulder, Volkmar and Minderaa2004). In addition, it is difficult to differentiate ASDs from intellectual disability (ID). Low mental ages account for less-developed social and communicative behavior in itself (Wing, Reference Wing1997), resulting in behavioral overlap between children with ID and children with an ASD (Dilavore et al. Reference Dilavore, Lord and Rutter1995).
Despite the body of the research that has reported lack of evidence for changing prevalence at the international level, there remains debate over whether the prevalence of ASDs is increasing (Park, Reference Park2009). These propositions are largely based on findings from studies that used registry data (Lauritsen et al. Reference Lauritsen, Pedersen and Mortensen2004) and diagnosis/clinical/therapy data (Gillberg et al. Reference Gillberg, Steffenburg and Schaumann1991; Boyle et al. Reference Boyle, Boulet, Schieve, Cohen, Blumberg, Yeargin-Allsopp, Visser and Kogan2011) to identify cases. Several researchers have highlighted the difficulties of interpreting changes in prevalence of ASDs when relying on administrative data such as registry information or special education needs records (Laidler, Reference Laidler2005; Charman et al. Reference Charman, Pickles, Chandler, Wing, Bryson, Simonoff, Loucas and Baird2009). Our study aimed to overcome these limitations by capturing prevalence data from a range of sources that used comprehensive case-finding strategies and by using covariates to adjust for sources of systematic bias. After adjusting for variable study methodology, our models show that the prevalence of ASDs seems to have remained relatively stable over the past 20 years. A community case-finding survey of adults by Brugha et al. (Reference Brugha, McManus, Bankart, Scott, Purdon, Smith, Bebbington, Jenkins and Meltzer2011) found that prevalence of ASDs in younger cohorts was consistent with that of older adult cohorts, supporting our finding of a stable prevalence. These results support research findings (Fombonne, Reference Fombonne2008) that suggest that early childhood factors, for instance vaccinations, have had no observable effect on the occurrence of ASDs. However, there is some evidence that in-utero stressors (such as maternal stress, obesity and pesticide exposure), birth complications and advanced parental age may be associated with higher risk for ASDs (Scott et al. Reference Scott, Duhig, Hamlyn and Norman2013). The design methods used in our study limited our ability to detect subtle changes across time and populations, highlighting the importance of further research into the effect of differential exposures to possible risk factors.
The absence of data from developing countries, the paucity of information for adults and the lack of studies reporting population-representative estimates for incidence, remission and mortality meant that broad assumptions had to be made to build a comprehensive model of disease distribution. As our analyses carried forward uncertainty from each stage of the calculation along with the empirical data input, we were able to estimate uncertainty around each estimate. Our results show broad uncertainty ranges, particularly where information was scarce, and we suggest that these estimates should be interpreted with caution in view of the data limitations.
It may be that methodological differences, particularly more inclusive diagnostic criteria and more comprehensive sampling methodologies, are responsible for the increased identification of cases (Wing & Potter, Reference Wing and Potter2002; Wazana et al. Reference Wazana, Bresnahan and Kline2007). Our models showed that more recent diagnostic criteria (DSM-IV and ICD-10) identified a greater number of cases compared with earlier criteria. This is not surprising in view of the addition of Asperger's disorder to DSM-IV and the broader definition of autistic disorder, which led to children previously being diagnosed with mental retardation being reclassified under an autistic disorder (Croen et al. Reference Croen, Grether, Hoogstrate and Selvin2002; King & Bearman, Reference King and Bearman2009). However, some commentators have disputed the degree to which the latter has affected estimates (Blaxill et al. Reference Blaxill, Baskin and Spitzer2003; Croen & Grether, Reference Croen and Grether2003).
Moreover, studies that used more comprehensive case-finding strategies (including mainstream and assisted schooling facilities and community surveys) rather than studies simply reporting registry data were associated with higher prevalence rates. This is an outstanding issue relating to conditions such as ASDs, where many cases in the population go unrecognized. This is relevant to decision makers in the health and education sectors as a substantial proportion of ASD cases are not being diagnosed in a timely manner and hence are not receiving evidence-based treatment at a crucial period of development.
The substantial burden of autistic disorder and other ASDs across the lifespan has important public health and policy implications, particularly given that most people living with ASDs today are adults and this will continue to be the case. Thus, support and interventions for people with ASDs and their families need to extend beyond pediatric health and early education to later health interventions, additional skills training and vocational support.
To move from estimations and assumptions toward certainties, future studies should address the significant epidemiological gaps relating to ASDs. In particular, adult studies of ASD prevalence, mortality and remission studies and prevalence studies in developing countries are urgently required.
Supplementary material
For supplementary material accompanying this paper, please visit http://dx.doi.org/10.1017/S003329171400172X.
Acknowledgments
We thank A. Flaxman for his expert assistance with disease modeling, J. Blore and R. Norman for their advice and support, and K. Michener and A. Somerville for their valuable contributions to the systematic reviews. A. Baxter, H. Erskine, and R. Scheurer are affiliated with the Queensland Centre for Mental Health Research, which receives its core funding from the Queensland Department of Health. At the time of analyses, T. Vos was working in the Centre for Burden of Disease and Cost-Effectiveness (BoDCE), which received some funding for GBD 2010 from the Bill & Melinda Gates Foundation.
Declaration of Interest
None.


