INTRODUCTION
The Fram Strait and the Barents Sea represent the gateways for warm and saline Atlantic Water inflow into the Arctic Ocean (Fig. 1). Thus, the Barents Sea plays an important role in Atlantic-Arctic interactions and heat release regulations at high northern latitudes contributing to the strength of Atlantic meridional overturning circulation (AMOC) in the area (e.g., Rudels et al., Reference Rudels, Anderson and Jones1996; Smedsrud et al., Reference Smedsrud, Esau, Ingvaldsen, Eldevik, Haugan, Li and Lien2013).

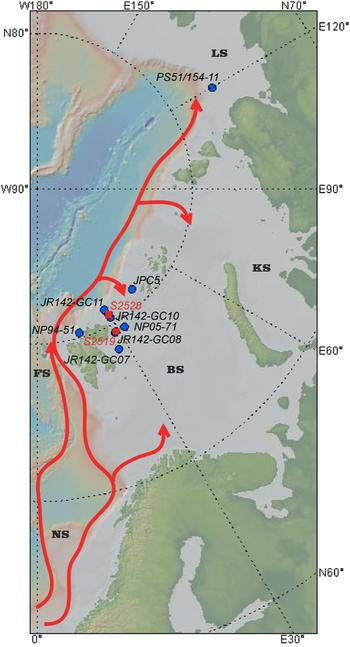
Figure 1. Overview map of Atlantic Water flow along the Eurasian continental margin, and core locations. BS, Barents Sea; FS, Fram Strait; KS, Kara Sea; LS, Laptev Sea; NS, Norwegian Sea. AW flow is indicated by arrows. Sediment core sites from this and previous studies are indicated by red and blue circles, respectively. (For interpretation of the references to color in this figure legend, the reader is referred to the web version of this article.)
During the last glacial maximum (LGM, 26.5 to 19 cal ka BP; Clark et al., Reference Clark, Dyke, Shakun, Carlson, Clark, Wohlfarth, Mitrovica, Hostetler and McCabe2009), Atlantic Water seasonally penetrated into the Arctic through the Fram Strait and farther eastward along the margin of the Scandinavian-Barents Ice Sheet (e.g., Hebbeln et al., Reference Hebbeln, Dokken, Andersen, Hald and Elverhøi1994; Ivanova, Reference Ivanova2009; Xiao et al., Reference Xiao, Stein and Fahl2015). However, the northwestern (NW) Barents Sea was entirely covered by grounded ice as the maximum of ice sheet extent occurred at ca. 21cal ka BP (Hughes et al., Reference Hughes, Gyllencreutz, Lohne, Mangerud and Svendsen2016). In the millennia following the LGM, the Barents Sea Ice Sheet drained by ice streams and ice flows, especially active in the troughs, under the control of sea level rise (e.g., Dowdeswell and Siegert, Reference Dowdeswell and Siegert1999; Svendsen et al., Reference Svendsen, Alexanderson, Astakhov, Demidov, Dowdeswell, Funder and Gataullin2004; Patton et al., Reference Patton, Hubbard, Andreassen, Auriac, Whitehouse, Stroeven, Shackleton, Winsborrow, Heyman and Hall2017). Atlantic Water penetrated into the deep-sea troughs, fostering ice sheet detachment from the bottom and hence its retreat (e.g., Lubinski et al., Reference Lubinski, Polyak and Forman2001; Hughes et al., Reference Hughes, Gyllencreutz, Lohne, Mangerud and Svendsen2016). Geothermal activity discovered in the troughs (Zayonchek et al., Reference Zayonchek, Mazarovich, Lavrushin, Sokolov, Khutorskoi, Abramova and Aliulov2009) might stimulate the early detachment as well. In the NW troughs, gradual ice retreat was punctuated by minor readvances or still stands and progressed also through iceberg calving (Hogan et al., Reference Hogan, Dowdeswell, Noormets, Evans and Ó Cofaigh2010a, Reference Hogan, Dowdeswell, Noormets, Evans, Ó Cofaigh and Jakobsson2010b).
In Barents Sea records, postglacial environments were reconstructed with rather low temporal resolution because strong dissolution of calcareous material, even at relatively shallow sites from water depth of 200–600 m, limits the number of well-dated sediment cores. Nevertheless, evidence from the northern troughs and margins suggests increased subsurface Atlantic Water inflow during the Bølling/Allerød (B/A), 14.8–12.9 cal ka BP (Klitgaard-Kristensen et al., Reference Klitgaard-Kristensen, Rasmussen and Koç2013); at the Younger Dryas (YD)/Preboreal transition (Lubinski et al., Reference Lubinski, Polyak and Forman2001); and during the early to middle Holocene (e.g., Duplessy et al., Reference Duplessy, Ivanova, Murdmaa, Paterne and Labeyrie2001, Reference Duplessy, Cortijo, Ivanova, Khusid, Labeyrie, Levitan, Murdmaa and Paterne2005; Ślubowska et al., Reference Ślubowska, Koç, Rasmussen and Klitgaard Klitgaard-Kristensen2005). In the NW and southwestern (SW) Barents Sea, surface and subsurface Atlantic Water flows are thought to be enhanced at approximately the same time intervals (e.g., Sarnthein et al., Reference Sarnthein, Van Kreveld, Erlenkauser, Grootes, Kucera, Pflaumann and Schulz2003; Husum and Hald, Reference Husum and Hald2004; Rasmussen et al., Reference Rasmussen, Thomsen, Ślubowska, Jessen, Solheim and Koç2007, Reference Rasmussen, Forwick and Mackensen2012; Aagaard-Sørensen et al., Reference Aagaard-Sørensen, Husum, Hald and Knies2010; Chistyakova et al., Reference Chistyakova, Ivanova, Risebrobakken, Ovsepyan and Ovsepyan2010; Risebrobakken et al., Reference Risebrobakken, Moros, Ivanova, Chistyakova and Rosenberg2010, Reference Risebrobakken, Dokken, Smedsrud, Andersson, Jansen, Moros and Ivanova2011; Berben et al., Reference Berben, Husum, Cabedo-Sanz and Belt2014).
Recent multiproxy reconstructions (e.g., Chauhan et al., Reference Chauhan, Rasmussen and Noormets2016; Ivanova et al., Reference Ivanova, Murdmaa, Emelyanov, Seitkalieva, Radionova, Alekhina and Sloistov2016) suggest significant Atlantic Water influence in the Barents Sea troughs and margins during the Heinrich stadial 1 (HS1; ca. 18–14.8 cal ka BP) and YD (12.9–11.7 cal ka BP) when the AMOC was weakened relative to the B/A and Holocene (McManus et al., Reference McManus, Francois, Gherardi, Keigwin and Brown-Leger2004). In the context of these studies, the NW Barents Sea with its narrow but relatively deep troughs, which presently serve as pathways for Atlantic Water, deserves special attention. In this study, we address the timing of Atlantic Water inflow and iceberg calving into the NW Barents Sea, as well as sea surface conditions and water column stratification related to changes in postglacial climate and thermohaline circulation in the Northern Atlantic and Arctic Ocean. Two accelerator mass spectrometry (AMS) 14C-dated sediment cores with abundant microfossils from the Kvitøya and Erik Eriksen troughs offer a rare opportunity to investigate the diachronous deglaciation processes and ages of the lithostratigraphic units and, in particular, to date the YD sediments in the Barents Sea. Surface and bottom-water conditions in the troughs are identified based on the new high-resolution benthic and planktic oxygen and carbon isotope, foraminiferal, and iceberg-rafted debris (IRD) time series. In core S2528 from the Kvitøya Trough, the dinocyst assemblages provide additional information on surface-water conditions. Collectively, the records reveal centennial-to-millennial variability in the Atlantic Water inflow and sea-ice conditions over the last ~20 ka, as well as changes in iceberg calving at the glacial termination.
STUDY AREA AND CORE LOCATIONS
Sediment cores S2528 (80°40.80′N, 29°36.70′E; water depth, 428 m) and S2519 (79°30.75′N, 28°41.68′E; water depth, 347 m) were raised by gravity corer from the Kvitøya and Erik Eriksen troughs, NW Barents Sea, during Cruise 25 of R/V Akademik Nikolaj Strakhov (Figs. 1 and 2a; supplementary interactive map) in 2007. Near site S2528, the Kvitøya Trough has a U-shaped transverse profile in its deeper parts, typical for glacier troughs. The Kvitøya Trough is partially separated from the Erik Eriksen Trough by a low sill (Fig. 2a). In the Erik Eriksen Trough, subtle hill-hole landforms dominate in the deepest depression around site S2519. The Erik Eriksen Trough is connected to the western branch of the Franz Victoria Trough system through the unnamed deep northeast of Kong Karls Land (e.g., Hogan et al., Reference Hogan, Dowdeswell, Noormets, Evans, Ó Cofaigh and Jakobsson2010b, Reference Hogan, Dowdeswell, Hillenbrand, Ehrmann, Noormets and Wacker2017). Details on the morphology of the Kvitøya and Erik Eriksen troughs can be found in Zayonchek et al. (Reference Zayonchek, Mazarovich, Lavrushin, Sokolov, Khutorskoi, Abramova and Aliulov2009) and Hogan et al. (Reference Hogan, Dowdeswell, Noormets, Evans and Ó Cofaigh2010a, Reference Hogan, Dowdeswell, Noormets, Evans, Ó Cofaigh and Jakobsson2010b).
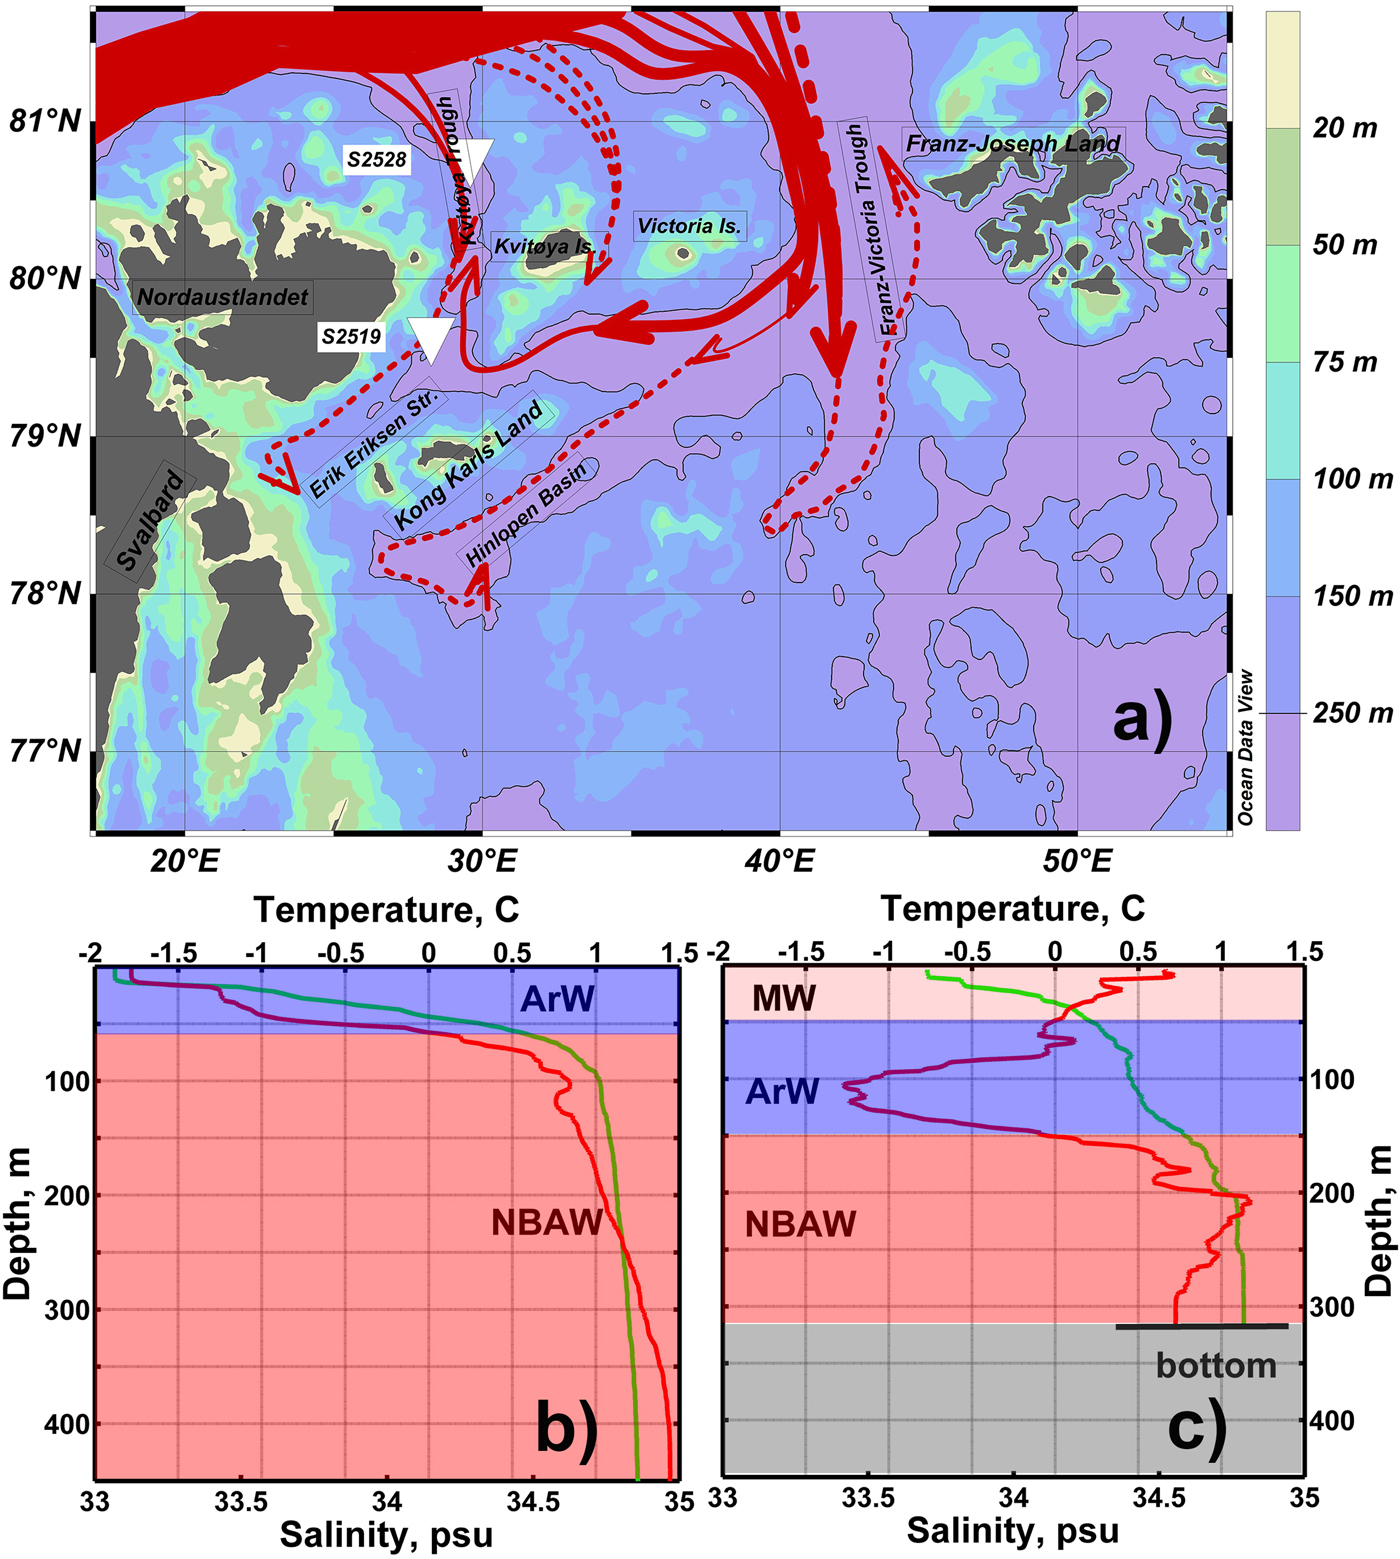
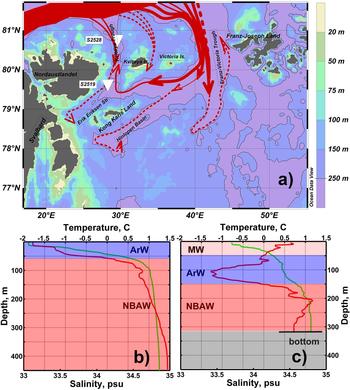
Figure 2. (a) Schematic of bathymetry and subsurface circulation of Northern Barents Atlantic-derived Water (NBAW) modified from (Tantsyura, Reference Tantsyura1959; Novitsky, Reference Novitsky1961; Pfirman et al., Reference Pfirman, Bauch, Gammelsrød, Johannessen, Muench and Overland1994; Ozhigin et al., Reference Ozhigin, Ingvaldsen, Loeng, Boitsov, Karsakov, Jakobsen and Ozhigin2011). Solid and dotted red arrows show the NBAW flow, which is observed at any oceanographic sections carried out during the last 75 years and in some specific years (with abnormally high rate of the Atlantic Water flow), respectively. The contour 250 m is highlighted. The core locations are marked by white triangles. ArW, Arctic Water; MW, Melt Water. This map was generated with “Ocean Data View” (Schlitzer, Reference Schlitzer2015). Typical vertical temperature (red line) and salinity (green line) profiles of the study area: near core site S2528 (b) and near core site S2519 (c) selected from the World Ocean Database (https://www.nodc.noaa.gov/OC5/SELECT/dbsearch/dbsearch.html [accessed 14.08.2017]). See text for details. (For interpretation of the references to color in this figure legend, the reader is referred to the web version of this article.)
The flow of Atlantic Water, and hence heat transport, into the Barents Sea occurs mostly from the southwest, by the North Cape Current (Fig. 1; Pfirman et al., Reference Pfirman, Bauch, Gammelsrød, Johannessen, Muench and Overland1994; Smedsrud et al., Reference Smedsrud, Esau, Ingvaldsen, Eldevik, Haugan, Li and Lien2013). The modified Atlantic Water circulating northeastward in the Fram Strait spreads in the subsurface layer along the Eurasian continental slope and enters the Barents Sea through the relatively deep (400–600 m) Kvitøya and Franz Victoria troughs, as well as the St. Anna Trough in the Kara Sea (Fig. 1; Pfirman et al., Reference Pfirman, Bauch, Gammelsrød, Johannessen, Muench and Overland1994; Lind and Ingvaldsen, Reference Lind and Ingvaldsen2012). Although the Kvitøya Trough is narrower and shallower than other troughs, hydrographic data demonstrate subsurface-to-bottom Atlantic Water inflow from the northwest and farther southward into the Erik Eriksen Trough (Fig. 2a). Arctic Water (ArW) also penetrates into the Kvitøya–Erik Eriksen trough system from the north and northeast above the denser Atlantic Water.
The northern Barents Sea is partly or completely covered by drifting sea ice almost year-round, unlike the generally sea-ice–free southwestern sector (e.g., Barry et al., Reference Barry, Serreze, Maslanik and Preller1993). The water column is stratified with cold (<0°C) and relatively fresh (32–34.6 psu) ArW overlying the warm (0 < T < 1.5°C) and saline (34.45–34.95 psu) Atlantic-derived or Atlantic modified water, also called Northern Barents Atlantic-derived Water (NBAW) (Pfirman et al., Reference Pfirman, Bauch, Gammelsrød, Johannessen, Muench and Overland1994, Ozhigin et al., Reference Ozhigin, Ingvaldsen, Loeng, Boitsov, Karsakov, Jakobsen and Ozhigin2011). Cold (−1.9–0°C) and saline (34.9–35.2 psu) bottom water is occasionally observed beneath the NBAW in the bottom depressions below 450 m. It is generated by brine formation during winter freezing (Midttun, Reference Midttun1985) and mixing with the NBAW. Cold high-salinity waters periodically move down the slopes from the local elevations of the bottom topography. Ice melting during the warm season produces a surface Melt Water (MW) layer above the ArW in the northern Barents Sea. The MW layer has low salinity (31–34.3 psu) and positive temperature but might be as warm as 4–5°C because of seasonal solar heating (Ozhigin et al., Reference Ozhigin, Ingvaldsen, Loeng, Boitsov, Karsakov, Jakobsen and Ozhigin2011).
To characterize the water column at sites S2528 and S2519 in summer, we used conductivity-temperature-depth data available from previous expeditions by R/V Ymer (September 1980) and R/V Johan Hjort (September 2001), respectively. At site S2528, the temperature of the upper 20 m in the mixed layer is close to freezing point, which is typical of the Kvitøya Trough even in the warm season (Fig. 2b) under the high concentration of drifting ice. The NBAW is observed below the pycnocline, at depths ranging from ~60 m to the bottom. At site 2519, the ArW is found from 50 to 150 m, in between the NBAW and MW (Fig. 2c).
The pycnocline and thermocline levels are strongly dependent on seasonal heating and prevalent sea-ice conditions. In the study area, annual primary production calculated using a SeaWiFs-based model is <30 gC/m2/yr (Hill et al., Reference Hill, Matrai, Olson, Suttles, Steele, Codispoti and Zimmerman2013).
MATERIAL AND METHODS
Seismic profiling
Nonparametric profiler EdgeTech 3300 with a vertical resolution of 1 to 0.1 m was used to study the upper 30–100 m of the sedimentary section. Frequency-modulated signal from 2 to 5 kHz (the frequency 3.5 kHz) and duration of 100 milliseconds was used to achieve maximum penetration.
Sediment core processing
Sediment cores S2528 (385 cm) and S2519 (355 cm) were visually described and sampled continuously in 3- to 4-cm-thick sediment slices aboard the ship. From core S2519, AMS-14C dates, grain-size distribution, IRD rock types (from five samples), and down-core relative abundance of the species Cassidulina teretis (CT) were reported by Ivanova et al. (Reference Ivanova, Murdmaa, Emelyanov, Seitkalieva, Radionova, Alekhina and Sloistov2016). Here, the core chronology is revised, and new foraminiferal and isotope records are provided. All data from S2528 are presented here for the first time.
On land, the weighed samples were wet sieved through 0.05-mm and 0.1-mm mesh sieves. Each fraction was dried at 40°C, weighed, and used for micropaleontological and isotope studies. The dry fractions >0.1 mm were sieved through a 2-mm mesh sieve to study coarse-grained rock fragments. The weight percentages of the fractions >0.1 and >2 mm are considered as measures of total and coarse-grained IRD contents in dry sediments, respectively. Main rock types of clasts >2 mm were identified visually and under binocular microscope. Rock type percentages were counted in five representative samples from the basal diamicton layer of core S2528.
CaCO3 and total organic carbon (TOC) contents were measured by the express carbon analyzer AN 7529 (with a reproducibility of 0.005% of carbon).
Chronology
Twelve AMS-14C measurements on mollusk shells and benthic foraminiferal tests have been made from core S2528 (Table 1). In core S2519, only two samples contained the requisite amount of material for dating. All radiocarbon dates were calibrated to calendar ages using the CALIB 7.1 software and Marine 13 calibration data set with a standard reservoir correction of 405 yr (Stuiver and Reimer, Reference Stuiver and Reimer1993; Reimer et al., Reference Reimer, Bard, Bayliss, Beck, Blackwell, Ramsey and Buck2013; Stuiver et al., Reference Stuiver, Reimer and Reimer2018) with a ΔR of 71 ± 21 yr accounting for local reservoir effect (Mangerud et al., Reference Mangerud, Bondevik, Gulliksen, Hufthammer and Høisæter2006). The age of the core top in both cores is set to the year of coring (i.e., 2007).
Table 1. Accelerator mass spectrometry (AMS) 14C dates and calibrated ages from core S2528. The calibration is based on CALIB 7.1 with Marine13 calibration curve (Reimer et al., Reference Reimer, Bard, Bayliss, Beck, Blackwell, Ramsey and Buck2013) and ΔR = 71 ± 21 (Mangerud et al., Reference Mangerud, Bondevik, Gulliksen, Hufthammer and Høisæter2006). The dates that are not used in the final age-depth model are indicated in italics. Lab codes: CAMS, Lawrence Livermore National Laboratory; OS, NOSAMS facility at the Woods Hole Oceanographic Institution; Poz, Poznań Radiocarbon Laboratory.
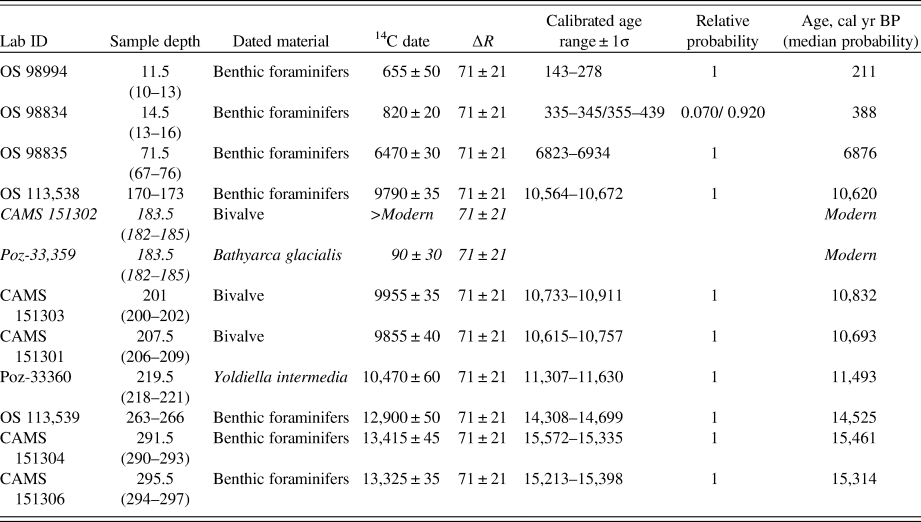
Note: Core S2519 dates from (Ivanova et al., Reference Ivanova, Murdmaa, Emelyanov, Seitkalieva, Radionova, Alekhina and Sloistov2016) 6390 ± 40 at 155.5 cm (6780 cal yr BP) and 11,040 ± 60 at 250.5 cm (12,520 cal yr BP).
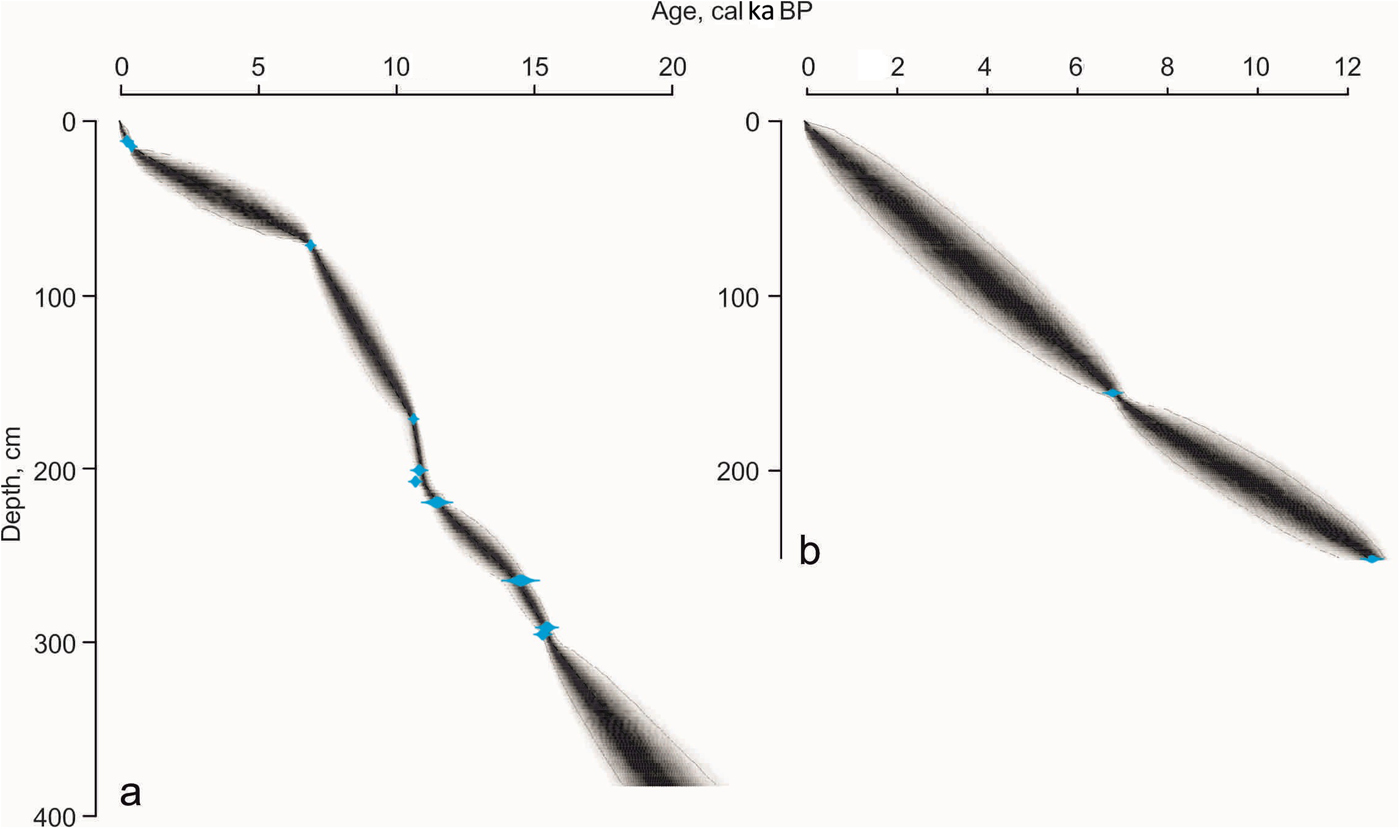
In core S2528, 10 of 12 AMS-14C dates were included in the final age-depth model. Two dates were excluded as they provided a modern age likely because of a handling artifact and sliding of Bathyarca glacialis shell from the core top to 183.5 cm. Bayesian age-depth modeling implemented in R with the software Bacon was applied to construct the age-depth models for core S2528 and the upper part of core S2519 (Blaauw and Christen, Reference Blaauw and Christen2011; R Development Core Team, 2016). The ages are given in cal ka BP (thousands of calendar years before AD 1950). Sedimentation rates were estimated within the dated intervals using the obtained age-depth models.
Foraminiferal study
Planktic foraminifers (PFs) and benthic foraminifers (BFs) were identified to a species level using taxonomy from Feyling-Hanssen et al. (Reference Feyling-Hanssen, Jørgensen, Knudsen and Andersen1971) and Hayward et al. (Reference Hayward, Cedhagen, Kaminski and Gross2017). Where possible, 100–200 PF and 100–400 BF specimens were identified and counted from the sample aliquot >0.1 mm. In all samples, total abundances (tests per gram of dry weight sediment) were estimated separately for BFs and PFs. BF and PF accumulation rates (ARs) were also calculated according to the formula BFAR/PFAR (tests/cm2/ka) = sedimentation rates (cm/ka) × dry bulk density (DBD; g/cm3) × BF/PF abundance (tests/g) assuming DBD = 1 g/cm3.
Species percentages were calculated in 70 and 47 samples from cores S2528 and S2519, respectively, containing at least 100 BF specimens. PFs were generally less common and represented only by Neogloboquadrina pachyderma (sin.).
Stable isotope measurements in foraminifers
Stable isotopes (δ18O and δ13C) were measured on monospecific PF and BF samples from the grain-size fraction >0.1 mm via the automated carbonate preparation device Kiel IV in a Finnigan MAT 253 mass spectrometer (Leibniz Laboratory at Kiel University) and on a Multicarb-preparation device coupled to an IsoPrime isotope ratio mass spectrometer (Geotop, Université du Québec à Montréal).
In core S2528, measurements were carried out on 10 to 20 specimens of PF N. pachyderma (sin.) (NPS) (49 samples) and 4 benthic species: Elphidium excavatum forma clavata (EEC; 10–20 specimens, 84 samples), Melonis barleeanus (MB; 10–20 specimens, 59 samples), CT (20–40 specimens, 27 samples), and Cibicides lobatulus (CL; 3–7 specimens, 28 samples). In core S2519, only NPS and EEC were sufficiently abundant and well preserved for measurements from 2 and 33 samples, respectively. The samples were crushed and cleaned in an ultrasonic bath before being measured. Duplicate measurements were done for several samples and the sample mean was used. All results are reported in δ-notation versus Vienna Pee Dee belemnite. The precision of measurements was ± 0.08‰ for δ18O and ± 0.06‰ for δ13C at Kiel Laboratory and ± 0.05‰ at 1σ level for both isotopes at the Geotop Laboratory.
Benthic δ18O values have been corrected for disequilibrium with surrounding water: CL, +0.58‰ (Poole, Reference Poole1994); EEC, +0.55‰ (Duplessy et al., Reference Duplessy, Cortijo, Ivanova, Khusid, Labeyrie, Levitan, Murdmaa and Paterne2005); and MB, +0.4‰ (Ivanova et al., Reference Ivanova, Ovsepyan, Risebrobakken and Vetrov2008). CT calcifies close to equilibrium (Jansen et al., Reference Jansen, Bleil, Henrich, Kringstad and Slettmark1988); thus, no correction has been applied. All oxygen isotope results were corrected for ice volume effect after Fairbanks (Reference Fairbanks1989) and Peltier and Fairbanks (Reference Peltier and Fairbanks2006), although we acknowledge that there might be some biases because of absolute age uncertainties in the lower part of the core S2528.
Dinocysts
The dinoflagellate cysts (dinocysts) and other palynomorphs were identified and counted from slides after palynological preparations following the methods described in de Vernal et al. (Reference de Vernal, Bilodeau and Henry2010). A minimum of 300 dinocysts were identified following the nomenclature provided by Rochon et al. (Reference Rochon, de Vernal, Turon, Matthiessen and Head1999), de Vernal et al. (Reference de Vernal, Henry, Matthiessen, Mudie, Rochon, Boessenkool and Eynaud2001), and Head et al. (Reference Head, Harland and Matthiessen2001). Reworked palynomorphs included pollen, spores, dinocysts, and acritarchs of pre-Quaternary age, which were differentiated from recent palynomorphs based on their taxonomic identity and preservation state. The concentrations of dinocysts and total reworked palynomorphs were expressed as individuals per cubic centimeter of sediment. Relative abundances of dinocysts taxa were calculated from the sum of dinocysts counted.
RESULTS
Seismic profiling
EdgeTech 3300 seismic profiles from both Erik Eriksen and Kvitøya troughs recorded the sedimentary sections to a subbottom depth of ~10–30 m (Fig. 3). The profiles run across undulating glacial landforms described in detail by Hogan et al. (Reference Hogan, Dowdeswell, Noormets, Evans and Ó Cofaigh2010a, Reference Hogan, Dowdeswell, Noormets, Evans, Ó Cofaigh and Jakobsson2010b). The upper, acoustically transparent seismic unit SU-I is 2–4 m thick and drapes the underlying topographic features, which are reflected by the opaque SU-II unit, the thickness of which is unknown at the core sites. The sharp boundary between units SU-I and SU-II is traced wherever deposits of unit SU-II are available.

Figure 3. EdgeTech 3300 seismic profiles (3.5 kHz) from the Kvitøya Trough across the core site S2528 (upper panel) and Erik Eriksen Trough (lower panel) and log of the cores (profiles close-up). The upper profile shows the drumlin-like landforms. The lower profile ends at the site S2519. The interpretation of the seismic (SU) and lithostratigraphic units (I, marine sediments; II, distal glaciomarine sediments; III, proximal glaciomarine sediments) is shown by the core log with the chronology (in cal yr BP) on the right.
Core S2528 was retrieved from a drumlin-like feature in the deepest part of the Kvitøya Trough where the seismic profile crossed a series of glacial sedimentary lineations oriented along the trough, reported by Hogan et al. (Reference Hogan, Dowdeswell, Noormets, Evans, Ó Cofaigh and Jakobsson2010b). At the core site, a 3-m-thick acoustically transparent SU-I is underlain by an intermittently strong reflector concordant to the bottom topography (Fig. 3). The seismic profile ending near site S2519 runs close to the Erik Eriksen Trough axis and reveals a rough bottom topography of irregular steep-sloped hills and holes with amplitudes of 5–20 m (Fig. 3). Core S2519 was retrieved from a small, likely glacier-eroded, depression filled with SU-1 (about 3 m thick) and SU-II (of unknown thickness) units both having concordantly undulating surfaces (Fig. 3).
Lithostratigraphy
In the open Barents Sea and notably in the study area, the regional lithostratigraphic frame covering the last 20 ka includes four units with diachronous boundaries (Fig. 4; Ivanova et al., Reference Ivanova, Murdmaa, Duplessy and Paterne2002, Reference Ivanova, Murdmaa, Emelyanov, Seitkalieva, Radionova, Alekhina and Sloistov2016; Murdmaa et al., Reference Murdmaa, Ivanova, Duplessy, Levitan, Khusid, Bourtman, Alekhina, Alekseeva, Belousov and Serova2006). Unit IV, represented by moraine sediments, corresponds to the end of the LGM. Unit III of the early deglaciation (ED) generally consists of proximal glaciomarine sediments (diamicton). Unit II, roughly encompassing B/A interstade and YD stade, contains distal relatively fine-grained glaciomarine sediments. The Holocene unit I is represented by marine hemipelagic muds. Both cores, S2528 and S2519, contain units III–I recovering the postglacial stage of the Barents Sea evolution.

Figure 4. (color online) Tentative correlations between the lithostratigraphic frame for the Barents Sea modified from (Ivanova et al., Reference Ivanova, Murdmaa, Emelyanov, Seitkalieva, Radionova, Alekhina and Sloistov2016) and proposed in this study, the Northern Hemisphere (NH) stratigraphy and NGRIP climatic record (North Greenland Ice Core Project members, 2004). For lithostratigraphic units see Figure 3; hypothetical unit boundaries (i.e., insufficiently well dated) are shown by a question mark. B/A, Bølling/Allerød; HS1, Heinrich stadial 1; LGM, last glacial maximum; YD, Younger Dryas. Note the diachronous boundaries of units III/II in the Kvitøya Trough and Erik Eriksen Trough and likely also boundary II/I in the latter trough, as compared with the regional framework.
The basal unit III (385–326 cm in core S2528 and 348–274 cm in core S2519; Fig. 5) is represented by a diamicton that consists of a disordered mixture of unsorted coarse-grained material (from terrigenous sand to pebble-size rock fragments) and fine-grained matrix (clayey mud). Rock fragments in both cores are unsorted and mainly angular, supporting their ice-rafted (likely iceberg-rafted) origin. The wide variability of rock types (>10 per sample) supports iceberg rafting (Fig. 5; Lisitzin, Reference Lisitzin2002). In core S2528, the diamicton consists of 15–30% of material from the size fraction >0.1 mm. The 82% peak of this fraction, 50% of which is sand (0.1–2 mm) at 330 cm, likely represents a grain-flow deposit. The diamicton from core S2519 contains more abundant IRD and consists of two coarse layers with up to 40% of fractions >0.1 mm (Fig. 5).
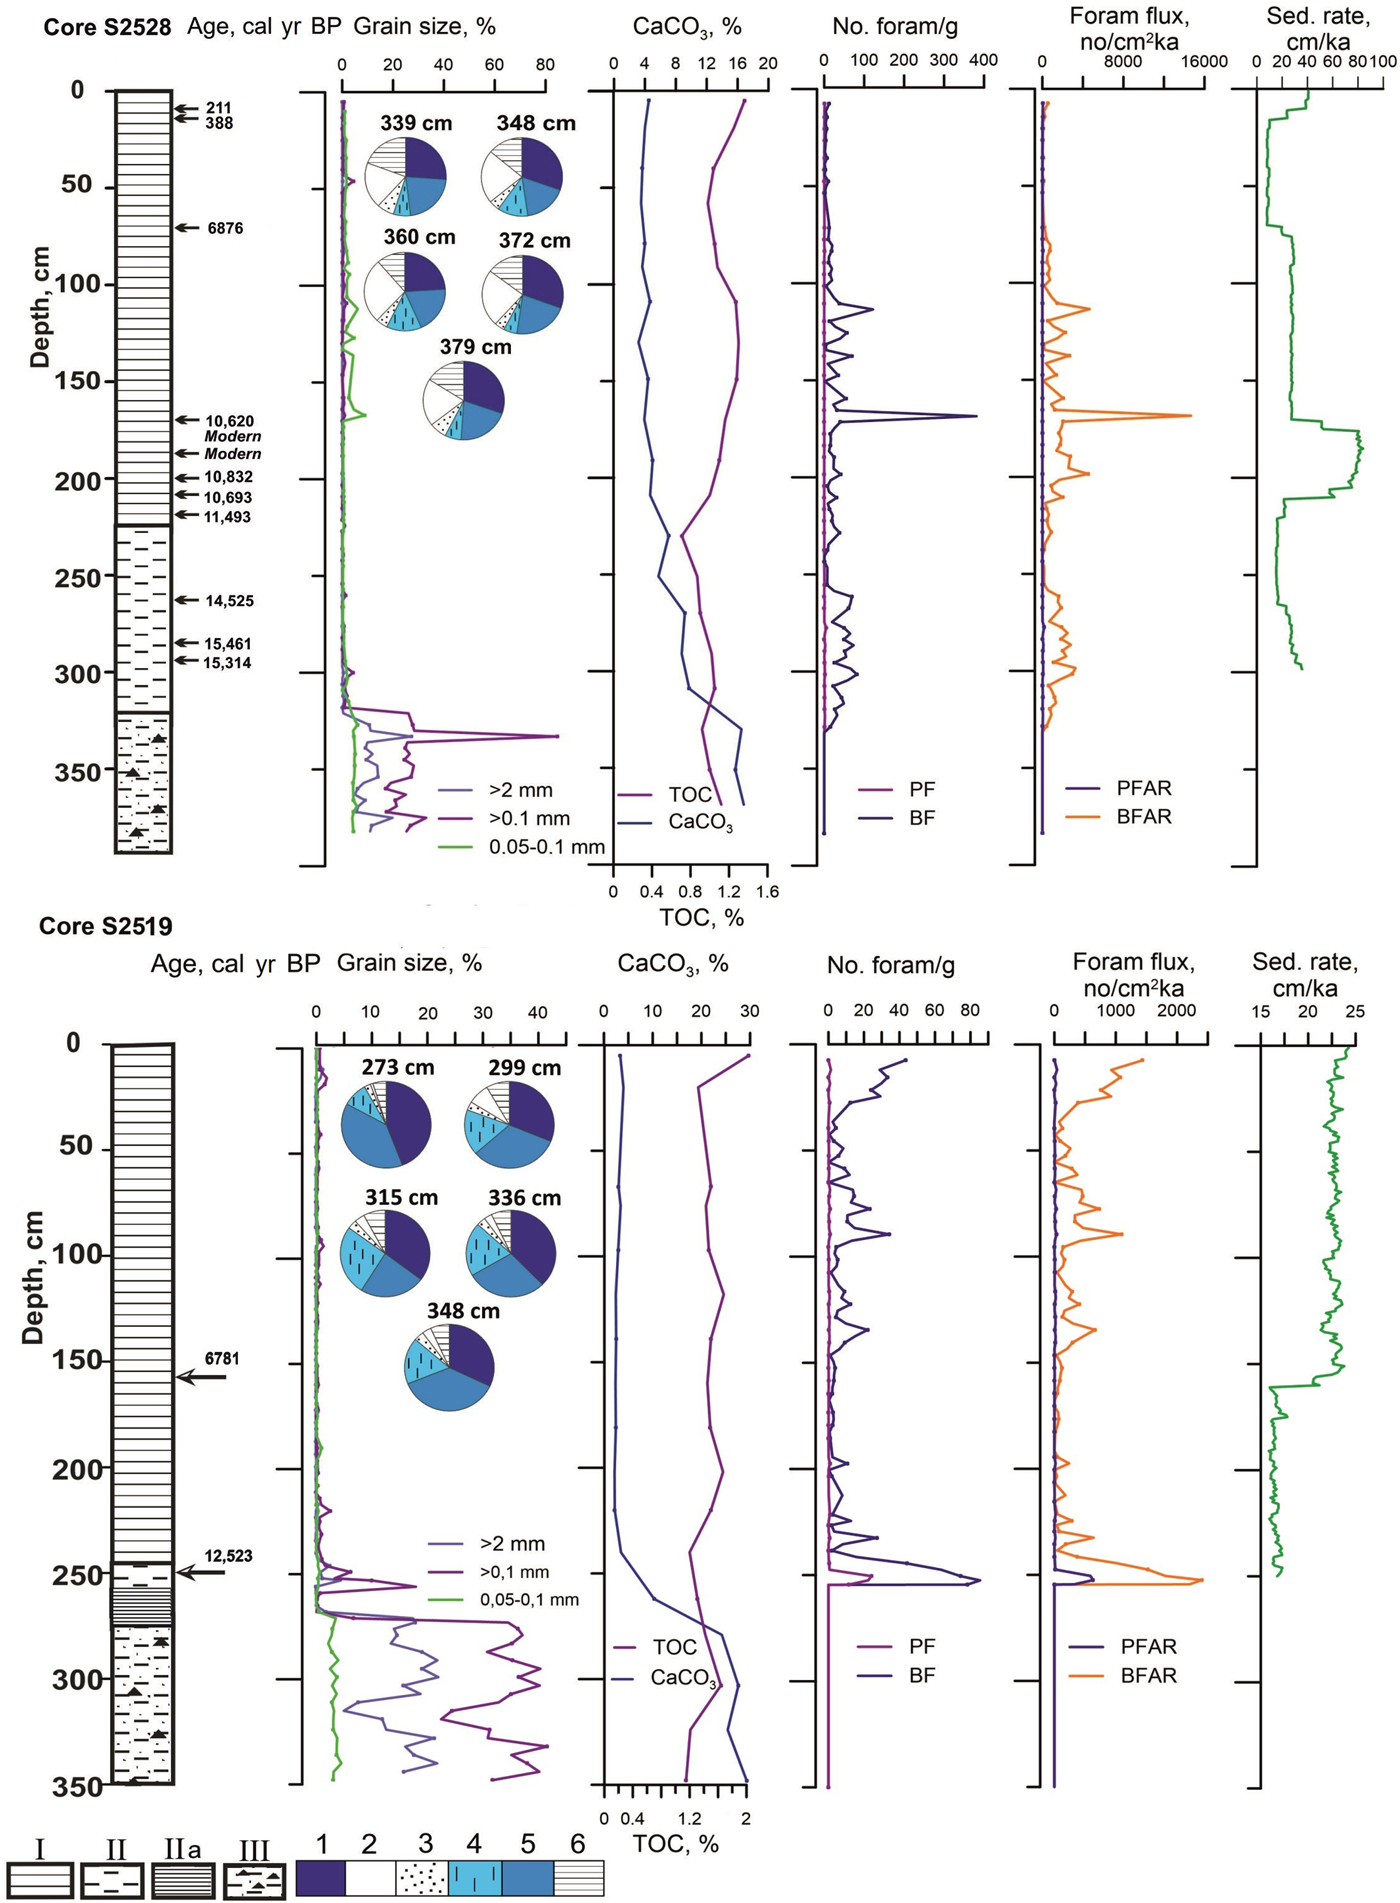
Figure 5. (color online) Cores S2528 and S2519: lithology, chronology, grain size, CaCO3 and total organic carbon (TOC) content, petrography of iceberg-rafted debris from selected diamicton samples, planktic (PF) and benthic (BF) foraminiferal abundance and fluxes (or accumulation rates, AR), and sedimentation rates (sed. rate). For lithostratigraphic units, see Figure 3. Rock types: 1, claystone; 2, granite and metamorphics; 3, sandstone; 4, chert; 5, limestone; 6, others. Lithology, petrography, and grain size of the core S2519 from Ivanova et al. (Reference Ivanova, Murdmaa, Emelyanov, Seitkalieva, Radionova, Alekhina and Sloistov2016).
Fragments of white limestone, dark-gray to black claystone (“black shale”), gray sandstone, and chert prevail in the diamicton fraction >2 mm from both cores. The diamicton from core S2528 contains more granite and metamorphic rock than in core S2519. This is in line with the regional geologic map that shows exposures of Proterozoic granitic-metamorphic rocks in the Kvitøya Trough area, whereas outcrops of Carboniferous limestones, Jurassic shales, and Cretaceous sandstones are found farther south (Lauritzen and Ohta, Reference Lauritzen and Ohta1984). Glacial erosion of limestones is apparently responsible for the high CaCO3 content, including the coarse fractions (IRD) and the fine-grained matrix. The TOC content ranges from 0.8% to 1.2% in core S2528 and 1.2% to 1.6% in core S2519 (Fig. 4). A sharp change in sediment color, disappearance of coarse IRD, decrease in CaCO3, and increase in foraminiferal abundance separates unit III from the overlying unit II (Fig. 5) (and SU-2 from SU-1; Fig. 3).
Unit II (core S2528, 326–223 cm; core S2519, 274–249 cm; Fig. 5) is different in between the locations. In core S2528, the 93-cm-thick rather homogeneous unit consists of brownish-gray clayey mud with very low coarse fraction (>0.1 mm) content. In core S2519, the same unit is only 25 cm thick and consists of two distinct subunits, possibly separated by a hiatus. The lower 18-cm-thick subunit with a sharp basal contact is represented by clayey mud with alternation of millimeter-scale brown and gray parallel laminae, similar to that described in unit II from the open Barents Sea (e.g., Murdmaa et al., Reference Murdmaa, Ivanova, Duplessy, Levitan, Khusid, Bourtman, Alekhina, Alekseeva, Belousov and Serova2006; Klitgaard-Kristensen et al., Reference Klitgaard-Kristensen, Rasmussen and Koç2013). The upper 7-cm-thick subunit consists of a gray sandy mud fining upward and containing gravel grains. In unit II, the CaCO3 content decreases upward from 18–14% to less than 5% in the Holocene unit I (Fig. 5), probably because of a reduction of detrital calcite input. The TOC content decreases slightly to the minimum values of 0.6–1.2% at the unit II/unit I boundary.
The gradual transition from unit II to unit I is expressed by a color change to greenish olive gray of various shades, an increase in TOC and foraminiferal abundance, as well as the appearance of authigenic iron sulfide (hydrotroilite) indicating microbial sulfate reduction. Polychaeta tubes found in the upper part of the section suggest bioturbation. Unit I consists of homogeneous clayey mud with a low but variable sand admixture. The CaCO3 content is evenly low (2–5%) throughout unit I. The TOC content is lower (0.98–1.36%) in core S2528 than in core S2519 (1.32–2.03%).
Chronology and sedimentation rates
According to the age-depth model with extrapolation of sedimentation rates below the oldest dates, core S2528 likely covered >17 cal ka BP (Fig. 6a, Table 1). Although a Bayesian approach can lead to overestimation in the lower part of the section where extrapolation is made (Blaauw, Reference Blaauw2010), the age ca. 17 cal ka BP of the boundary unit II/unit III located ~30 cm below the lowermost date (15.4 cal ka BP) seems to be satisfactorily reliable (Fig. 5).

Figure 6. (color online) Age-depth model for cores S2528 (a) and S2519 (b) constrained by applying Bayesian modeling to calibrated accelerator mass spectrometry 14 C dates from Table 1. Note that the Bayesian model provides rather old ages in the lower part of core S2528 (>3 m) where the extrapolation is applied; therefore, the ages >15.4 cal ka BP are used only tentatively.
Considering the age model of core S2528 in the context of aforementioned regional stratigraphy (Fig. 4), unit III (385–326 cm) is estimated to cover the ED, older than ca. 17 cal ka BP; unit II (326–223 cm) ranges from ca. 17 to 11.7 cal ka BP (middle–late deglaciation); and unit I (223–0 cm) corresponds to the last 11.7 cal ka BP (Holocene; Fig. 6a). In core S2528, the lower boundary of unit II is diachronous relative to other Barents Sea sites where it roughly corresponds to the transition from the Oldest Dryas (or HS1) to Bølling (Fig. 4; Ivanova, Reference Ivanova2009; Ivanova et al., Reference Ivanova, Murdmaa, Emelyanov, Seitkalieva, Radionova, Alekhina and Sloistov2016).
In core S2519, the boundary between unit III (348–274 cm) and unit II (274–249 cm) cannot be dated because of the lack of suitable material. Extrapolation is not applied below the oldest date (11,040 ± 60 14C yr BP at 249–252 cm; Table 1) because of the significantly reduced thickness of unit II (only 25 cm; Figs. 5 and 6b) in comparison with previously studied Barents Sea cores (e.g., Lubinski et al., Reference Lubinski, Polyak and Forman2001; Murdmaa et al., Reference Murdmaa, Ivanova, Duplessy, Levitan, Khusid, Bourtman, Alekhina, Alekseeva, Belousov and Serova2006). The lower boundary of unit I in core S2519 (249 cm) would correspond to an age of 12.39 cal ka BP. The seemingly older age of the onset of unit I in this core might reflect a diachronous development of Holocene marine conditions or arises from age model uncertainty (Figs. 4 and 6b).
The age models suggest sedimentation rates ranging from 8 to 84 cm/ka in core S2528 and from 16 to 24 cm/ka in core S2519 (within the interval 0–252 cm) (Fig. 5). Hence, the sampling resolution at 3–4 cm interval provides a temporal resolution between 18 and 340 yr. In core S2519, the sedimentation rate seems to be almost 1.4 times higher in the upper part of the section (Fig. 5) corresponding to the late Holocene. In core S2528, the significant changes in the sedimentation rates correspond to the interval with denser AMS-14C dating (Fig. 5).
Oxygen and carbon isotopes
In core S2528, δ18O values recorded by NPS are within the range of 3.5‰ to 2.5‰, with relatively low values during the deglaciation, peaking at ~2.2‰ during the YD (Fig. 7). NPS δ18O values then increased sharply by approximately 1‰ at the YD/Preboreal transition. Values of about 3.5‰ are recorded throughout the Holocene with some superimposed variability.

Figure 7. (color online) Combined stable isotope time series from cores S2528 and S2519. BA, Bølling/Allerød; ED, early deglaciation; YD, Younger Dryas. Species: CL, Cibicides lobatulus; CT, Cassidulina teretis; EEC, Elphidium excavatum forma clavata; MB, Melonis barleeanus; NPS, Neogloboquadrina pachyderma (sin.). Note tentative age model below 15.4 cal ka BP.
The benthic δ18O values are also lower during the deglaciation than during the Holocene (Fig. 7). EEC and CL show δ18O values of about 3–3.5‰ during the ED. CL and CT measurements are not available for sediments younger than 15 and 10 cal ka BP, respectively. EEC and MB δ18O values demonstrate a general increasing trend of 1.5–2‰ from 14.8 to 14.6 until ca. 8 cal ka BP. The only high EEC value of 4.7‰ at YD is most likely an outlier. MB and especially CT δ18O values are strongly depleted at the YD, down to 2.35‰ for the latter species. In the Holocene, EEC and MB demonstrate comparable δ18O values (about 3.6–4.3‰) except for an offset of up to 1‰ within the intervals 10.2–8.4 and 7–4 cal ka BP.
In core S2519, the only two available planktic measurements indicate an increase in δ18O from YD to the Holocene, from 2.5‰ to 3.4‰, similar to the contemporary increase in core S2528 (Fig. 7). Increasing EEC δ18O values are inferred for the YD, from 3‰ to 3.6‰, unlike in core S2528. During the last 7 ka, EEC δ18O values vary about 4.2‰; hence, the bottom water at site S2519 has been about 0.4‰ more enriched in δ18O than at site S2528.
In core S2528, benthic δ13C values show species-specific offsets (Fig. 7). The epifaunal CL records the most enriched values of about 1–1.8‰ over the ED. The δ13C of infaunal species records negative values ranging from −0.9‰ to −0.1‰ and from −1.6‰ to −0.1‰ in CT and MB, respectively. EEC shows more depleted values varying between −2.2‰ and −0.9‰. In core S2519, EEC δ13C shows about the same range of variability as in core S2528. The planktic δ13C values vary from −0.2‰ (in core S2528) to 0.6‰ (in both cores).
Planktic and benthic foraminifers
The ED unit III is almost barren of foraminifera in both cores. However, some samples from core S2528 contain rare specimens of calcareous BFs including Cibicides lobatulus, Melonis barleeanus, Buccella tenerrima, Dentalina sp., Quinqueloculina sp., Miliolinella sp., Haynesina orbiculare, Elphidium excavatum forma clavata (hereafter referred to as E. clavatum), and more abundant Elphidiella arctica and E. groenlandica (Supplementary Appendix 1). Unexpectedly, several specimens of Cassidulina inflata (or C. limbata), C. subglobosa, Islandiella islandica, and I. californica are found in the 339–385 cm interval. The tests of C. inflata and I. californica are most likely reworked from the older sediments as these species were not previously described from the recent or postglacial sediments of the area. This assumption is supported by the occurrence of rare Mesozoic agglutinated foraminifers and abundant reworked pre-Quaternary palynomorphs.
In units II and I, PFs are scarce (<5 tests/g of dry sediment) in both core sections except for the YD interval in core S2519 (up to 24 tests/g; Fig. 5). Calculated PF fluxes are generally low (<174 tests/cm2/ka) with higher values during the YD in core S2519. PF assemblages strongly dominated by the polar species N. pachyderma (sin.) in a few samples include rare specimens of boreal and even tropical species (Supplementary Appendix 1). The down-core patterns of foraminiferal abundance and fluxes differ significantly between the two cores. In core S2528, calcareous BFs are more abundant in the lower parts of units II and I (up to 80–120 tests/g) with fluxes commonly ranging from 700 to 4700 tests/cm2/ka (Fig. 5). A short-term abundance peak of 380 tests/g at 10.4 cal ka BP most likely results from reworking. Very low values (<20 tests/g) and generally poor preservation are found over the last 8 ka. In core S2519, BFs appear upward from the lowermost part of unit II. BF abundance is higher than in core S2528 at some levels during the late Holocene and YD with the maximum value of 85 tests/g at 12.6 cal ka BP (flux 2400 tests/cm2/ka; Fig. 4). Otherwise, BF abundances are commonly <10 tests/g, while diversity varies from 2 to 20 species/sample in both cores during the Holocene and shows medium values (8–13 species/sample) during the deglaciation. Agglutinated BFs are extremely rare and generally broken in both sections.
The most common benthic species show rather similar down-core distribution patterns in both cores over the last 12.5 ka except E. clavatum, Buccella spp., and Nonion labradoricum (Fig. 8). In core S2528, the relative abundance of the most opportunistic Arctic species E. clavatum (e.g., Polyak et al., Reference Polyak, Korsun, Febo, Stanovoy, Khusid, Hald, Paulsen and Lubinski2002; Hald et al., Reference Hald, Ebbesen, Forwick, Godtliebsen, Khomenko, Korsun, Ringstad Olsen and Vorren2004) averages about 40% during the Holocene, except in the ca. 8–10 cal ka BP interval. The percentages of E. clavatum are very high during the HS1 (up to 80) and commonly low during the B/A and YD (0–20). In core S2519, the percentage of E. clavatum increased from the early to late Holocene (up to 40). Buccella spp. (B. hannai arctica + B. frigida + B. tenerrima) also record an increasing trend in core S2519 unlike rather stable values (<10) in core S2528.

Figure 8. (color online) Combined time series of indicative benthic foraminiferal species from the cores S2528 and S2519. Note that in core S2519 species distribution is shown within the dated interval. Combined Atlantic (Atl) species record represents the sum of Cassidulina teretis, Melonis barleeanus, Pullenia bulloides, Pullenia quinqueloba, and Trifarina angulosa. Other species are Cibicides (C.) lobatulus, Cassidulina (C.) reniforme, Nonion (N.) labradoricum, Elphidium (E.) clavatum. Note tentative age model below 15.4 cal ka BP. BA, Bølling/Allerød; ED, early deglaciation; YD, Younger Dryas.
The percentage of Islandiella spp. (I. norcrossi + I. helenae) generally remains below 20 in both cores with the lowermost values found in core S2528 during the HS1 and B/A. N. labradoricum shows a low percentage (up to 8) except for the high values (up to 40) during the early Holocene in core S2528. Another typical Arctic shelf species, Cassidulina reniforme, demonstrates the highest percentage during the early Holocene in core S2519 (up to 50) being less abundant in core S2528 (up to 20–25).
The species generally considered to have affinities with subsurface Atlantic Water include C. teretis (as C. neoteretis in several publications), Pullenia bulloides, P. quinqueloba, Trifarina angulosa, and M. barleeanus (Lubinski et al., Reference Lubinski, Polyak and Forman2001; Rasmussen et al., Reference Rasmussen, Thomsen, Ślubowska, Jessen, Solheim and Koç2007, Reference Rasmussen, Forwick and Mackensen2012; Ivanova, Reference Ivanova2009; Aagaard-Sørensen et al., Reference Aagaard-Sørensen, Husum, Hald and Knies2010; Chistyakova et al., Reference Chistyakova, Ivanova, Risebrobakken, Ovsepyan and Ovsepyan2010; Chauhan et al., Reference Chauhan, Rasmussen and Noormets2016). These species are common as a group throughout both records. They peak during Allerød in core S2528, during YD in both cores, and from 10.7 to 9.7 cal ka BP in core S2519 (Fig. 8). High percentages of C. teretis (up to 33%) are found as early as ~16 cal ka BP in core S2528. However, during the middle–late Holocene, the species content is generally much lower (<16%) in this core compared with higher values (20–40%) in core S2519. On the contrary, M. barleeanus is more typical at 10–7 cal ka BP in core S2528 and 12–9 cal ka BP in core S2519. The only common epibenthic species, C. lobatulus, is rather abundant (up to 15%) in the B/A and ED intervals in core S2528.
Palynological data and dinocyst assemblages of core S2528
Core S2528 contains abundant palynomorphs throughout the study sequence (Fig. 9). However, prior to 10.8 cal ka BP, the palynological assemblages are largely dominated by reworked pre-Quaternary palynomorphs, and the concentration of dinocysts is low. The interpretation of assemblages dominated by reworked material is not straightforward. Nevertheless, prior to 10.8 cal ka BP, the dinocyst assemblages are mostly dominated by the heterotrophic taxa Brigantedinium and Islandinium, which often characterize cold environments with dense sea-ice cover (e.g., de Vernal et al. Reference de Vernal, Henry, Matthiessen, Mudie, Rochon, Boessenkool and Eynaud2001, Reference de Vernal, Rochon, Fréchette, Henry, Radi and Solignac2013; Head et al. Reference Head, Harland and Matthiessen2001). Some samples from the ED and B/A intervals also contain a relatively high proportion of Operculodinium centrocarpum, Nematosphaeropsis labyrinthus, Spiniferites ramosus, and S. elongatus, suggesting an enhanced influence of Atlantic Water (e.g., Rochon et al., Reference Rochon, de Vernal, Turon, Matthiessen and Head1999).

Figure 9. (color online) Record of concentrations of dinoflagellate cysts and reworked palynomorphs reported on log scales and percentages of the main taxa in core S2528. Note tentative age model below 15.4 cal ka BP. BA, Bølling/Allerød; ED, early deglaciation; YD, Younger Dryas. N. labyrinthus, Nematosphaeropsis labyrinthus; O. centrocarpum, Operculodinium centrocarpum.
The interval younger than 10.8 cal ka BP is characterized by abundant dinocysts with concentrations ranging 103–105 cysts/cm3 (Fig. 9). A quasi-exclusive dominance of Islandinium spp. from 10.8 cal ka BP was abruptly replaced by an assemblage dominated by phototrophic taxa, notably O. centrocarpum, N. labyrinthus, and Spiniferites spp. at 7.8 cal ka BP. Maximum percentages of O. centrocarpum and minimum percentages of Islandinium spp. are recorded from ca 5.5 to 2 cal ka BP.
DISCUSSION
The multiproxy time series from cores S2528 and S2519 concordantly shed light on climatic and paleoceanographic events in the Kvitøya and Erik Eriksen troughs tightly related to changes in the AMOC during the deglaciation (Figs. 10 and 11). Regardless of uncertainties in the age models resulting from possible changes in the reservoir effect, the limited number of available radiocarbon dates, and other factors, our data clearly demonstrate the diachronous character of paleoenvironmental changes and associated lithostratigraphic units in the study area (Fig. 4). Importantly, the succession of units remains the same throughout the study area and the Barents Sea as a whole. Because of the age model uncertainties, paleoenvironmental changes in the NW Barents Sea could be only roughly correlated to the ED, B/A warming, YD cooling, and the Holocene intervals, which are previously dated at several Northern Hemisphere locations, notably in the Arctic (Figs. 10 and 11).

Figure 10. (color online) Time series of grain-size fractions, stable isotopes (δ18O and δ13C), and foraminiferal and dinocyst main taxa in core S2528. Note tentative age model below 15.4 cal ka BP. BA, Bølling/Allerød; ED, early deglaciation; YD, Younger Dryas. Species: CL, Cibicides lobatulus; CT, Cassidulina teretis; EEC, Elphidium excavatum forma clavata; MB, Melonis barleeanus; N. labyrinthus, Nematosphaeropsis labyrinthus; NPS, Neogloboquadrina pachyderma (sin.); O. centrocarpum, Operculodinium centrocarpum. VPDB, Vienna Pee Dee belemnite.

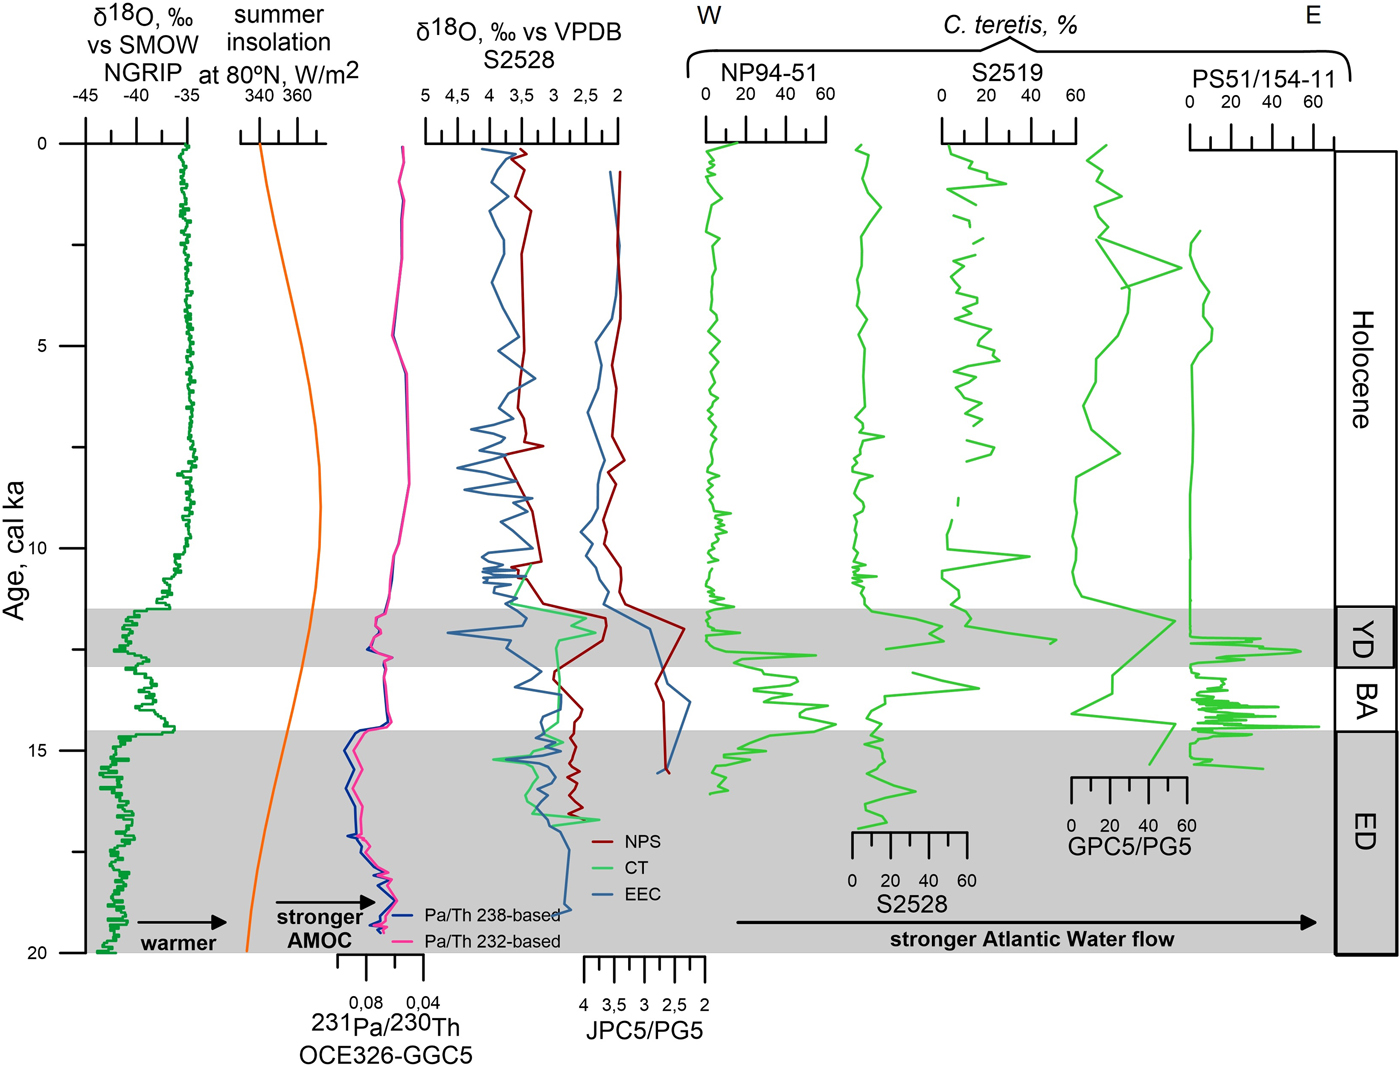
Figure 11. (color online) Tentative correlations between proxy time series from Greenland (North Greenland Ice Core Project members, 2004), summer insolation at 80°N (Laskar et al., Reference Laskar, Robutel, Joutel, Gastineau, Correia and Levrard2004), the North Atlantic (McManus et al., Reference McManus, Francois, Gherardi, Keigwin and Brown-Leger2004), the northern Svalbard margin (core NP94-51; Ślubowska et al., Reference Ślubowska, Koç, Rasmussen and Klitgaard Klitgaard-Kristensen2005), the Kvitøya and Erik Eriksen troughs (cores S2528 and S2519; this study), the Franz Victoria Trough (core JPC5/PG5; Lubinski et al., Reference Lubinski, Polyak and Forman2001), and the Laptev Sea (core PS51/154-11; Taldenkova et al., Reference Taldenkova, Bauch, Stepanova, Ovsepyan, Pogodina, Klyuvitkina and Nikolaev2012). All records from previous publications are shown on the original timescales. Note tentative age model of core S2528 below 15.4 cal ka BP and west-to-east direction of sites comparison in the right panel (stable isotopes and Cassidulina teretis). BA, Bølling/Allerød; ED, early deglaciation; YD, Younger Dryas. Species: CT, Cassidulina teretis; EEC, Elphidium excavatum forma clavata; NPS, Neogloboquadrina pachyderma (sin.). AMOC, Atlantic meridional overturning circulation; NGRIP, North Greenland Ice Core Project; SMOW, standard mean ocean water; VPDB, Vienna Pee Dee belemnite.
Ice sheet retreat and glaciomarine sedimentation
As is commonly accepted, deglaciation of the marine-based Barents Sea Ice Sheet was preceded by detachment of the glacier ice from the ground (e.g., Svendsen et al., Reference Svendsen, Alexanderson, Astakhov, Demidov, Dowdeswell, Funder and Gataullin2004; Hughes et al., Reference Hughes, Gyllencreutz, Lohne, Mangerud and Svendsen2016) likely because of the combined effect of sea level rise, geothermal heating from below, and penetration of relatively warm Atlantic Water beneath the ice. Several studies have argued for an asynchronous retreat of the ice sheet complex (e.g., Patton et al., Reference Patton, Hubbard, Andreassen, Auriac, Whitehouse, Stroeven, Shackleton, Winsborrow, Heyman and Hall2017).
Occurrence of the unit III diamicton at the base of both cores (Fig. 4) suggests that the Kvitøya and Erik Eriksen troughs were free of grounded ice sheet during the ED, likely before 17 cal ka BP at least in the former trough. According to Hughes et al. (Reference Hughes, Gyllencreutz, Lohne, Mangerud and Svendsen2016) and Patton et al. (Reference Patton, Hubbard, Andreassen, Auriac, Whitehouse, Stroeven, Shackleton, Winsborrow, Heyman and Hall2017), a rapid ice sheet retreat in the area began at ca. 19–18 and 17.8 cal ka BP, respectively A somewhat later retreat, since 16.5–15 cal ka BP, is suggested by Hogan et al. (Reference Hogan, Dowdeswell, Hillenbrand, Ehrmann, Noormets and Wacker2017) based on their interpretation of diamicton as a subglacial till. In any case, the date 15.7 cal ka BP above the diamicton from the nearby core JR142-GC11 (Fig. 1; Hogan et al., Reference Hogan, Dowdeswell, Hillenbrand, Ehrmann, Noormets and Wacker2017) supports the onset of deglaciation in the Kvitøya Trough not later than during the HS1. Geothermal activity discovered in the Kvitøya Trough (Zayonchek et al., Reference Zayonchek, Mazarovich, Lavrushin, Sokolov, Khutorskoi, Abramova and Aliulov2009; Polyak and Khutorskoy, Reference Polyak and Khutorskoy2018) might stimulate an earlier glacier detachment here than in the Erik Eriksen Trough. The high content of unsorted sand and gravel in the diamicton, as well as an angular shape of the grains, indicates iceberg rafting in both troughs (Fig. 5). The IRD petrography from the Kvitøya Trough shows significant provenance from Proterozoic rocks exposed in the northeastern (NE) Svalbard in addition to IRD from Paleozoic and Mesozoic sedimentary rocks, which dominate at the Erik Erikson Trough area. This difference in IRD petrography suggests a general northward iceberg drift along the troughs during the ED, when the major part of the Barents Sea was still covered by the ice sheet.
The decline in IRD content at the transition from unit III to unit II (Fig. 4) suggests cessation of iceberg rafting as early as ca. 17 cal ka BP in the Kvitøya Trough, possibly because of the ice sheet margin retreat above the coastline of surrounding islands. Drifting icebergs probably reached the depth of Atlantic Water, which promoted their melting (e.g., Chauhan et al., Reference Chauhan, Rasmussen and Noormets2016). IRD released at site S2519 was captured by a local eddy/gyre over the deep topographic hole, which explains high coarse fraction content in the diamicton (Fig. 5). In the Erik Eriksen Trough, the iceberg rafting perhaps reappeared in the YD during a short-term ice margin readvance. In the B/A, laminated sediment without coarse material deposited in the Erik Eriksen Trough (Fig. 5). The thin parallel lamination is typical of the B/A sediments in the open Barents Sea (Polyak and Solheim, Reference Polyak and Solheim1994; Lubinski et al., Reference Lubinski, Polyak and Forman2001; Murdmaa et al., Reference Murdmaa, Ivanova, Duplessy, Levitan, Khusid, Bourtman, Alekhina, Alekseeva, Belousov and Serova2006; Klitgaard-Kristensen et al., Reference Klitgaard-Kristensen, Rasmussen and Koç2013). The reduced thickness of unit II in core S2519, as compared with other locations (e.g., nearby core JR142-GC07; Hogan et al., Reference Hogan, Dowdeswell, Hillenbrand, Ehrmann, Noormets and Wacker2017), suggests that the B/A deposit was partly eroded by bottom currents and that unit II likely contains a hiatus. Absence of any laminated interval in core S2528 can be explained by its location near the crest of a subglacial drumlin (Fig. 3), aside from meltwater suspension flows likely responsible for the lamination.
The documented time transgressive terminus of iceberg calving is in line with previously published findings of coarse IRD above the upper diamicton boundary in cores JR142-GC07 and JR142-GC08 (Hogan et al., Reference Hogan, Dowdeswell, Hillenbrand, Ehrmann, Noormets and Wacker2017; Fig. 3). The grain-size record from core S2519 provides new information about later iceberg calving in the area at YD. It is possible that the shallow sill between the Erik Eriksen and Kvitøya troughs hampered the northward iceberg drift during the YD, and therefore, the IRD peak is not found in the core S2528. Alternatively, the IRD peak might result from a local gravity flow. In the latter case, this flow could be responsible for the aforementioned erosion of laminated B/A sediments in core S2519.
The transition from unit II to unit I marked by changes of lithology, grain-size distribution, and an increase in microfossil abundance and diversity in both studied cores admits an earlier (ca. 12.5 cal ka BP) onset of the postglacial marine sedimentation in the Erik Eriksen Trough than in the Kvitøya Trough (ca. 11.7 cal ka BP). Alternatively, the age discrepancy might result from the age model uncertainty in core S2519.
Paleoenvironments
The early deglaciation
In the Kvitøya Trough, low dinocyst concentration and an almost exclusive dominance of heterotrophic taxa (Fig. 9) indicate cold conditions in the surface water, a dense sea-ice cover, and low bioproductivity. Several sources of evidence including a low-density BF population dominated by typical Arctic species (E. clavatum, E. groenlandica, and E. arctica) and relatively low TOC content in our cores (Figs. 5 and 8), as well as IP25 biomarker data (Müller and Stein, Reference Müller and Stein2014; Belt et al., Reference Belt, Cabedo-Sanz, Smik, Navarro-Rodriguez, Berben, Knies and Husum2015), point to a perennial or quasi-perennial sea-ice cover extending over a large area and low bottom-water salinity during the ED. In the Erik Eriksen Trough, no BFs or PFs are found in unit III of core S2519, which indicates very harsh surface and bottom environments.
The low benthic oxygen isotopes (~3.2–2.6‰; Fig. 7) imply considerably freshened bottom waters as a significant warming in the bottom layer during this very cold interval seems to be improbable. Low bottom-water salinity could result from abundant glacial meltwater discharges into the newly formed marine basins just after the retreat of the grounded ice sheet margin from the shelf deeps (cf. also Lubinski et al., Reference Lubinski, Polyak and Forman2001; Murdmaa et al., Reference Murdmaa, Ivanova, Duplessy, Levitan, Khusid, Bourtman, Alekhina, Alekseeva, Belousov and Serova2006). This is supported by the aforementioned benthic assemblages. Topography of the narrow Kvitøya Trough could have channelized the freshwater inputs from nearby melting glaciers. Besides, hyperpycnal plumes from the subglacier meltwater rich in suspended particles could contribute to the sinking of low-salinity water beneath the lighter pure seawater.
Rare specimens of indicative BFs (M. barleeanus, C. lobatulus, and C. subglobosa) and dinocyst taxa (O. centrocarpum and Spiniferites) possibly reflect the very early Atlantic Water influence on glaciomarine environments in the Kvitøya Trough at bottom- and surface-water layers, respectively, as follows from the species ecological preferences (Mackensen and Hald, Reference Mackensen and Hald1988; Rochon et al. Reference Rochon, de Vernal, Turon, Matthiessen and Head1999; Rasmussen et al., Reference Rasmussen, Thomsen, Ślubowska, Jessen, Solheim and Koç2007; Ivanova, Reference Ivanova2009; Chauhan et al., Reference Chauhan, Rasmussen and Noormets2016).
From ca. 16.9 cal ka BP, the high relative abundance of C. teretis (15–33%; Fig. 8) and PF occurrence in core S2528 suggest an increased influence of Atlantic Water in the Kvitøya Trough, under sea-ice cover and/or a strong pycnocline in summer. The dominant planktic species N. pachyderma (sin.) lives and calcifies in the subsurface Atlantic Water in the northern and central Barents Sea (Duplessy et al., Reference Duplessy, Ivanova, Murdmaa, Paterne and Labeyrie2001, Reference Duplessy, Cortijo, Ivanova, Khusid, Labeyrie, Levitan, Murdmaa and Paterne2005; Lubinski et al., Reference Lubinski, Polyak and Forman2001). Increased Atlantic Water flow to the Kvitøya Trough during the HS1 is in line with reconstructions from the Barents Sea margin (Ivanova et al., Reference Ivanova, Murdmaa, Emelyanov, Seitkalieva, Radionova, Alekhina and Sloistov2016), Franz Victoria and St. Anna troughs (Lubinski et al., Reference Lubinski, Polyak and Forman2001), the Svalbard northern slope (Ślubowska et al., Reference Ślubowska, Koç, Rasmussen and Klitgaard Klitgaard-Kristensen2005) and continental margin (Chauhan et al., Reference Chauhan, Rasmussen and Noormets2016), and Storfjorden in the western Barents Sea (Rasmussen et al., Reference Rasmussen, Thomsen, Ślubowska, Jessen, Solheim and Koç2007). A possible buildup of a heat reservoir in subsurface to intermediate water during the HS1 is suggested by several studies (e.g., Marcott et al., Reference Marcott, Clark, Padman, Klinkhammer, Springer, Liu and Otto-Bliesner2011; Rasmussen and Thomsen, Reference Rasmussen and Thomsen2013; Chauhan et al., Reference Chauhan, Rasmussen and Noormets2016) and by model experiments (Mignot et al., Reference Mignot, Ganopolski and Levermann2007). However, in the Erik Eriksen Trough and in site NP05-71 south of Kvitøya Island (Klitgaard-Kristensen et al., Reference Klitgaard-Kristensen, Rasmussen and Koç2013), the sediments of unit III are foraminiferal barren (Fig. 4), implying that Atlantic Water had not yet reached the area south of the sill between the two troughs.
Bølling-Allerød warming
A pronounced increase in the Atlantic Water flow and/or warming in the bottom layer is evidenced by high relative abundance of C. teretis (30–66%) in core S2528 at ca. 13.6 cal ka BP (i.e., during the Allerød interstade). PFs and BFs, notably C. teretis, also occur in the laminated B/A sediments of core S2519, thus implying that subsurface-to-bottom layer Atlantic water reached the Erik Eriksen Trough. Increased Atlantic Water flow is also indirectly supported by a strong decline in the percentage of opportunistic E. clavatum and an increased relative abundance of epibenthic species C. lobatulus (~16%; Fig. 8) in core S2528, reflecting vigorous bottom hydrodynamics, intense subsurface-to-bottom mixing, and/or warmer bottom currents (Hald et al., Reference Hald, Kolstad, Polyak, Forman, Herlihy, Ivanov and Nesheretov1999; Polyak et al., Reference Polyak, Korsun, Febo, Stanovoy, Khusid, Hald, Paulsen and Lubinski2002; Ivanova et al., Reference Ivanova, Ovsepyan, Risebrobakken and Vetrov2008; Rasmussen et al., Reference Rasmussen, Forwick and Mackensen2012; Chauhan et al., Reference Chauhan, Rasmussen and Noormets2016). Subsurface-to-bottom mixing is also indicated by the generally small planktic-benthic δ18O difference (Fig. 7).
In the Kvitøya Trough, the decreased content of heterotrophic dinocyst taxa Islandinium, relative to O. centrocarpum, N. labyrinthus, S. ramosus, and S. elongatus, suggests milder subarctic-type conditions in the surface water (e.g., de Vernal et al., Reference de Vernal, Henry, Matthiessen, Mudie, Rochon, Boessenkool and Eynaud2001, Reference de Vernal, Rochon, Fréchette, Henry, Radi and Solignac2013; Fig. 9). Our findings are consistent with a broad warming in the North Atlantic region (Rasmussen and Thomsen, Reference Rasmussen and Thomsen2008) and the resumption of deep water formation during the B/A (McManus et al., Reference McManus, Francois, Gherardi, Keigwin and Brown-Leger2004), which fostered increased subsurface Atlantic Water flow to the Arctic via the western and SW Barents Sea (Ślubowska et al., Reference Ślubowska, Koç, Rasmussen and Klitgaard Klitgaard-Kristensen2005; Aagaard-Sørensen et al., Reference Aagaard-Sørensen, Husum, Hald and Knies2010; Chistyakova et al., Reference Chistyakova, Ivanova, Risebrobakken, Ovsepyan and Ovsepyan2010; Chauhan et al., Reference Chauhan, Rasmussen and Noormets2016; Ivanova et al., Reference Ivanova, Murdmaa, Emelyanov, Seitkalieva, Radionova, Alekhina and Sloistov2016) and along the Eurasian continental margin (Fig. 11). Lubinski et al. (Reference Lubinski, Polyak and Forman2001) reported that a stronger Atlantic water influx was facilitated by glacial isostatic deepening of the northern Barents Sea.
Nevertheless, a surface layer was receiving the meltwater plumes, likely from the retreating Svalbard glaciers (e.g., Klitgaard-Kristensen et al., Reference Klitgaard-Kristensen, Rasmussen and Koç2013; Chauhan et al., Reference Chauhan, Rasmussen and Noormets2016). Low surface productivity may be inferred from low foraminiferal abundancies and TOC content in the cores studied. It is also supported by low dinocyst concentrations and faunal portions of seasonal productivity-related benthic species N. labradoricum and Islandiella spp. (I. norcrossi + I. helenae) in core S2528 (Figs. 8 and 9).
Younger Dryas cooling
In both cores, the low planktic δ18O values during the YD (Fig. 7) likely resulted from freshwater/meltwater discharges from the Laurentide Ice Sheet/Lake Agassiz through the Mackenzie pathway to the Arctic (Tarasov and Peltier, Reference Tarasov and Peltier2005; Murton et al., Reference Murton, Bateman, Dallimore, Teller and Yang2010; Hillaire-Marcel et al., Reference Hillaire-Marcel, Maccali, Not and Poirier2013; Keigwin et al., Reference Keigwin, Klotsko, Zhao, Reilly, Giosan and Driscoll2018). Although a more proximal source of meltwater from the Eurasian ice sheet cannot be discarded, it is unlikely because of the relatively small ice volumes of remaining ice from the Svalbard-Kara-Barents Ice Sheet after 14 cal ka BP (see, e.g., Klitgaard-Kristensen et al., Reference Klitgaard-Kristensen, Rasmussen and Koç2013), and because the Scandinavian Ice Sheet rather experienced stabilization of its margins during the YD (cf. Hughes et al., Reference Hughes, Gyllencreutz, Lohne, Mangerud and Svendsen2016). Transfer of isotopically light waters from the surface to the subsurface and bottom-water layers through the release of brines during sea-ice formation (Hillaire-Marcel and de Vernal, Reference Hillaire-Marcel and de Vernal2008) likely explains the depleted benthic δ18O values (Fig. 7). Cold conditions and regional sea-ice formation are consistent with the almost exclusive occurrence of heterotrophic dinocyst taxa indicating the dense sea ice. This interpretation is in line with cold conditions during the YD over the Nordic and Barents Seas (Eldevik et al., Reference Eldevik, Risebrobakken, Bjune, Andersson, Birks, Dokken and Drange2014 and references therein). The depleted NPS δ18O values in core S2528 can be correlated with the similar depletions seen in cores JPC5 from the Franz Victoria Trough (Fig. 11; Lubinski et al., Reference Lubinski, Polyak and Forman2001), PL94-67/C from the St. Anna Trough (Hald et al., Reference Hald, Kolstad, Polyak, Forman, Herlihy, Ivanov and Nesheretov1999), and PS2458 from the Laptev Sea (Spielhagen et al., Reference Spielhagen, Erlenkeuser and Siegert2005), which were interpreted as resulting from extensive iceberg discharge and/or meltwater pulse.
A high percentage of C. teretis, the occurrence of PFs, and diverse BF assemblages characterize both locations (Fig. 8), suggesting significant subsurface Atlantic Water inflow into the Kvitøya–Erik Eriksen troughs most likely from the Fram Strait and along the Eurasian margin. This finding is consistent with BF data from the Yermak Plateau (Wollenburg et al., Reference Wollenburg, Knies and Mackensen2004), Franz Victoria Trough (Lubinski et al., Reference Lubinski, Polyak and Forman2001), and Laptev Sea (Taldenkova et al., Reference Taldenkova, Bauch, Stepanova, Ovsepyan, Pogodina, Klyuvitkina and Nikolaev2012; Ovsepyan et al., Reference Ovsepyan, Taldenkova, Bauch and Kandiano2015; Fig. 11). Although reduced AMOC strength has been suggested during the YD cooling (Fig. 11; McManus et al., Reference McManus, Francois, Gherardi, Keigwin and Brown-Leger2004), subsurface northward flow of Atlantic Water probably occurred as during HS1 (Ivanova et al., Reference Ivanova, Murdmaa, Emelyanov, Seitkalieva, Radionova, Alekhina and Sloistov2016). At the YD/Preboreal transition, the reorganization of the ocean circulation was accompanied by increased heat advection through the Norwegian Current along the eastern Nordic Seas (Risebrobakken et al., Reference Risebrobakken, Dokken, Smedsrud, Andersson, Jansen, Moros and Ivanova2011) and to the Eurasian margin (Ivanova et al., Reference Ivanova, Murdmaa, Emelyanov, Seitkalieva, Radionova, Alekhina and Sloistov2016).
In core S2528, the planktic-benthic δ18O difference during the YD is larger than in core S2519, suggesting a very strong stratification between subsurface and bottom waters at the former site (Figs. 7 and 10). This may indicate stronger Atlantic Water influence in the bottom water than in the subsurface layer. Bioproductivity was still low at site S2528, as indicated by low dinocyst concentrations, TOC content, and foraminiferal abundance (Figs. 5 and 9). On the contrary, high PF and BF abundances in core S2519 (Fig. 5) suggest higher productivity possibly related to the development of polynyas because of strong winds from nearby readvanced glaciers. This assumption is compatible with the aforementioned IRD peak (Fig. 5). Higher bioproductivity because of a polynya effect at site S2519 is also supported by a lower planktic-benthic δ18O difference and higher NPS δ13C values as compared with core S2528 (Fig. 7).
The Holocene
The early Holocene was characterized by higher EEC and MB δ18O values in core S2528 as compared with the YD, possibly reflecting a gradual increase in salinity because of the sea level rise fostering advection of the more saline, 18O-enriched Atlantic Water. The water column was still well stratified with the relatively warm Atlantic Water flowing below cold and low-saline surface ArW until about 7.8 cal ka BP as suggested by the dinocyst data and by the peaks of Atlantic-affiliated BF species at about 10.5–9.6 cal ka BP in two cores (Figs. 8, 9, and 11).
The strengthening of Atlantic Water influence from 10.9 to 9.6 cal ka BP is broadly consistence with previous publications from the Barents Sea (Lubinski et al., Reference Lubinski, Polyak and Forman2001; Sarnthein et al., Reference Sarnthein, Van Kreveld, Erlenkauser, Grootes, Kucera, Pflaumann and Schulz2003; Aagaard-Sørensen et al., Reference Aagaard-Sørensen, Husum, Hald and Knies2010; Chistyakova et al., Reference Chistyakova, Ivanova, Risebrobakken, Ovsepyan and Ovsepyan2010; Risebrobakken et al., Reference Risebrobakken, Moros, Ivanova, Chistyakova and Rosenberg2010; Berben et al., Reference Berben, Husum, Cabedo-Sanz and Belt2014), Svalbard margin (Ślubowska et al., Reference Ślubowska, Koç, Rasmussen and Klitgaard Klitgaard-Kristensen2005; Rasmussen et al., Reference Rasmussen, Thomsen, Ślubowska, Jessen, Solheim and Koç2007, Reference Rasmussen, Forwick and Mackensen2012; Ślubowska-Woldengen et al., Reference Ślubowska-Woldengen, Rasmussen, Koç, Klitgaard-Klitgaard-Kristensen, Nilsen and Solheim2007) and continental shelf (Sternal et al., Reference Sternal, Szczuciński, Forwick, Zajaczkowski, Lorenc and Przytarska2014), Yermak Plateau (Wollenburg et al., Reference Wollenburg, Knies and Mackensen2004), and Norwegian Sea (Risebrobakken et al., Reference Risebrobakken, Dokken, Smedsrud, Andersson, Jansen, Moros and Ivanova2011; Eldevik et al., Reference Eldevik, Risebrobakken, Bjune, Andersson, Birks, Dokken and Drange2014). Thus, all the aforementioned data concur on a pivotal influence of the subsurface Atlantic Water at the time of maximum heat advection at about 10 cal ka BP (Risebrobakken et al., Reference Risebrobakken, Dokken, Smedsrud, Andersson, Jansen, Moros and Ivanova2011).
During the Holocene, BF assemblages show higher percentages of C. teretis in core S2519 than in core S2528 (Fig. 8), indicating lateral advection of subsurface Atlantic Water from the Franz Victoria Trough to the Erik Eriksen Trough, as today (Fig. 2a). On the other hand, southward flow from site S2528 to site S2519 is indicated by the general similarity of down-core patterns of the Atlantic taxa through the last ca. 10 ka (Fig. 8). We speculate that along with the reduced Atlantic Water flow during the Holocene (Lubinski et al., Reference Lubinski, Polyak and Forman2001), the rather low percentage of C. teretis in core S2528 (Fig. 11), and in the previously studied core ASV880 from the Franz Victoria Trough (Duplessy et al., Reference Duplessy, Ivanova, Murdmaa, Paterne and Labeyrie2001), might reflect more favorable conditions for the other Atlantic-affiliated species compared with the deglaciation interval. Rare specimens of warm-water PFs found in core S2528 (Supplementary Appendix 1) might be episodically transported by the Atlantic Water to the Barents Sea, which is in line with previous findings of scarce boreal-to-tropical PFs in postglacial sediments from the Arctic locations (e.g., Bauch, Reference Bauch, Kassens, Bauch, Dmitrenko, Ericken, Hubberten, Melles, Thiede and Timokhov1999; Ovsepyan et al., Reference Ovsepyan, Taldenkova, Bauch and Kandiano2015).
Nevertheless, severe polar conditions can be inferred from the high proportion of opportunistic E. clavatum (up to 40–70%) at 11.7–10.5 cal ka BP (Figs. 8 and 11). This assumption is consistent with concurrent cooling of the western and SW Barents Sea-surface water during winter seasons (Risebrobakken et al., Reference Risebrobakken, Moros, Ivanova, Chistyakova and Rosenberg2010; Berben et al., Reference Berben, Husum, Cabedo-Sanz and Belt2014). The quasi-exclusive dominance of Islandinium spp. in dinocyst assemblages (Fig. 9) suggests dense sea-ice cover at site S2528 for a large part of the year (e.g., de Vernal et al., Reference de Vernal, Rochon, Fréchette, Henry, Radi and Solignac2013) from 10.8 to ~7.8 cal ka BP.
Abundant dinocysts in the interval younger than 10.8 cal ka BP indicate high fluxes related to regional cyst production and relatively high surface productivity (Fig. 9). This conclusion is supported by a remarkable peak in benthic species N. labradoricum (up to 20–35%) recording seasonally high bioproductivity in the Kvitøya Trough during the early Holocene (Fig. 8). At present, N. labradoricum generally prefers the areas of ice marginal or frontal zones with high seasonal productivity (e.g., Hald and Korsun, Reference Hald and Korsun1997; Polyak et al., Reference Polyak, Korsun, Febo, Stanovoy, Khusid, Hald, Paulsen and Lubinski2002; Rasmussen et al., Reference Rasmussen, Forwick and Mackensen2012; Chauhan et al., Reference Chauhan, Rasmussen and Noormets2016). The concurrent abundance peak of N. labradoricum was found at other locations of the Barents Sea margins (Ślubowska et al., Reference Ślubowska, Koç, Rasmussen and Klitgaard Klitgaard-Kristensen2005; Ślubowska-Woldengen et al., Reference Ślubowska-Woldengen, Rasmussen, Koç, Klitgaard-Klitgaard-Kristensen, Nilsen and Solheim2007; Rasmussen et al., Reference Rasmussen, Thomsen, Ślubowska, Jessen, Solheim and Koç2007, Reference Rasmussen, Forwick and Mackensen2012) and Franz Victoria Trough (Polyak and Solheim, Reference Polyak and Solheim1994). The high productivity suggested from both foraminiferal and dinocyst data in a context of cold surface waters can be related to the development of polynyas, as in modern conditions (e.g., Hamel et al., Reference Hamel, de Vernal, Gosselin and Hillaire-Marcel2002; Cormier et al., Reference Cormier, Rochon, de Vernal and Gélinas2016). In the Erik Eriksen Trough, C. reniforme and Islandiella spp. dominate over E. clavatum through the early Holocene, thus suggesting milder bottom-water conditions than in the Kvitøya Trough.
A dramatic change in dinocyst assemblages marked by the replacement of Islandinium minutum by phototrophic taxa occurred in the Kvitøya Trough at 7.8 cal ka BP. This change suggests a significant decline in sea-ice cover together with milder conditions in the surface-water layer because of the onset of Atlantic influence (e.g., Rochon et al., Reference Rochon, de Vernal, Turon, Matthiessen and Head1999). Although this event is delayed relative to the summer insolation maximum and to the surface warming documented by other proxies since ~9 cal ka BP in the Fram Strait and Nordic Seas (Risebrobakken et al., Reference Risebrobakken, Dokken, Smedsrud, Andersson, Jansen, Moros and Ivanova2011; Werner et al., Reference Werner, Spielhagen, Bauch, Christian Hass and Kandiano2013; Eldevik et al., Reference Eldevik, Risebrobakken, Bjune, Andersson, Birks, Dokken and Drange2014), it is indirectly supported by geochemical data and heat flux estimates off SW Svalbard (Sternal et al., Reference Sternal, Szczuciński, Forwick, Zajaczkowski, Lorenc and Przytarska2014). Optimal conditions in surface waters with enhanced Atlantic influence were ascertained in the Kvitøya Trough at ~5.5 cal ka (Figs. 9 and 10).
Through the middle–late Holocene, rather stable planktic and benthic oxygen isotope records suggest uniform subsurface and bottom-water masses, as at other Barents Sea locations (e.g., Aagaard-Sørensen et al., Reference Aagaard-Sørensen, Husum, Hald and Knies2010). BF assemblages are also rather uniform during the middle–late Holocene in core S2528. On the contrary, an increase in E. clavatum and Buccella spp. percentages in core S2519 (Fig. 8) reflects a climatic deterioration with denser sea-ice cover (Polyak et al., Reference Polyak, Korsun, Febo, Stanovoy, Khusid, Hald, Paulsen and Lubinski2002) in the Erik Eriksen Trough after 4.3 cal ka BP. In turn, the recurrence of I. minutum in core S2528 at ca. 2 cal ka BP indicates a trend toward colder conditions and enhanced winter sea ice in the Kvitøya Trough (Fig. 9). The surface cooling over the last ~4.3 ka in the Erik Eriksen Trough and the last 2 ka in the Kvitøya Trough is broadly consistent with the surface-water cooling and enhanced seasonal sea-ice cover as recorded regionally over the last 3–4 ka (Müller et al., Reference Müller, Werner, Stein, Fahl, Moros and Jansen2012; de Vernal et al. Reference de Vernal, Rochon, Fréchette, Henry, Radi and Solignac2013; Werner et al., Reference Werner, Spielhagen, Bauch, Christian Hass and Kandiano2013; Eldevik et al., Reference Eldevik, Risebrobakken, Bjune, Andersson, Birks, Dokken and Drange2014).
CONCLUSIONS
The presented data provide new information on the deglaciation and postglacial conditions in the NW Barents Sea, documenting a diachronous deglaciation with iceberg rafting cessation likely at ~17 cal ka BP in the Kvitøya Trough and at ~12.5 cal ka BP in the Erik Eriksen Trough. The petrography of IRD suggests proximal provenance from the NE Svalbard area, with a general northward drift of icebergs along the Kvitøya Trough during the ED. Atlantic Water penetrated the study area since the ED flowing through the Fram Strait, along the northern Eurasian margin, the NW Barents Sea, and farther into the Laptev Sea, peaking during B/A and YD/Preboreal times. Thus, our data support the buildup of a subsurface heat reservoir in the Atlantic during the HS1 and YD.
A dense seasonal sea-ice cover persisted until about 7.8 cal ka BP, pointing to a decoupling between surface and subsurface conditions throughout the deglaciation. The benthic δ18O data indicate a two-step transition from glaciomarine to postglacial environments. The light planktic δ18O excursion at the YD reflects freshwater/meltwater discharge likely from the Arctic Ocean. The concurrent foraminiferal data indicate occurrence of a high-productivity polynya in the Erik Eriksen Trough area.
Later on during the Holocene, subsurface Atlantic Water persistently penetrated into the NW Barents Sea through the Fram Strait and along the Eurasian continental margin, as well as along the Franz Victoria Trough to Erik Eriksen Trough route as shown by the foraminiferal data from both cores S2519 and S2528. After 7.8 cal ka BP, a warming possibly associated with enhanced Atlantic influence is documented by dinocyst assemblages from core S2528. It was followed by surface cooling in the study area over the last 2–4 ka.
SUPPLEMENTARY MATERIAL
The supplementary material for this article can be found at https://doi.org/10.1017/qua.2019.18.
ACKNOWLEDGMENTS
We are thankful to V. Lavrushin and E. Radionova for providing core material to this study; E. Krylova for mollusk identification prior to dating; and U. Ninnemann, C. Hillaire-Marcel, L. Polyak, R. Spielhagen, and M.-A. Sicre for fruitful discussions. E. Ovsepyan and L.R. Bradley are acknowledged for their assistance with Cassidula species identification and performance of the Bayesian modeling, respectively. Y. Ovsepyan, N. Chistyakova, A. Ivanov, E. Platonova, O. Ivanova, and O. Volkova worked hard to pick foraminifers for stable isotope and AMS-14C measurements from mostly terrigenous sediments; V. Kravtsov carried out CaCO3/TOC measurements; E. Kandiano helped with submission of samples to the Leibnitz Laboratory; M. Kornilova assisted with drawing the figures. We are grateful to M. Henry and J.-F. Hélie (Geotop) for their help with palynological preparation and isotopic analyses of foraminifers. Special thanks are also extended to J. Studholme for the significant English editing and helpful comments. Four anonymous reviewers, associate editor L. Bradtmiller, and senior editor D. Booth are acknowledged for their critical suggestions that helped to improve the manuscript. This work was partially supported by the Russian Federation state assignment no. 0149-2019-0007 (EI and IM), Russian Science Foundation grant no. 14-50-00095 (funding of the AMS-14C dating at Poznan Laboratory), and by the Natural Sciences and Engineering Research Council of Canada and the Fonds de recherché du Québec–Nature et Technologies. Some foraminiferal specimens from diamicton were additionally studied under the Olympus camera at Otto Schmidt Laboratory of marine and polar investigations of the Arctic and Antarctic Research Institute, St. Petersburg (grants OSL 14-09 and OSL 15-08).