Estuaries are important habitats for fish, shellfish, birds and mammals. They are also a focus of human activity, encompassing urban and industrial development and recreation. Estuaries are both sources and sinks for sediments, although more commonly the latter in the UK, because the large volumes of water introduced by the tides tend to outweigh the relatively modest riverine inputs (Dyer Reference Dyer1997). Their sediment infill, and accompanying contaminants, may include both fluvial and marine components.
Any contaminants in the sediments have the potential to harm the biota and, thus, to adversely affect both ecosystems and biodiversity. There have been relatively few detailed studies of estuarine contamination in the UK. This was recognised by an editorial in the Marine Pollution Bulletin, which stated that ‘Truly appropriate, useful, research would involve the mapping of sediments and … development of contaminant inventories' (Pearce Reference Pearce1997). The British Geological Survey (BGS) set out to achieve this goal by initiating work in the Mersey Estuary in 2000 (Vane et al., Reference Vane, Harrison and Kim2007a, Reference Vane, Jones and Lister2009; Ridgway et al. Reference Ridgway, Bee, Breward, Cave, Chenery, Gowing, Harrison, Hodgkinson, Humphreys, Ingham, Jarrow, Jenkins, Kim, Lister, Milodowski, Pearson, Rowlands, Spiro, Strutt, Turner and Vane2012). This was followed by studies in the Clyde Estuary (Vane et al., Reference Vane, Ma, Chen and Mai2010, Reference Vane, Chenery, Harrison, Kim, Moss-Hayes and Jones2011).
The work goes some way towards addressing legislative requirements, such as the Oslo and Paris Conventions (OSPAR) aim for hazardous substances of ‘achieving concentrations in the marine environment near background values for naturally occurring substances and close to zero for manmade synthetic substances' (OSPAR 2009) and the aim of the European Union (EU) Water Framework Directive (European Community 2000) for surface waters of good status. Contaminated sediments should be considered as part of river basin management plans under the Directive in order to achieve good ecological status and maintain ecosystem function. Contaminated sediment may also be relevant when meeting the requirements of the European Habitats Directive and the Marine Strategy Framework Directive.
Climate change may affect the future disposition of contaminants in estuarine sediments, including the balance between them acting as a source or a sink; for example, through sea-level rise or the increased frequency of extreme weather events, including storms and flooding.
The Clyde Estuary forms the innermost part of a complex fjord coastline. Its modern topography has been shaped by repeated excavation under ice and then incomplete sedimentary infill during at least four major cycles of NW European regional glaciation and deglaciation, which began 480,000 years ago. The Clyde Estuary is shallow compared to adjacent fjord-like basins, because it has been partly filled by sedimentary input from relatively large fluvial catchments feeding into the Clyde Valley. Bedrock under the Firth of Clyde, and on adjacent land areas, is almost everywhere buried by late Quaternary gravels, muds and sands dating from about 24,000 years ago to the present day. These sediments were deposited in glacial to interglacial climates and in terrestrial, marine and estuarine environments in response to rapid, cyclical periods of extreme climate change (Deegan et al. Reference Deegan, Kirby, Rae and Floyd1973; Jardine Reference Jardine1986).
Glasgow is a city that has been greatly affected by its industrial past. Situated along the lower River Clyde and inner Clyde estuary in the W of Scotland, it was once one of Europe's leading industrial centres, along with its outlying neighbouring towns further down the estuary, such as Dumbarton, Port Glasgow and Greenock. Coal mining, shipbuilding, engineering and chemical industries have left their mark on the environment and the surrounding River Clyde.
Studies of the geochemistry of sediments from the Clyde Estuary were carried out in three phases from 2002 onwards. The first of these was co-funded by Glasgow City Council with support (ship time and logistics) from the Scottish Environment Protection Agency (SEPA) and the Glasgow Humane Society. This concentrated on the inner part of the estuary, from the tidal limit in Glasgow, downstream to Milton (Fig. 1). The second phase in 2004 extended the study further down the estuary to Greenock. This was then continued westwards from Greenock to the Holy Loch in the third phase in 2007. The surveys (Fig. 1) included geophysics (shallow seismic reflection, multibeam echo sounder and some sidescan sonar) and sampling of the surface sediments and collection of sediment cores. They were followed by in-depth laboratory analysis of the sedimentology, sediment geochemistry and mineralogy.
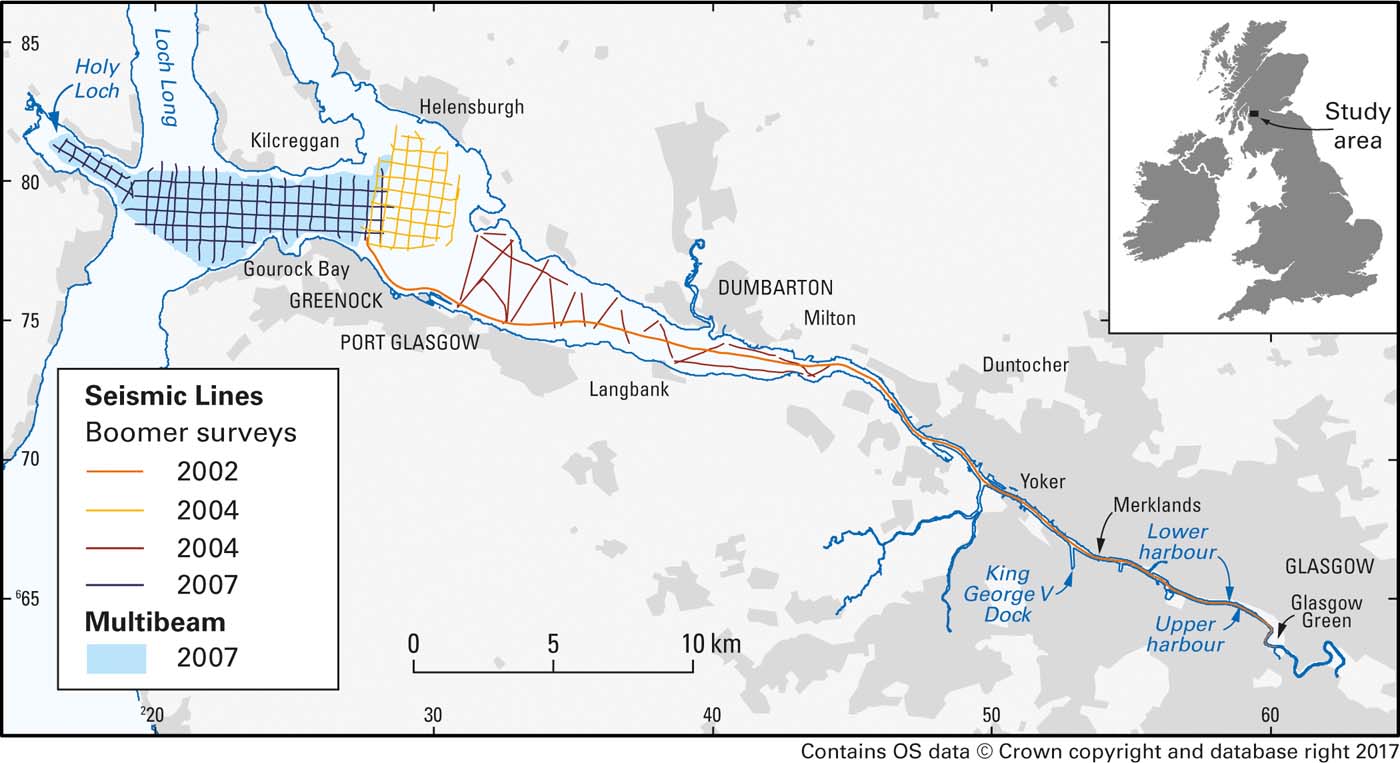
Figure 1 Track plots of boomer surveys and multibeam coverage in the Clyde Estuary, with inset showing location of the study area in the UK.
The aim of this paper is to summarise the estuarine sediment contamination, and related studies on sediment deposition and its evolution, carried out by BGS in the Clyde Estuary. Much of the work has only been presented previously in reports with variable availability, with only aspects of the organic geochemistry and Pb-isotope studies published in international journals. The objective of this comprehensive overview is to provide some illustrative examples from the work and signpost the more detailed reports and publications that are available.
1. Methods
1.1. Sediment sampling
Surface sediment and shallow sediment core samples were collected across the studied area. This sampling was supplemented by geophysical techniques to provide context on the spatial distribution of seabed features and sediment types and their disposition with depth, thus shedding light on the sedimentary history of the area.
Techniques varied according to the nature and accessibility of the areas studied. Sampling of the inner estuary commenced in October 2002 and was completed in February 2003. Samples were collected on three separate cruises, on which four different sampling methods were adopted according to the site conditions and the sampling platform:
(1) Day grab – deployed from SEPA research vessel ‘Endrick II'.
(2) Gravity corer – deployed from ‘Endrick II'.
(3) Mackereth piston corer – deployed from ‘Endrick II' and BGS vessel ‘Big Buster'.
(4) Van Veen grab – deployed from ‘Endrick II', ‘Big Buster' and the Glasgow Humane Society vessel.
The grab samples provided surficial sediment to a depth of 10–20cm; the smaller Van Veen grab sampled to 10cm; whilst the larger Day grab obtained material to a depth of approximately 20cm. The core samples enabled deeper material to be sampled at up to depths of 76cm for the gravity cores and 88cm for the Mackereth piston corer. Sampling covered the area from the tidal limit to Milton.
Three sediment samples were collected from the inner estuary between Carmyle and Bogleshole, where access on foot, from the riverbank, was possible.
Intertidal areas between Milton and Greenock were sampled on foot from a small hovercraft at low water in June 2004. Surface samples (top 5cm) were taken by hand trowel and shallow cores (maximum depth 1.39m) obtained by hammering polycarbonate tubing fitted with a core catcher into the sediment. The cores were capped and then extracted. In an attempt to obtain a more continuous record of sedimentation/contamination, areas of salt marsh that were consistently present on a series of Ordnance Survey historical maps dating from 1863/1864, 1899, 1922 and the present day, viewed on a project Geographical Information System (GIS), were sampled by hand coring in 2006.
Gravity cores (maximum depth 1.43m) and Shipek grabs (top 10cm) were collected from ‘Endrick II' in the subtidal area NW of Greenock in March 2004.
The study was extended W of Greenock and into the Holy Loch in 2007, where sampling was by gravity corer (maximum depth 2.87m) and Craib corer (to recover undisturbed surface sediments to a depth of about 10cm) from the survey vessel ‘Aora'.
1.2. Sample handling
Intertidal sites were photographed during sample collection. Splits of samples for organic analysis, or duplicate cores, were frozen as soon as possible after sampling. Non-destructive testing of cores was undertaken first, including gamma logging, X-ray photography and portable X-ray fluorescence (XRF) analysis on selected cores. A subset of cores and all surface samples was then spilt, photographed and logged before subsampling for further analysis.
Samples for geochemical analysis were sieved to <2mm and freeze-dried. Samples from the inner estuary were also subsampled at <150μm to provide a direct comparison (and normalisation) with Clyde tributary sediment sampling and analysis (Fordyce et al. Reference Fordyce, O' Dochartaigh, Lister, Cooper, Kim, Harrison, Vane and Brown2004).
1.3. Sample analysis
Analysis during the first phase of work in the inner estuary was dictated by the requirements of Glasgow City Council, and included inorganic and organic geochemistry, particle size and some engineering properties, as well as some mineralogical estimation, e.g., for asbestos content. Grain-size analysis was carried out on these samples, and all those subsequently collected, by sieving and X-ray Sedigraph. Details of analytical methods and quality assurance/control are given in Jones et al. (Reference Jones, Lister, Strutt, Entwisle, Harrison, Kim, Ridgway and Vane2004) and the other references cited in this section.
Major and trace element determinations for sediment samples were carried out by a combination of wavelength-dispersive and energy-dispersive XRF spectrometry of pressed powder pellets (Ingham & Vrebos Reference Ingham and Vrebos1994). Mercury was analysed by Atomic Fluorescence Spectrometry following dissolution using aqua regia.
Polychlorinated biphenyls (PCBs; seven congeners), organotins and polybrominated diphenyl ethers (PBDEs; used as flame retardants) were analysed on a small selection of samples by gas chromatography–mass spectrometry, and 15 polycyclic aromatic hydrocarbons (PAHs) by high-performance liquid chromatography, following solvent extraction (Vane et al. Reference Vane, Harrison and Kim2007b, Reference Vane, Ma, Chen and Mai2010, Reference Vane, Chenery, Harrison, Kim, Moss-Hayes and Jones2011).
Radionuclides were analysed on selected samples by gamma-ray spectrometry using an automated gamma core logger (NaI detector) for intact cores and Ge detectors for splits of dried sediment. Both detectors were housed in 10cm Pb shields to reduce background radioactivity. Data were analysed using Canberra Genie 2000 software. In addition to natural series radionuclides, 137Cs was usually the only anthropogenic radionuclide detected.
Pb isotopes were measured in a subset of cores by inductively coupled plasma mass spectrometry (Vane et al. Reference Vane, Chenery, Harrison, Kim, Moss-Hayes and Jones2011).
Sequential extraction was used to determine the solid-phase fractionation of the elements listed below using the Chemometric Identification of Substrates and Element Distributions (CISED) method (Cave et al. Reference Cave, Milodowski and Friel2004). This entails passing separate aliquots of aqua regia of increasing concentration through the sample under centrifugation and analysing the extracts by inductively coupled plasma–atomic emission spectrometry.
The sequential extraction leachates (14 extracts per sample) from all 15 samples were analysed for the following elements: Al, As, B, Ba, Ca, Cd, Co, Cr, Cu, Fe, K, Li, Mg, Mn, Mo, Na, Ni, P, Pb, S, Se, Si, Sr, V and Zn. These data were assembled into a data matrix and processed to produce a single model consisting of a mixture of components common to all the sediment samples.
Mineralogy and petrology were examined on selected samples. The bulk and clay mineralogy was investigated by X-ray diffraction (XRD). Scanning electron microscopy (SEM) was carried out on rough surfaces and resin-impregnated blocks. Phase/mineral identification was aided by qualitative observation of energy-dispersive X-ray spectra recorded simultaneously during SEM observation, using an Oxford Instruments INCA energy-dispersive X-ray microanalysis system.
Sediments samples for micropalaeontology (palynology and diatom study) were prepared using sodium hexametaphosphate (Riding & Kyffin-Hughes Reference Riding and Kyffin-Hughes2004) prior to microscopic examination.
1.4. Geophysics
Shallow seismic reflection data were acquired with surface-towed boomer systems (Fig. 1). A single boomer line was run down the channel from slightly below the tidal limit at Glasgow Green to Greenock.
In the area NW of Greenock, a Waverley 3000 sidescan sonar and a BGS surface-tow boomer were deployed over a grid of lines from the ‘Endrick II' (Fig. 1).
During the hovercraft survey of the intertidal area between Milton and Greenock (Fig. 1), a CBoom low-voltage boomer was linked to the BGS Coda Da200 data acquisition system and Trac C+Trimble DGPS navigation. Geophysics was carried out around high water±about 2 h.
In the ‘Aora' survey of 2007, W of Greenock (Fig. 1), a grid of BGS surface-towed boomer lines was acquired and a separate commercial multibeam survey was conducted using a Simrad EM3002D instrument over the whole of this area. The multibeam dataset, besides bathymetric information, also includes backscatter data (i.e., the intensity of the recorded reflection), which provides an indication of the nature and roughness of the seabed.
1.5. Data presentation
Interpretation of the geophysics used both QPS Fledermaus and ESRI ArcGIS software. The latter was used to create initial plots of many of the maps, although some were subsequently enhanced using Adobe Illustrator and CorelDRAW. Graphs were produced in Microsoft Excel or R. Simple r 2 correlations were derived from the Excel graphs, whilst more detailed statistical analysis (e.g., for the sequential extraction work) was carried out using R.
2. Results
2.1. Shallow seismic (boomer)
The shallow seismic (boomer) data were interpreted in the light of previous studies on the glacial and post-glacial history of the area (Peacock et al. Reference Peacock, Graham and Wilkinson1978; Jardine Reference Jardine1980, Reference Jardine1986; Browne & McMillan Reference Browne and McMillan1989; Fyfe et al. Reference Fyfe, Long and Evans1993). However, this is constrained by abundant acoustic blanking (Fig. 2) believed to be caused by gas within muddy sediments. The worst affected areas were the finest sediments. The succession can be subdivided by a series of unconformities, the lowest of which is the bedrock.
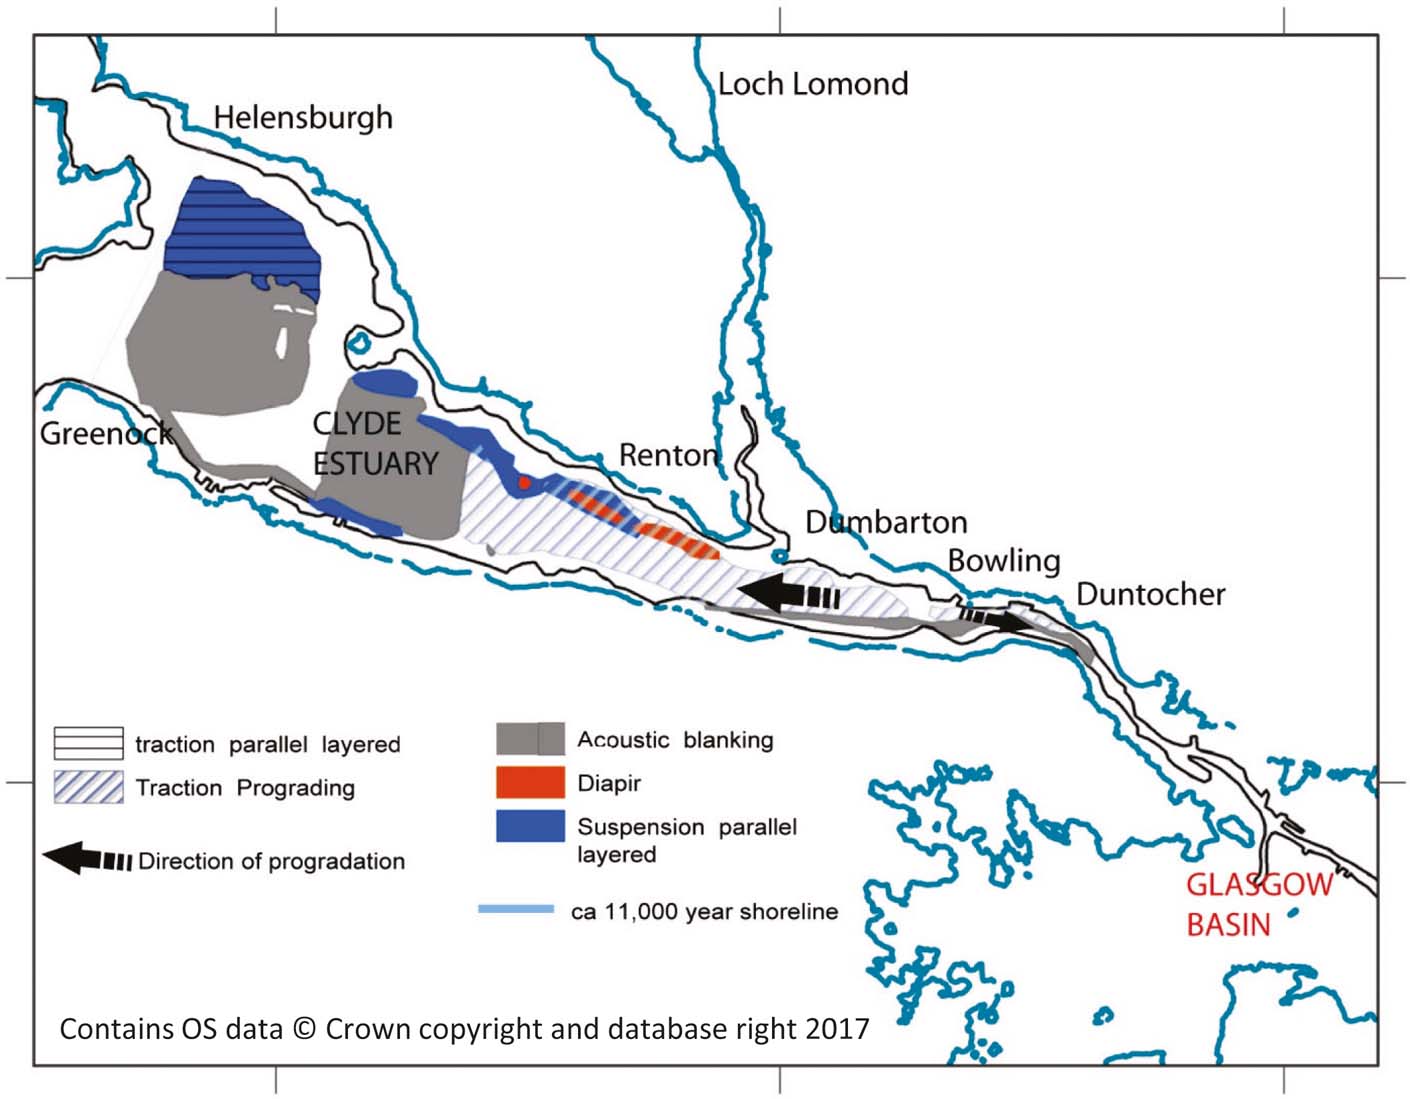
Figure 2 Distribution of buried late- and post-glacial sediment types interpreted from seismic facies in the inner Clyde Estuary.
Above the bedrock, a continuous mound-like reflector is interpreted as buried drumlins, analogous to those in the adjoining onshore areas, formed in a sub-glacial setting. These drumlins are not seen W of Greenock where the successions are thinner and of probable marginal glacial origin. The drumlins are overlain by acoustically transparent sediments, which, in turn, are draped by parallel-layered deposits. The latter were probably deposited below floating sea or glacial ice, which blocked the estuary and hindered tidal flows.
Channels cut into the layered sediments, probably filled with muds, prograde westwards. These likely formed as part of a tidal delta, built to the W of narrows at Duntocher, separating a large marine basin that existed to the SE, between about 15,000 and 11,500 years before present, and the open sea to the W (Fig. 2).
Erosion and infill of probable estuarine channels followed the delta progradation, most likely during the late Pleistocene or early Holocene.
This glacial and post-glacial history is harder to identify W of Greenock, where sediments are much thinner and more difficult to subdivide.
Following rapid sedimentation during deglaciation, the amount of sediment supplied to the Clyde Estuary would have been dramatically reduced with the onset of an interglacial climate and the establishment of permanent boreal vegetation approximately 10,000 years ago. Man had no significant influence on the natural environment until the Iron Age, which started in the Clyde Valley approximately 2500 years ago (Alexander Reference Alexander2015). At this time, the major areas of lowland forests were cleared to make way for agriculture and, possibly to a lesser extent, to service metalworking. This may have resulted in higher sediment input to offshore areas. Nevertheless, there was less modern man-made and natural alluvial input to the offshore sediment, compared to the colder periods of the Loch Lomond Stadial (Younger Dryas) and the Windermere Interstadial (BøllingAllerød). Over-deepened enclosed basins in the outer Firth of Clyde have trapped bedload sediment that would otherwise have been transported by tide and waves from the open shelf in the northern Irish Sea into the Clyde Estuary. Modern artificial embankments and dredging from Greenock, E to the Port of Glasgow, have confined much of the modern freshwater and tidal flow to the navigation channel adjacent to the more industrial S bank. Further E, the main channel has been artificially constrained by embankments and dredging to the centre and N of the estuary.
An important sedimentary process in the intertidal environment arises when waves generated by the prevailing winds interact with flooded seabed. In the study area, high stress on the seabed occurs when the wind blows over long fetches from the S and W, and when winds are funnelled to the E up the Clyde Valley by the configuration of the adjacent land. This erodes the seabed and winnows the seabed sediments. A prominent continuous beach complex has been raised 8–10m above Ordnance Datum on the northern flanks of the Clyde Estuary. There is not a raised beach on the southern shore. These observations suggest that wind-generated waves originating from the S and W have had a long-term influence on the rate and sources of sediment input from the N shore of the Clyde Estuary to the offshore.
The net effects of regional natural environmental setting, long-term local uplift and artificial management now mean that the Clyde Estuary E of Greenock is an area of overall sediment bypass. There are probably less extensive areas of shallow estuarine water, mud and sand flats and banks than would have been the case if the estuary had not been managed.
In the outer Clyde Estuary, the rugged topography might indicate a more active environment, in which sediments at seabed are prone to movement during current maxima. It is unlikely, however, that there is significant net deposition of sediment at the present day, other than in the Loch Long Channel and other basins.
2.2. Surface sediments and shallow cores
Seabed sediment maps have been compiled from the grain-size analysis of the surface sediments or surface layers of core sample (Leslie et al. Reference Leslie, Gafeira, Jenkins and Freeborough2011) and are shown in Figure 3.
The middle part of the estuary downstream of Milton is predominantly sand, locally gravelly near the shore and becoming muddy towards Milton. In the vicinity of Greenock and westwards, sandy mud is the main sediment type passing into mud in the deepest parts of Loch Long. There is, however, a gravel component NW of Greenock, and on the eastern edge of Loch Long, and there are neighbouring patches of muddy sand.

Figure 3 Distribution of seabed sediments in the Clyde Estuary, based on geophysical interpretation and sediment grain-size analysis. (a) Eastern section from Glasgow to Greenock. (b) Western section from Glasgow to the Holy Loch. Unlabelled cores are in the same location as those shown in parentheses: 720(722), 733(731), 739(738), 745(744), 749(747), 755(754), 778(777) and 787(789).
Shallow cores (≤1.2m maximum depth) E of Greenock were highly variable. The predominant sediment type was a yellowish-brown, fine-to-medium-grained sand. Clay, silt and gravel were also common.
Several of the cores recovered along the southern shore of the estuary, between Langbank and Port Glasgow (numbers 695, 696, 697, 701 and 717; Fig. 3), contained abundant shells and shell fragments (including Turritella communis and Mytilus edulis (common mussel)). Of particular interest were cores collected towards the margins (numbers 680, 682, 684, 688, 697, 700 and 707; Fig. 3) of the estuary, which contained a laminated, pinkish-grey silty clay at their base. This is thought to be a basal clay of glacial origin, which was deposited as ice retreated from the Clyde approximately 14,000 years ago. This silty clay is referred to as Unit 1 of the Clyde beds by Jardine (Reference Jardine1986). The clay was flocculated from plumes of glacial meltwater carried across more dense salt water (Peacock et al. Reference Peacock, Graham and Wilkinson1978). Each lamina appears to represent the suspension fraction of subaqueous sediment plumes discharged from the glacier margin (Peacock Reference Peacock and Gemmell1975). The poor sorting has been caused by flocculation in a saline environment. The colour banding is a result of the differences in proportions of glacially derived Dalradian material from the Highlands, and locally derived Old Red Sandstone material from the adjacent river catchments (Jardine Reference Jardine1980). This unit has subsequently been incised and eroded by the River Clyde (removing any evidence of Jardine (Reference Jardine1986) Unit 2), and then flooded and buried with modern fluvial and marine-derived sediments under sea-level rise.
Coal and jet-black fragments were observed in nine of the cores (numbers 680, 691, 693, 694, 698, 703, 706, 707 and 712; Fig. 3), at a maximum depth of 1.1m with very thinly bedded (1–3cm) gravel-sized coal fragments in core 706, down to a depth of 0.95m. One possible source for the coal is spillage from the many coal barges that once transported the fuel along the Clyde. Core 717 was found to contain abundant oblate to spherical, sub-angular to well-rounded pebbles up to 3cm in diameter. The presence of these pebbles may be due to the core's proximity to the active river channel, which runs down the centre of the inner estuary and provides a higher transport threshold for the movement of coarser-grained material.
The cores from the E of Greenock confirm the patchy and shallow nature of recent sediment in the Clyde Estuary, with presumed glacial sediments very close to surface.
To the W of Greenock the cores were much more uniform. They consisted of very soft, black, silty, sandy, organic-rich mud, with common bleached shells and shell fragments, and rare plant fragments, indicative of sediments deposited in a relatively low-energy environment. Cores 745, 749 and 755 (Fig. 3) were more varied, with interlaminated and interbedded soft-to-firm black muds, dark yellowish-brown, fine-to-medium-grained sands and gravels. Core 755 also commonly contained angular and sub-angular coal clasts. All three cores lacked the shells or shell fragments typical of the sediments in this area. The cores were collected in an area of higher ground, marked as spoil ground on the Admiralty Chart 1994 (‘Approaches to the River Clyde') and this would explain their heterogeneity. Core 739 was also collected in an area marked as spoil ground and displays similar heterogeneity with chaotic interbedded muds and sands. Core 778, which was collected on the western edge of a N–S trending moraine, also displays a chaotic heterogeneous sediment profile, suggesting that it was collected in an area of dredge spoil, even though it doesn't correspond with a marked disposal area on the Admiralty Chart.
2.3. Multibeam
The high-resolution multibeam survey (Fig. 4) was particularly revealing and allowed the identification of a number of surface features within the Outer Clyde Estuary.
Glacial features such as moraines, depressions and scoured surfaces (bedrock outcroppings) are widespread. There is a landslip from the N shore of the Holy Loch and many pockmark-like natural features, probably reflecting the escape of gas that also caused acoustic blanking on the boomer records. The trough S of Kilcreggan (see Fig. 1 for location) aligns with the Highland Boundary Fault. Man-made features include the area of dredge spoil dumping on the eastern side of Loch Long and some enigmatic triangular sets of three depressions near the E end of the area surveyed, which might be the footprints of jack-up rigs (Leslie et al. Reference Leslie, Gafeira, Jenkins and Freeborough2011).

Figure 4 (a) Coloured and shaded relief (NW illumination) digital elevation model derived from multibeam echosounder data. (b) Interpretative map of bathymetry and surface features from multibeam and boomer data.
2.4. Dating and depositional environment of sediments
A variety of approaches were used to try to date the sediments and shed light on their depositional environment.
Dating using 210Pb was attempted at the Scottish Universities Environmental Research Centre (SUERC), but there was found to be too little unsupported 210Pb (i.e., that arising from atmospheric deposition, which allows the sediments to be dated). Radiocarbon dating was also carried out on a few samples, although suitable material for dating was very sparse. Plant root material was obtained from two salt marsh cores (04-06-11 and 04-06-02; Fig. 3a) within grey clay at depths of 0.86 and 1.10m, respectively. The cores were chosen from areas where historical maps indicated the presence of salt marsh on all editions from 1864 to the present day. The deeper material gave a date of 235±30 BP, whilst the shallower material was dated at 5960±30 BP. Given that the clay is of likely glacial origin (section 2.2), this suggests that significantly younger plants colonised the sediment over a wide period from the mid-Holocene onwards. A sample of wood and a bivalve shell from a depth of 1.33m in core 787 (Fig. 3) gave ages of 205±25 BP and 530±30 BP, respectively. The presence of 137Cs, in the core below this depth, which was only introduced to the environment in significant amounts after about 1950 as a result of nuclear fission of 235U (e.g., Kershaw et al. Reference Kershaw, Woodhead, Malcolm, Allington and Lovett1990) suggests that somewhat older material has been incorporated into more recent sediment, assuming there has been no significant downward migration of 137Cs in the core. Profiles of 137Cs with depth for sediment cores from Maryport harbour in NW England showed a strong similarity with the decay-corrected discharge history of that radionuclide from Sellafield, suggesting no major redistribution down-core (Kershaw et al. Reference Kershaw, Woodhead, Malcolm, Allington and Lovett1990). Subsequent studies from SW Scotland (MacKenzie et al. Reference MacKenzie, Scott, Allan, Benshaban, Cook and Pulford1994) and the Ribble Estuary in NW England (Brown et al. Reference Brown, McDonald, Parker and Rae1999), at greater distance from Sellafield, conclude that the sediments contain a time-integrated record of the discharges, albeit with some lag time (Assinder et al. Reference Assinder, Yamamoto, Kim, Seki, Takaku, Yamauchi, Igarashi, Komura and Ueno1993). Thus, cores from the Clyde Estuary may also preserve the historical input of 137Cs.
However, there is also evidence for some dissolution and redistribution of 137Cs both within cores (MacKenzie et al. Reference MacKenzie, Cook, McDonald and Jones1998) and from the near-surface sediments on a wider scale; the more contaminated sediments near Sellafield acting as the main input to estuaries further afield, now that the discharges from the plant are very low (Cook et al. Reference Cook, MacKenzie, McDonald and Jones1997; Jones et al. Reference Jones, Kershaw, McMahon, Milodowski, Murray and Hunt2007).
Palynology and studies of diatoms were also carried out to try to date the sediments and provide information on their environment of deposition. Seven samples from cores 682 and 719 (Fig. 3) were found to contain a mixture of allochthonous Carboniferous (mainly Westphalian) pollen and spores and a modern pollen/spore association typical of the local upland flora.
The three samples from core 719 were relatively uniform, and clearly derive from a single genetic unit. There is some evidence of marine influence via rare specimens of radiolarian. However, the environment is clearly estuarine as opposed to open marine, based on the palynoflora and the silicofossils present, the diatoms constitute a diverse assemblage of freshwater forms with a smaller number of salinity-tolerate forms. The dominant diatoms were alkaliphilous (occurring in waters with a pH of 7 and over) and beta-mesosaprobic (indicating a resistance to moderately polluted water).
Four samples were studied from core 682 (Fig. 3). These proved to be considerably more variable, with a more marked marine influence. Thus, this core may not represent a single genetic sedimentary unit. Samples from 0.10–0.15, 0.30–0.35 and 0.80–0.85cm depth proved relatively sparse palynologically. This is most probably a reflection of the winnowing of organic materials from the shallower samples, because they are rippled, very fine sand with occasional Arenicola casts. By contrast, the sample from a depth of 0.56–0.60m was extremely rich in allochthonous Carboniferous (chiefly Westphalian) spores. Dinoflagellate cysts (0.56–0.60 and 0.80–0.85m depth) and unequivocally marine silicofossils (0.10–0.15 and 0.30–0.35m depth) confirm a significant marine (tidal) influence at this locality. Core 682 was dominated by the same two diatom species as core 719, but the assemblage lacked the diverse freshwater element and had a marked marine aspect with common Navicula monilifera, a species frequently associated with sandy substrates around the British Isles. This is consistent with core 682 being located some 3km seaward of core 719 (Fig. 3). The downstream–upstream partitioning of marine indices in estuaries was not observed by Farr (Reference Farr, Batten and Keen1989), who has written the only study to date of the palynology of UK estuarine sediments.
2.5. Mineralogy and petrology
West of Greenock, 31 samples from seven sediment cores were investigated. The mineralogy was dominated by quartz (27.0–77.7%), albite (7.8–23.0%), K-feldspar (4.8–12.6%) and clay minerals: undifferentiated ‘mica' (1.1–25.1%), kaolin group minerals (<0.5–11%) and chlorite (1.1–11.1%), with minor carbonates (mostly shell material), hematite, pyrite and smectite.
Trace quantities of heavy minerals, including zircon, monazite, apatite, ilmenite, Fe and Ti oxides, and barite were observed, in addition to well-preserved pyrite framboids, a common constituent of marine and estuarine sediments (e.g., Schoonen, Reference Schoonen, Amend, Edwards and Lyons2004). The pyrite, if formed in situ by diagenetic processes, could be a sink for heavy metals. Anthropogenic components included spherical particles (20–200μm across) resembling fly ash (composed of Al, Fe, Si, O and trace Mg, K, Ti, Ca). Other <1mm particles, with distinctive vesicular texture and composed of Al-rich silicate with trace amounts of Fe, Ti and K, are probably fragments of slag. Fly ash was seen in varying amounts in all the samples studied, and slag was identified in cores 720, 739 and 749 only (Fig. 3b). These are samples from the inner Holy Loch (720) and the two dredge spoil disposal grounds, so perhaps their enhanced anthropogenic components are not surprising. Core 739 also contained abundant lithic clasts of siltstone and sandstone that are typical of Lower Carboniferous rocks bordering the Clyde Estuary E of Greenock – a likely input from dredging. Core 759 (in Gourock Bay) had a negligible anthropogenic component, but contained possible steel fragments.
East of Greenock, 50 samples from 14 sediment cores were studied petrographically and 63 samples (nine surface and 54 from 16 cores) by XRD. Quartz was the dominant mineral (25.3–85.5%), with the other main components being albite (6.0–15.7%), K-feldspar (2.4–9.7%), chlorite (1.2–16.0%), ‘mica' (0.9–31.5%) and ‘kaolin' (<0.5–16.1%). The prevalence of sandier sediments in the inner area is reflected by a generally higher proportion of quartz (median 77.3% compared with 44.1%) and lower medians for all other major minerals (summed median of 20.7% compared with 45.6% for the outer area). Slag was frequently encountered in these samples and fly ash was less commonly observed.
2.6. Geochemistry of surface sediments
2.6.1. Inorganic
The highest concentrations of Cu in surface sediment occur in the urban area (up to 201mgkg–1) and in the Holy Loch (up to 160mgkg–1), while the highest concentrations of Pb occur in the inner estuary (up to 370mgkg–1) and the urban estuary (up to 321mgkg–1; Fig. 5).
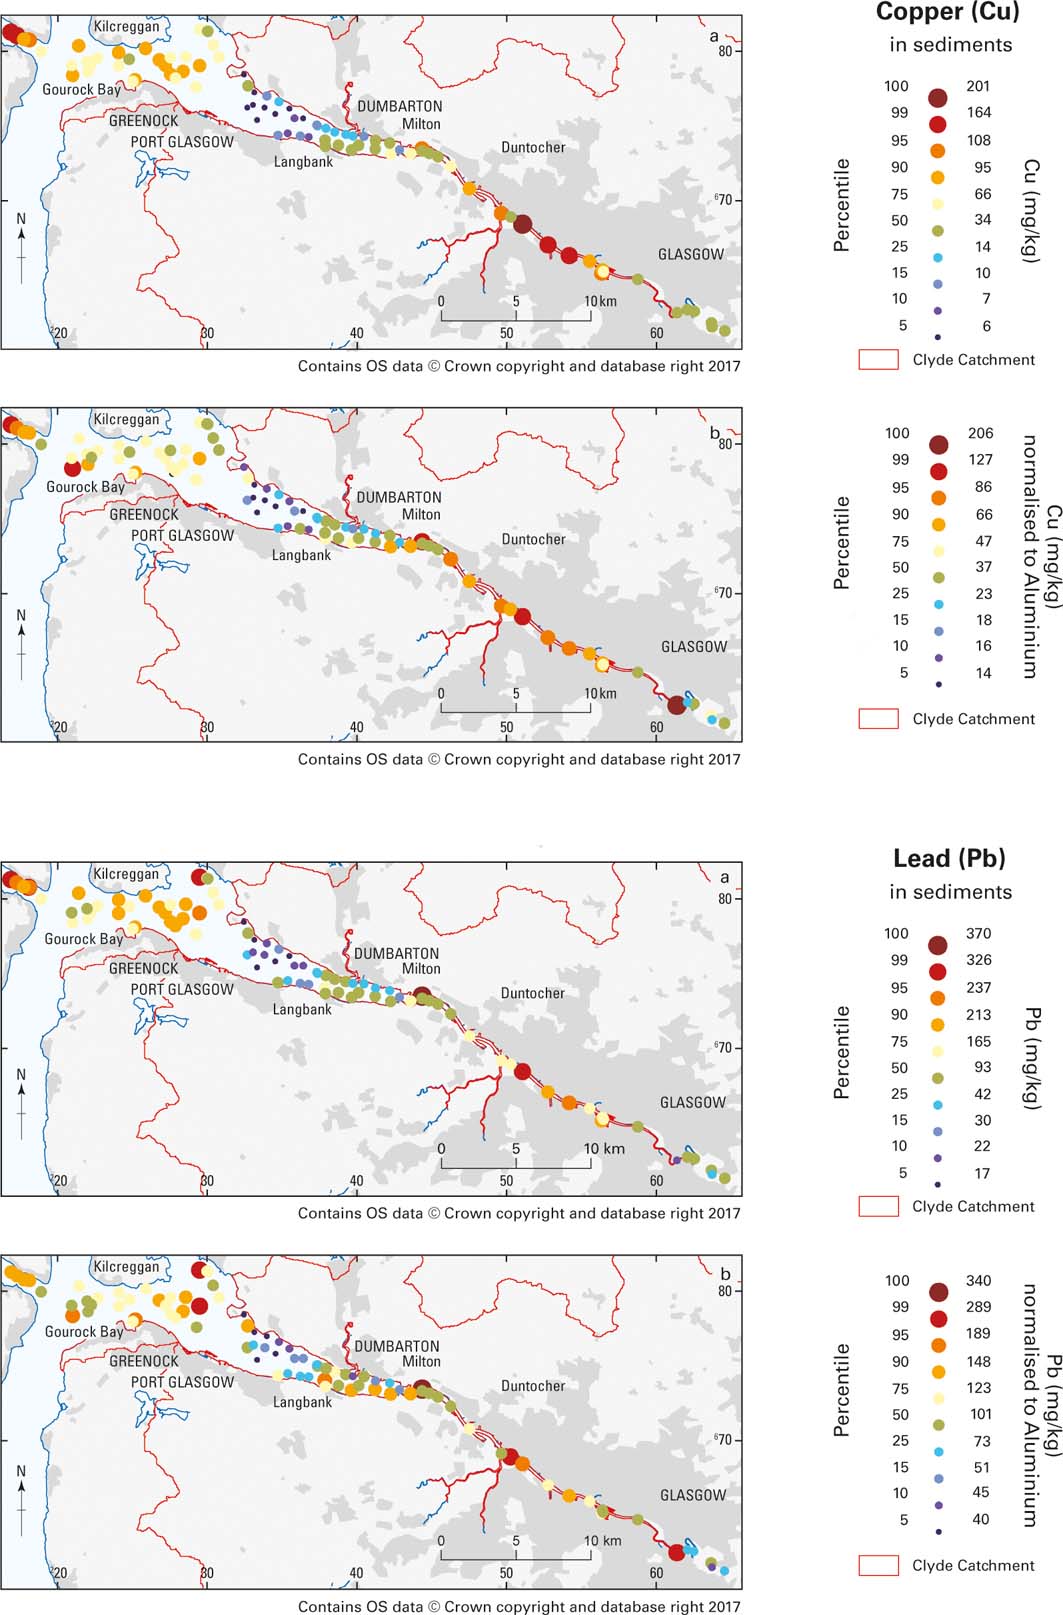
Figure 5 Graduated symbol maps of Cu and Pb distributions in the Clyde Estuary surface sediments. Percentiles of the data distribution are shown for (a) the analysed values and (b) the values normalised to Al to address possible grain-size variations.
Other elements such as Co, Cr, Ni, Sb and Zn show similar element distribution patterns to Cu and Pb, with the highest element concentrations occurring in the urban estuary, gradually decreasing to the middle estuary, where the lowest element concentrations were measured. The outer estuary samples show higher values again. By comparing Figures 3, 5, it could be assumed that some of the spatial variation might be the result of grain-size variations, as elevated concentrations correlate with muddy seabed sediments. Data were normalised to Al (i.e., divided by the Al concentration) as a proxy for grain size to try to remove such variations. Other possible grain-size proxies, such as Ga, would have produced very similar results as there is a very strong correlation between Al and Ga (r 2=0.972) for the Clyde Estuary surface sediments. Al-normalised metal distribution maps (Fig. 5b) still display a similar pattern, suggesting that grain-size variations are not the only significant influence on metal concentrations in the Clyde Estuary, with anthropogenic inputs as a result of industrial activity and the disposal of dredge spoils also being important.
In order to evaluate sediment quality, metal concentrations can be assessed using environmental quality guidelines (Macklin Reference Macklin and Newson1992). However, as established sediment quality guidelines for metals in river and marine sediments are not available for the UK or the EU, sediment quality in the Clyde Estuary was assessed using those suggested for Florida's coastal waters (MacDonald et al. Reference MacDonald, Carr, Calder, Long and Ingersoll1996) and Canadian freshwater sediment quality guidelines (MacDonald et al. Reference MacDonald, Ingersoll and Berger2000b), as an initial screening tool to identify samples that exceeded the probable effect concentrations (PECs). These were developed from the approach of Long et al. (Reference Long, MacDonald, Smith and Calder1995) and intended as informal (non-regulatory) benchmarks to assess the potential toxicity of sediments. The generic OSPAR ecotoxicological assessment criteria values were not used to assess the sediment quality of the study area, as they apply to marine sediments and not to estuarine sediments that might have been affected by the activities and geology in the catchment area (OSPAR 2008).
Sediment quality guidelines (MacDonald et al. Reference MacDonald, Carr, Calder, Long and Ingersoll1996, Reference MacDonald, Ingersoll and Berger2000b) for Cr (111mgkg–1), Ni (48.6mgkg–1) and Pb (128mgkg–1) were exceeded by 62, 20 and 40% of the samples, respectively, while <8% of the estuarine sediments exceeded the quality guidelines for As (33mgkg–1), Cu (149mgkg–1) and Zn (459mgkg–1; see Fig. 6). There are shortcomings in use of the guideline values. For example, Hayslip et al. (Reference Hayslip, Edmond, Partridge, Nelson, Lee, Cole, Lamberson and Caton2006) point out ERL (effects range–low) for Cu and Cr (Long et al. Reference Long, MacDonald, Smith and Calder1995) are below average marine shale or crustal values and the ERL and ERM (effects range–median) for Ni are not based on a strong correlation between cause and effect, and are within the ranges observed in common rock types. O'Connor (Reference O'Connor2004) concludes that ERL is not a threshold at which the probability of toxicity shows an abrupt increase nor that multiple elements above an ERL increase the probability of toxicity. Because of these shortcomings, various authors have suggested that it is also useful to look at enrichment factors (EFs) relative to natural background concentrations for the area being studied (e.g., Zhang et al. Reference Zhang, Feng, Chang, Qu, Xie and Yu2009).
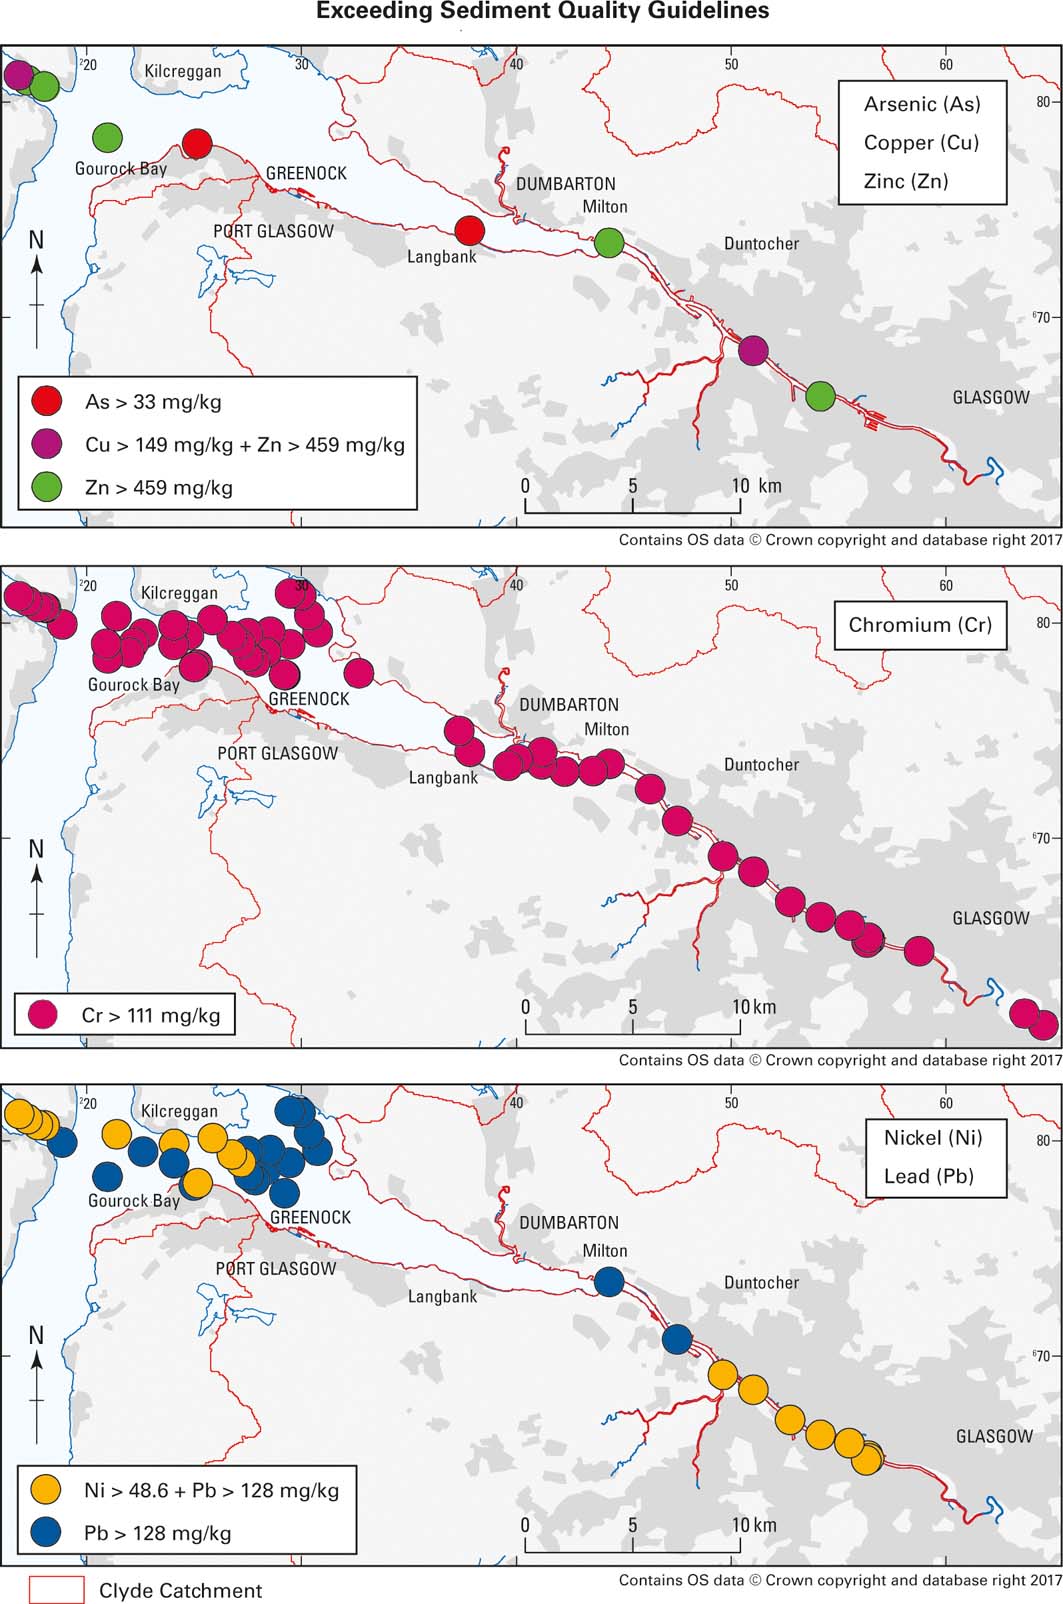
Figure 6 Individual sediment samples in the Clyde Estuary that exceed the probable effect concentrations of the sediment quality guidelines for As, Cu, Zn, Cr, Ni and Pb (Macdonald et al. 1996, 2000b).
In order to assess the extent or degree of contamination, sample data from the study area need to be compared to element concentrations at ‘remote' sites, or those with ‘pristine' conditions with no human influences (Matschullat et al. Reference Matschullat, Ottenstein and Reimann2000; OSPAR 2009). A true quantification of any natural background should be evaluated for each study, taking into account the local variability (Matschullat et al. Reference Matschullat, Ottenstein and Reimann2000). The OSPAR background concentrations, recommended by the OSPAR commission to be used throughout the OSPAR maritime area, were not used in this study, as geological variability or hydrological processes within the estuary could lead to significant variations in background concentrations (OSPAR 2008). Therefore, in order to take into account local variability, the natural background was modelled by calculating the median metal concentration of 15 samples, collected between 0.54 and 2.21m below the surface of the core sample 733, located in Holy Loch (Fig. 3b). This provided the best example from the study area, from the ten cores studied in detail, with a clear distinction between contaminated near-surface sediments and uncontaminated material at greater depth, with lower and relatively constant levels of the metallic elements including Al. Being one of the longest cores recovered, it had more samples from natural background. Other cores had fewer background samples, or background was not present or as well defined for all the elements of interest. Table 1 provides the natural background concentrations used in this study. The OSPAR background assessment concentrations are also included in Table 1 for comparison (OSPAR 2008). EFs were calculated by dividing the analysed sediment metal concentration with the calculated natural background concentration.
Table 1 Estimated background concentrations (BCs)1 of the study area and OSPAR background concentrations (OSPAR Commission 2008). Note: the Oslo and Paris Conventions (OSPAR) BCs were normalised to both Al and Li concentrations where possible, and a rounded value in the upper range was used as the BC (OSPAR Commission 2008).

1Element concentrations are in mg/kg.
2Median values of 15 core samples, collected between 0.54 and 2.21m below the surface of the core sample 733, located in Holy Loch.
Elevated metal concentrations in the urban estuary likely reflect Glasgow's long history of urban and industrial developments. In central Glasgow, estuary sediments contain more than five times (classified as moderately severe enrichment; Birch & Davies Reference Birch and Davies2003; Birch & Olmos Reference Birch and Olmos2008) the natural level of Cr, Cu and Zn, while EFs for Pb (EF=11–16) and tin (EF=21–30) are particularly high (classified as severe enrichment; Birch & Davies Reference Birch and Davies2003). Possible pollution sources might be docks, shipbuilding yards and roads (Fig. 7).
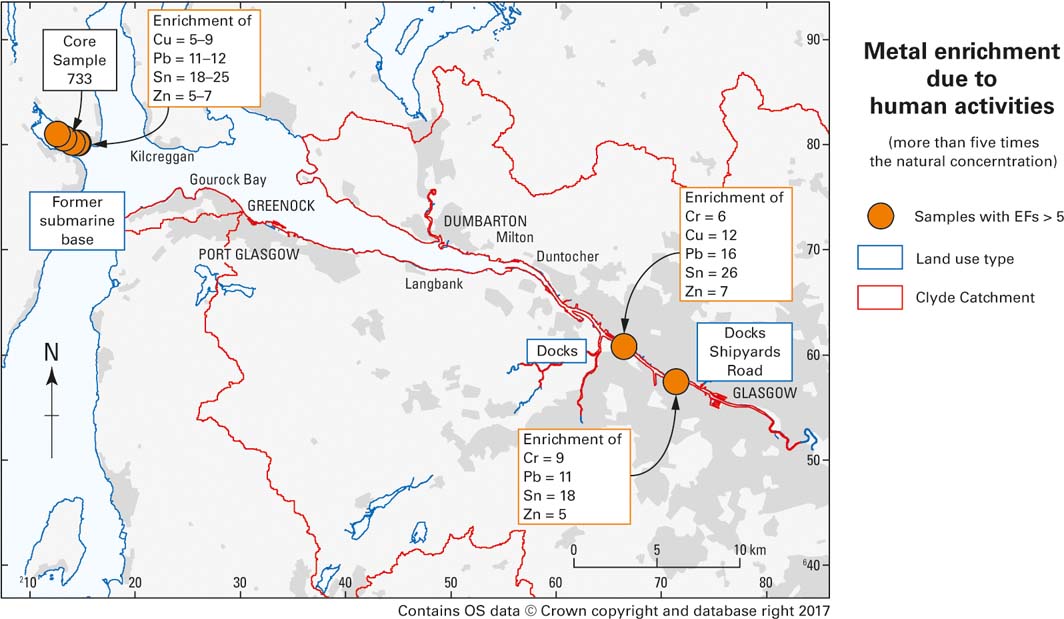
Figure 7 Map showing the calculated enrichment factors (EFs) for sediment samples that had (i) EF>5 for at least four elements and (ii) major element concentrations similar to core sample 733 used to calculate the geological background. Current and former land-use types are also shown as an indication of possible pollution sources.
In the Holy Loch, Cu and Zn are enriched by a magnitude of at least five, while Pb and Sn have EFs between 10–12 and 18–34, respectively. The pollution of Holy Loch by trace metals has been previously confirmed to be severe but localised (Miller et al. Reference Miller, Pirie and Redshaw2000). Such elevated metal concentrations probably still relate to the former US submarine base. The base was closed in 1992 and debris (mainly scrap metal) was cleaned up, but its impact on sediment quality in Holy Loch appears to still be present today.
2.6.2. Organic
An assessment was made of PAHs and PCBs in surface sediments of the inner Clyde Estuary from the tidal limit in Glasgow to Milton, as reported by Vane et al. (Reference Vane, Harrison and Kim2007b). In summary, total PAH concentrations in the sediments ranged between 630 and 23,711μgkg–1. This is broadly in line with values from earlier studies of UK estuaries, including the Clyde, Tyne, Wear and Tees (Woodhead et al. Reference Woodhead, Law and Matthiessen1999; Rogers Reference Rogers2002). There was some correlation (r 2=0.56) between the Total Organic Carbon (TOC) and the total PAH concentration of the sediments. Thus, the coarser-grained sands and gravel had lower TOC and total PAH (0.31–2.72% and 630–2615μgkg–1, respectively) than the finer muddy sediments (3.98–6.15% and 11,701–23,711μgkg–1, respectively).
The relative abundances of the PAHs in the sediments suggest a predominantly pyrolytic origin, with a petrogenic component in the vicinity of an oil refinery at Yoker and from possible fuel spills near Upper Harbour, closer to the centre of Glasgow (Fig. 1). The isomeric ratios suggest mainly liquid fuel combustion, with a more limited input from coal combustion (Vane et al. Reference Vane, Harrison and Kim2007b).
Total PCB concentrations ranged from 5.2 to 129.9μgkg–1, with a mean of 46.9μgkg–1. Again, this is consistent with earlier work, except for a value of 1822μgkg–1 reported from Battery Park, Greenock (Edgar et al. Reference Edgar, Davies, Hursthouse and Matthews1999). Consensus-based threshold effect concentrations (TECs) and PECs provide a means of classifying sediments as toxic or non-toxic. These have been reported for total PCB concentrations in freshwater sediments as 59.8 and 676μgkg–1, respectively (MacDonald et al. Reference MacDonald, Dipinto, Field, Ingersoll, Lvong and Swartz2000a). On this basis, seven sites fall below total PCB TEC; whereas, Lower Harbour, Merklands and King George V Dock (see Fig. 1 for locations) lie between TEC and PEC.
2.7. Geochemistry of cores
The chronology of human activity in the Clyde and its catchment, and the dates of introduction (and cessation of use) of different natural and anthropogenic materials, are known. Hence, the age of the sediments and a history of contamination can be deduced from the study of contaminant distribution with depth in sediment cores.
A number of potential contaminants were examined with depth in the sediments, using a selection of cores. These were chosen on the basis of initial screening of the sedimentology, automated gamma logging and selected analysis using portable XRF for a number of inorganic trace elements. The possible contaminants included inorganic and organic species and radionuclides, and a study was made of Pb-isotope ratio variation.
In many cores a distinction could be made between uncontaminated sediments, in the deeper portion of the core, and contaminated sediments near the surface; the former having lower concentrations of naturally occurring components and an absence of anthropogenic substances. In general, the study of contaminants in the cores supports the geophysical and sedimentological interpretation of a shallow surface layer of recent (sometimes contaminated) sediment sitting on uncontaminated sediment that may be of considerably earlier glacial or post-glacial origin. The surface layer ranges from less than 1m in thickness to 2–3m (or more) in places.
2.7.1. Inorganic
Lead concentrations, measured in seven sediment cores from the middle Clyde Estuary, ranged from 6 to 631mgkg–1, while 207Pb/206Pb isotope ratios varied from 0.838 to 0.876 (Fig. 8). These are indicative of various proportions of ‘background', British ore/coal and Broken Hill-type petrol/industrial Pb. A chronology was established using published Pb-isotope data for aerosol-derived Pb and applied to the cores by Vane et al. (Reference Vane, Chenery, Harrison, Kim, Moss-Hayes and Jones2011). In summary, from the 19th Century until about 1915, the 207Pb/206Pb isotope ratio was fairly constant at around 0.855. After 1915, this ratio increased markedly as industrial and petrol Pb were used, reaching a peak of 0.893 in the 1980s, and declining thereafter, as petrol Pb was phased out. Core 718 (Fig. 8) reflects all of these changes, suggesting the chronology is feasible for use with the sediment cores, and that there has been a continuous and fairly constant Pb deposition over that period at that site. Other cores reach pre-industrial Pb signatures at depths of 40–70cm, although these were not attained at the base of core 718, despite this extending to a depth of nearly 1m (Vane et al. Reference Vane, Chenery, Harrison, Kim, Moss-Hayes and Jones2011).

Figure 8 Location of samples and organic contaminant depth profiles of sediments from the Clyde Estuary (Vane et al., Reference Vane, Chenery, Harrison, Kim, Moss-Hayes and Jones2011). Abbreviations: TOC = total organic carbon; TPH = total petroleum hydrocarbons; PAH = polyaromatic hydrocarbons; PCB = polychlorinated biphenyls. Rationale for dates: 1750 = pre-industrial from 207Pb/206Pb; 1915 = peak coal production; 1954 = onset of PCB production in UK; 1965–1977 = peak PCB production; 1985 from peak 207Pb/206Pb values. PCB concentration data not shown for core 714 due to interferences. Depth profiles for Pb (filled triangles) and 207Pb/206Pb (filled diamonds). Typical 207Pb/206Pb errors are 0.0012 (2 sigma). Note change in concentration scale for lower set of cores.
Similar patterns of higher concentrations of other inorganic contaminants in near-surface layers and lower, and more consistent values at greater depth, are also apparent for other metals – e.g., As, Cr, Cu, Hg, Ni, Sn and Zn – further suggesting a shallow contaminated zone overlying pre-industrial sediments containing only background levels of these elements.
2.7.2. Organic
The concentrations of total petroleum hydrocarbons (TPHs), PAHs and PCBs were measured in the same seven sediment cores from the middle Clyde Estuary (Fig. 8). Concentrations of TPHs ranged from 34 to 4386mgkg–1, total PAHs from 19 to 16,163μgkg–1 and total PCBs between <4.3 and 1217μgkg–1. Inventories, distributions and isomeric ratios of the organic pollutants were used by Vane et al. (Reference Vane, Chenery, Harrison, Kim, Moss-Hayes and Jones2011) to reconstruct pollutant histories.
In summary, the PAHs have the longest history of any of the organic contaminants, since they are a combustion product that occurs naturally, as well as being introduced that way by man and through other processes, such as metal mining and processing and oil refining. Pre-Industrial Revolution and modern non-polluted sediments were characterised by low TPH and PAH values, as well as high relative abundance of biogenic-sourced phenanthrene and naphthalene. The increasing industrialisation of the Clyde gave rise to elevated PAH concentrations and PAH isomeric ratios characteristic of both grass/wood/coal and petroleum and petroleum combustion. Increasing TPH concentrations, and a concomitant decline in PAHs, mirrored the lessening of coal use and increasing reliance on petroleum fuels from about the 1950s. Thereafter, declining hydrocarbon pollution was followed by the onset (1950s), peak (1965–1977) and decline (post-1980s) in total PCB concentrations.
The concentrations of 16 PBDE congeners, a group of compounds used as flame retardants on a variety of products, were determined in six short sediment cores from the Clyde Estuary (Fig. 9) and reported by Vane et al. (Reference Vane, Ma, Chen and Mai2010). In summary, total PBDE concentrations ranged from 1 to 2645μgkg–1 with an average of 287μgkg–1. Elevated total PBDE concentrations were seen in the uppermost 10cm of four of the cores. Comparison of the down-core PBDE profiles revealed that the increase was driven by the accumulation of deca-brominated diphenyl ethers (BDE). The increase in total PBDE concentrations, and particularly the deca-BDE, may possibly be ascribed to the use and subsequent disposal of electrical appliances such as televisions and computers. The concentrations of PBDE are similar to those reported from the Pearl River Estuary in China, but appreciably higher than Scheldt Estuary and North Sea coastal sediments (Klamer et al. Reference Klamer, Leonards, Lamoree, Villerius, Åkerman and Bakker2005, Mai et al. Reference Mai, Chen, Luo, Chen, Yang, Sheng, Peng, Fu and Zeng2005).

Figure 9 Location of samples and depth profiles of PBDE in sediment cores from the Clyde Estuary (Vane et al., Reference Vane, Ma, Chen and Mai2010). Abbreviations: PBDE=polybrominated diphenyl ethers; BDE=brominated diphenyl ether.
2.7.3. Radionuclides
The distribution of 137Cs down five of the sediment cores from the middle estuary is also potentially informative of the contamination history (Fig. 10). This radionuclide was not introduced into the environment prior to the advent of nuclear weapons and power generation. Peaks in the Clyde area can be ascribed to atmospheric weapons tests in the 1960s, the maximum discharges from Sellafield in the late 1970s (probably the most significant input to the Clyde) and the Chernobyl accident in 1986. The quantity remaining in the sediments is affected by the 30-year half-life of this radionuclide. The chronology from 137Cs in cores 700 and 718 is essentially in line with that from the Pb and organic components. However 137Cs extends into sediments interpreted as 1915 or earlier from the Pb chronology, suggesting either post-depositional redistribution of 137Cs down these cores or that some reinterpretation of the chronology is needed. Core 712 has 137Cs-free sediment in the upper 30cm, suggesting the deposition of eroded sediment of probable pre-1950s age.

Figure 10 Depth profiles of down-cores for 137Cs in Clyde Estuary sediments (see Fig. 3 for locations).
In addition to the middle estuary cores, 137Cs was measured by automated gamma logging in more than 20 cores from the W of Greenock. This nuclide is absent in many of the cores below 30–60cm depth, indicating pre-1950s sediment. The largest peak in values in the Clyde Estuary sediments can probably be ascribed to Sellafield, whilst a deeper, smaller peak seen in some cores may reflect weapons fallout, in the absence of modification by any significant sediment mixing, erosion or down-core redistribution. Pb-isotope data suggest a number of cores possess a largely uninterrupted history of sedimentation. Occasionally cores have 137Cs at much greater depths, with the maximum depth being achieved in core 787 at 1.7m in an area of likely more rapid muddy sedimentation, ‘the deep' NW of Greenock.
2.8. Solid-phase fractionation of potentially harmful elements
Recent developments in sequential extraction methodologies and subsequent data processing have shown that simple mineral acid extractions combined with multivariate statistical analysis can provide a powerful tool for examining the solid-phase fractionation of potentially harmful elements in sediments (Santamaria-Fernández et al. Reference Santamaria-Fernández, Cave and Hill2006). This methodology has been applied to 15 sediment samples (including one duplicate) taken from depths of 0–1.24m from 11 cores from the Clyde Estuary (Fig. 11).
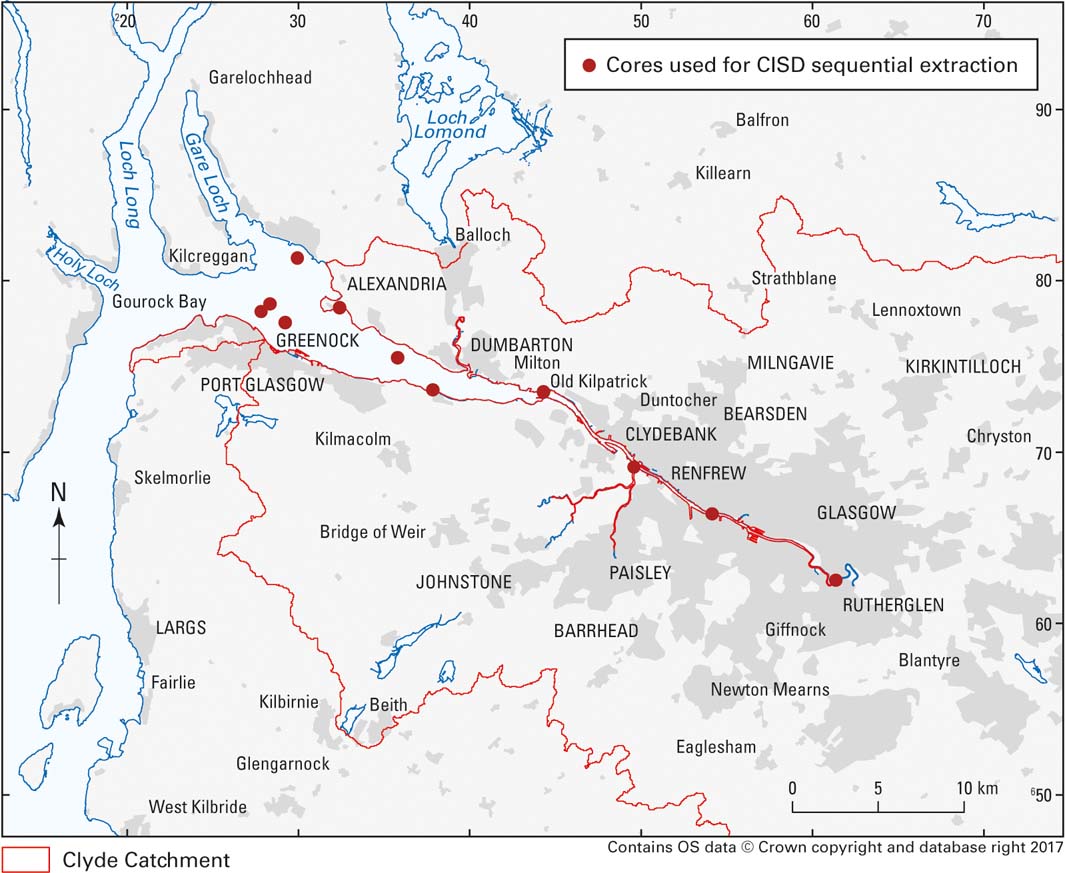
Figure 11 Locations of cores used for CISED sequential extraction study.
The data processing identified 19 potential geochemical components in the 15 sediments studied. The interpretation of these components is based on the elements they contain and the mineral phases known to be present in the sediments (see section 2.5). The relative amounts of each component across all samples are summarised in Figure 12. The components are ordered by increasing difficulty of extraction. This gives a measure of the availability of the component and, hence, any potentially harmful elements associated with it. The fractionation of As, Cd, Cr, Pb and V between the geochemical components is shown in Figure 13.
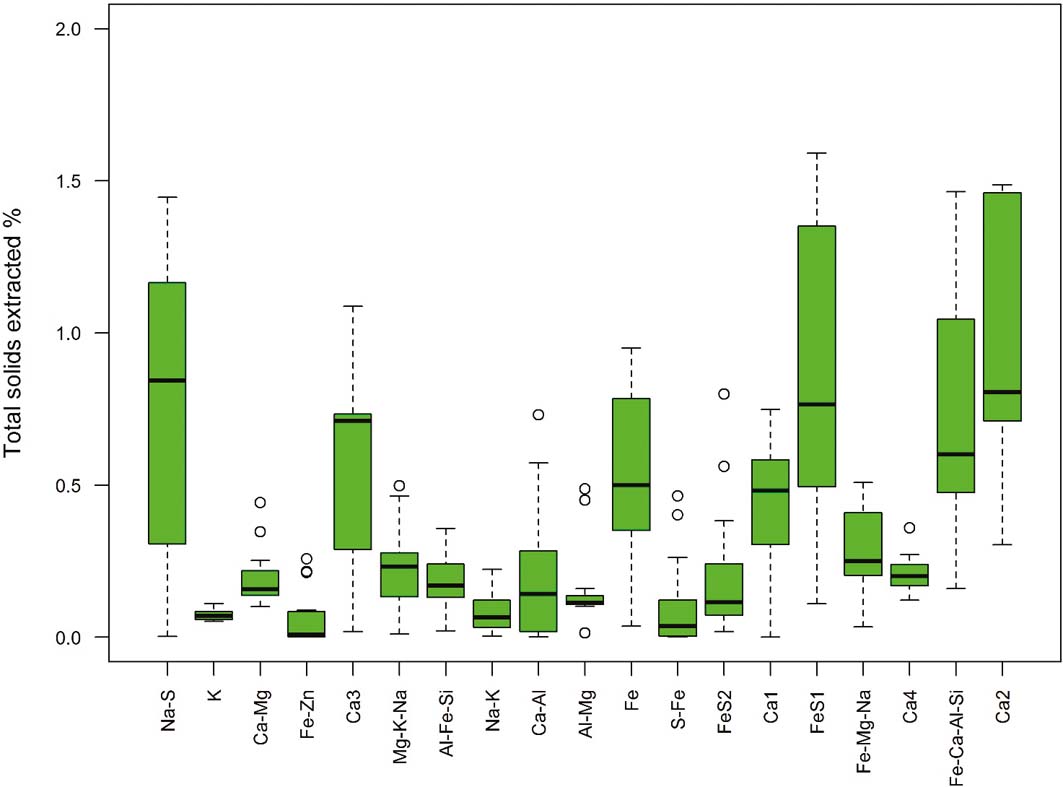
Figure 12 The relative contribution of each component in the CISED sequential extractions summarised as boxplots showing the median (bold line), interquartile range (box), data within 1.5×the interquartile range (whiskers) and possible outliers outside this. The components are ordered by increasing difficulty of extraction.
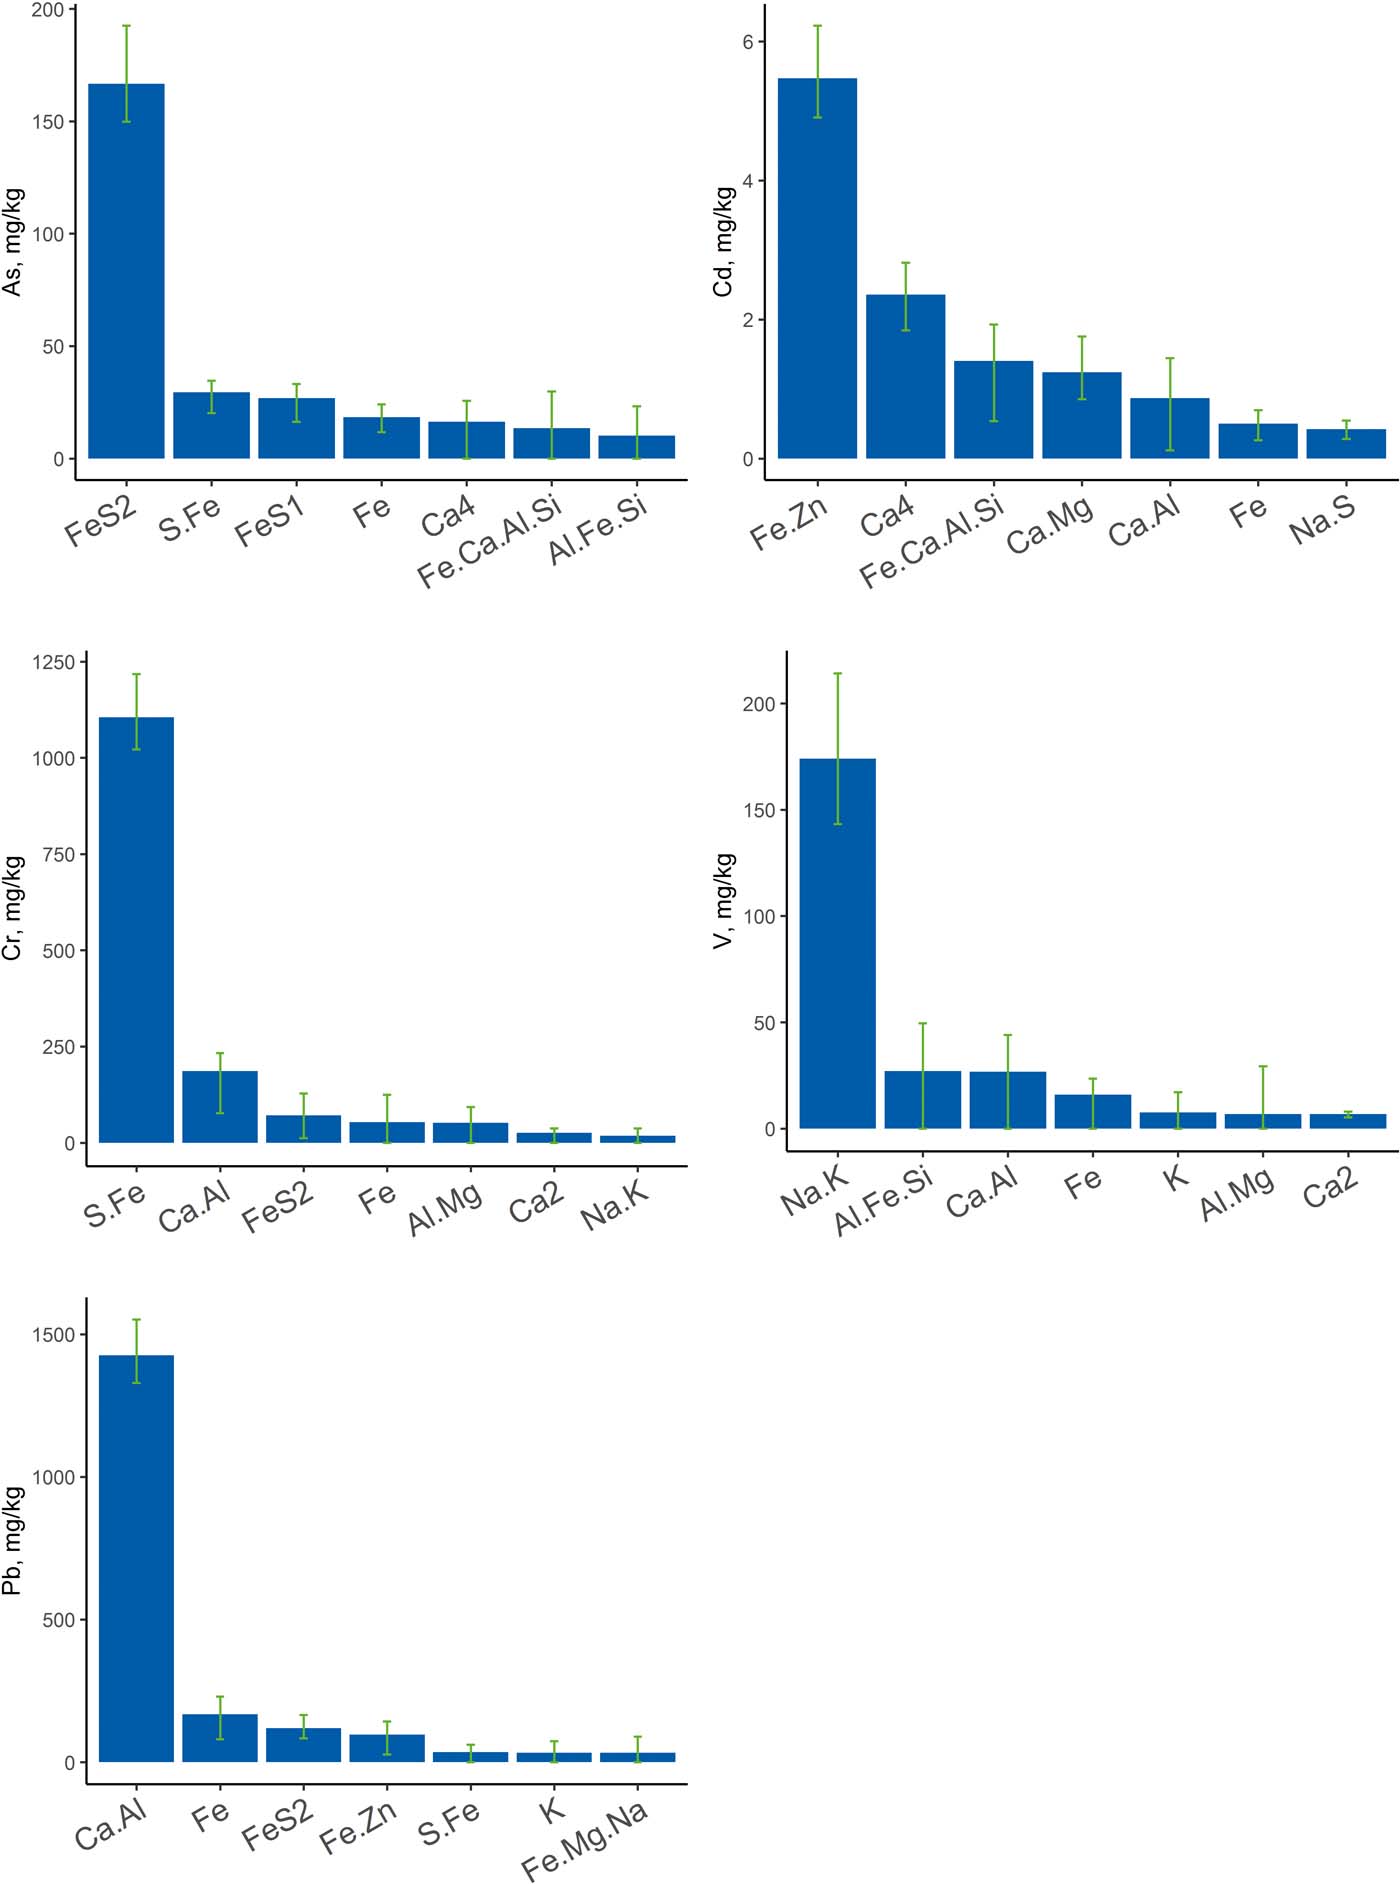
Figure 13 The fractionation of As, Cd, Cr, Pb and V between the geochemical components from the CISED sequential extractions.
The spatial distributions of the five physicochemical components associated with As, Cd, Cr, Pb and V provide some broad insights into sediment origins, even though only 15 sediment samples were examined between Glasgow city centre and Greenock.
The Fe-sulphide component (Fe.S.2), which is associated with As, shows highest concentrations in the outer estuary Fig. 14a), suggesting that the reducing conditions for its formation are more favourable in the open estuary environment.
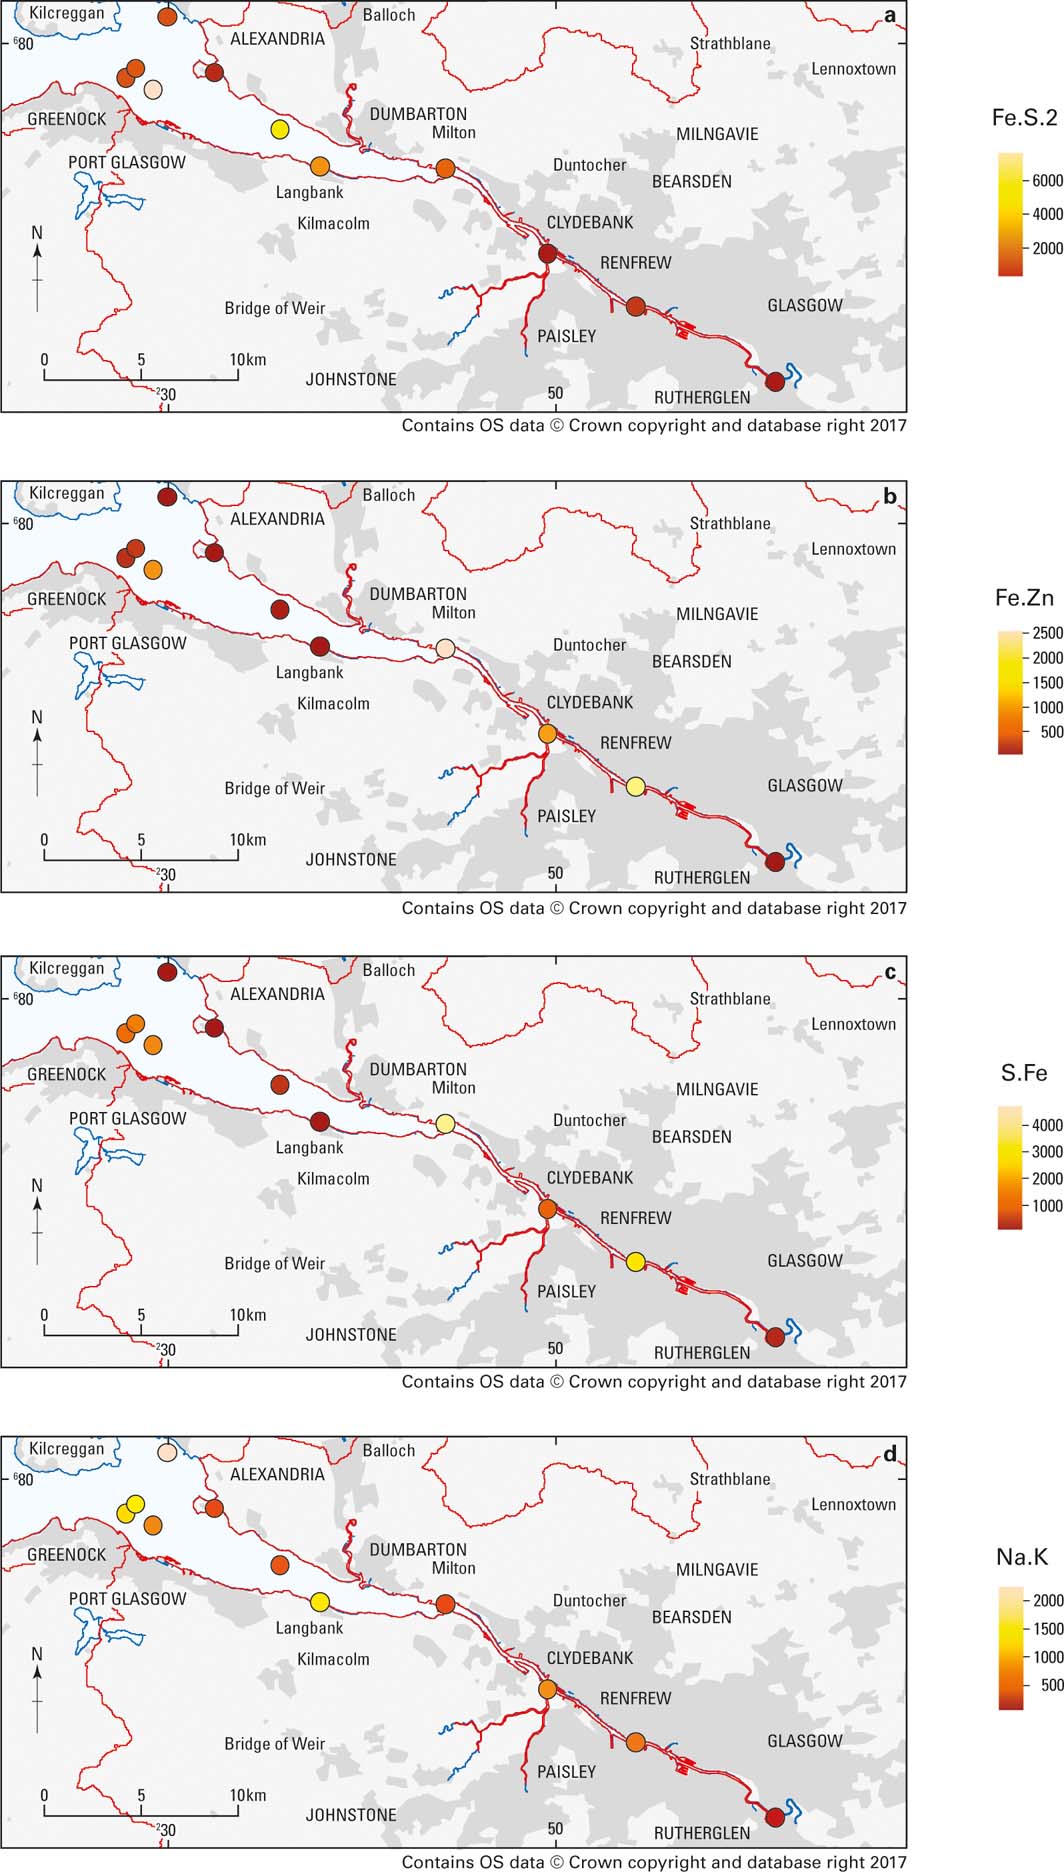
Figure 14 Spatial distribution of the main physicochemical components in the Clyde Estuary (mg/kg). (a) As-containing (Fe.S.2). (b) Cd-containing (Fe.Zn). (c) Cr-containing (S.Fe). (d) V-containing (Na.K).
Cadmium shows associations with a variety of geochemical sources including carbonates, aluminosilicates, Fe oxide and porewater, but is mostly concentrated in the Fe.Zn component, thought to be an Pb/Zn oxyhydroxide. The Fe.Zn component shows highest concentrations in the built-up and industrialised areas of the inner estuary (Fig. 14b). There is also a higher concentration in one of the samples off Greenock, where industrialised areas also border the estuary. This confirms that this component is most likely related to anthropogenic inputs from industry.
The S.Fe geochemical component is associated with Cr and is thought to be an amorphous sulphide film. Chromium does appear to accumulate in acid volatile sulphides under anoxic conditions (e.g., Berry et al. Reference Berry, Boothman, Serbst and Edwards2004), but could also be associated with organic matter. The highest concentrations of the S.Fe geochemical component again occur in the inner estuary and in samples taken off Greenock (Fig. 14c). Glasgow is known to have had localised Cr contamination problems from industrial processing of waste from past Cr production. Whether this has any connections with this component is unclear, but the proximity of the higher concentrations to more industrialised areas suggests it comes from anthropogenic contamination.
Lead shows some associations with Fe oxides and sulphides, but is mainly associated with a component that has high but variable Ca content, with more clearly defined Al, Mg, P and Zn contributions (ca.1–15%). This component, like Cr, is higher in the samples from industrialised areas, also suggesting an anthropogenic source.
The Na.K component, which is extracted with the acid containing hydrogen peroxide that oxidises organic matter, is associated with V and smaller amounts of B. This suggests this is derived from fuel oil residues, which are known to contain V (Colina et al. Reference Colina, Gardiner, Rivas and Troncone2005) and borates present as additives. It occurs at varying concentrations along the river and estuary, but the highest amounts are found in the sediments sampled off Greenock on the S shore, where there are ferries and docks, and Helensburgh (NW of Alexandria) on the N shore where there are marinas (Fig. 14d).
3. Discussion and conclusions
A consistent picture has emerged from the different components of this investigation. Most of the Clyde Estuary is not, with a few exceptions, an area of active modern sedimentation. Rather, a thin veneer of recent contaminated sediment, mostly less than 1m thick, rests on earlier material of glacial and post-glacial origin.
Within the near-surface sediments, depth profiles of different contaminants, their ratios and Pb-isotope ratios, reveal a quite complex history of contamination through what has been termed by some as the ‘Anthropocene'. There appears to be evidence of effects going back to the start of the Industrial Revolution, and perhaps beyond, to early forest clearance, mining and burning of fuel and smelting of ores. This reached a peak during Glasgow and Clydeside's heyday as an industrial powerhouse in the 19th and early–mid-20th centuries, and has declined in more recent times.
A number of contaminants were first introduced during the 20th Century, such as PCBs in the 1920s and 137Cs in the 1950s. These reached a peak in the environment locally by the late 1970s or 1980s and, although persisting to the present day, even when the use of some (such as PCBs) has been proscribed, have declined in quantity. The use of petroleum products replaced coal as the most important fuel over similar timescales, and this is apparent in varying PAH patterns and through the increase and subsequent cessation of the use of Pb as a petrol additive.
These changes have led to depth profiles of different contaminants that are sometimes quite consistent in the history they reveal, but at other times somewhat contradictory and difficult to unravel. Thus, there is not always complete agreement between what the depth profiles of Pb isotopes, organic contaminants and radionuclides appear to tell us. These can perhaps be explained by imperfections in constructing a Pb chronology for estuarine sediments based on aerosol deposition data, the complexity of different sources of organic compounds such as PAHs and PCBs and their possible alteration over time, and the potential for redistribution of radionuclides such as 137Cs during diagenesis. The divergence of data from different dating methodologies demonstrates that any one may not give the correct answer, and multiple methods may be needed to provide a consensus result.
Depth profiles from the dredge spoil sites in Loch Long were, as might be expected, quite confused. The repeated disposal of sediment over time led to a great deal of inhomogeneity, apparent in both the admixed sediments and their associated contaminants.
Whilst the majority of sites studied only revealed contaminated sediment to a depth ranging from a few tens of centimetres to a metre, this was not true for all locations. Core 787 (Fig. 3b) from ‘the deep' off Greenock appears to have been a relatively rare site of greater deposition of muddy sediment in this seabed depression. Here, 137Cs extends to a depth of some 1.7m into the sediment. This implies an average sedimentation rate of almost 3cm a year for this location, whereas that for other sites is no more than 1cm a year.
The concentrations of certain elements exceed threshold or guideline values where they could give rise to potentially harmful environmental impacts. Such guideline or threshold values can be somewhat simplistic, as they may not take account of natural levels of the substances or their bioavailability. Some of the guideline values developed by OSPAR for marine sediments can, for instance, span natural ranges. In other cases there are no guideline levels for marine sediments, and those for freshwater sediments (discussed earlier) or soils might not be appropriate to use.
Multivariate statistical analysis of sequential extractions from the sediments indicates the likely geochemical components with which potentially harmful elements are associated. The main associations for Cd, Cr, Pb and V are all suggestive of different anthropogenic inputs associated with industry or shipping.
4. Acknowledgements
We are very grateful to Glasgow City Council for co-funding the early investigations of the inner estuary and for advice, discussion and support at all stages. SEPA kindly provided Endrick II and her crew for geophysics and sampling. The Glasgow Humane Society, in particular George Parsonage, assisted with sampling in the innermost estuary within Glasgow. The Marine Station at Millport conducted the 2007 survey using Aora, and Aspect Land and Hydrographic Surveys carried out the multibeam survey on board MV Remote Sensor. Gus Mackenzie, Gordon Cook and colleagues at SUERC are thanked for 210Pb and radiocarbon analysis. We would like to thank our present and former colleagues Richard Holmes, David Wallis, Christian Wilson and Mike Wilson for geophysical data collection, processing and interpretation and James Glendinning and John Derrick for core sampling. Many other BGS colleagues also contributed to the studies described through core handling, sample preparation and analysis. This paper is published with the permission of the Executive Director of the British Geological Survey. BGS/NERC reference: PRP18/024.