


1 Introduction
Each year, millions of volunteers devote billions of hours to helping others.Footnote 1 While their motives for donating their time having been extensively studied,Footnote 2 the question of how to motivate them has not. It is important for researchers and non-profit managers to understand under what conditions volunteers increase their efforts in coping with the tasks that are allocated to them, especially in those increasingly-common settings where, on some single occasion for some short-term project, managers need to motivate large numbers of unpaid workers whom they do not know personally and who differ greatly in their motives, skills, and commitment towards the organization’s mission. In such settings where financial incentives do not apply and only the conditions can raise or lower volunteers’ intrinsic motivation, we study the causal effects of (a) the opportunity to vote on what the money raised will be spent on and (b) the prospect of individual performance feedback on volunteers’ quantity of work.
Volunteering in projects with a limited duration on a sporadic basis is the choice of many individuals with restrictions such as increased personal time constraints, increased mobility, and irregular job obligations. Accordingly, volunteers are increasingly switching from long-term, regular, and frequent volunteer services to short-term or even one-time activities (Hustinx et al. Reference Hustinx, Haski-Leventhal and Handy2008). These so-called “episodic volunteers” (Culp and Nolan Reference Culp and Nolan2000; Merrill Reference Merrill2006) are becoming a critical resource for institutions relying on external unsalaried support (Putnam Reference Putnam1995; Eckstein Reference Eckstein2001; Hustinx Reference Hustinx2001; Hustinx and Lammertyn Reference Hustinx and Lammertyn2003; Handy et al. Reference Handy, Brodeur and Cnaan2006; Beder and Fast Reference Beder and Fast2008; Smith et al. Reference Smith, Holmes, Haski-Leventhal, Cnaan, Handy and Brudney2010; Wilson Reference Wilson2012). Common examples of activities they participate in include charity runs to raise funds for education, research, or support services; community events; and events to care for marginalized groups (Harrison Reference Harrison1995).
For such projects, the critical question is not how to motivate people to volunteer. Recruiting episodic volunteers is a rather easy task, since many people are intrinsically motivated to help when the commitments of time and energy are low and the benefits for those in needs are great. Accordingly, episodic volunteering events often attract hundreds of helpers (e.g. to prepare meals for patients; see Hustinx et al. Reference Hustinx, Haski-Leventhal and Handy2008) or even thousands of helpers (e.g. during a crisis such as an earthquake or hurricaneFootnote 3 (Cnaan and Handy Reference Cnaan and Handy2005)). Instead, the key question is how to motivate volunteers effectively. This question is under-researched despite its enormous practical implications (see the recent meta-analysis by Englert and Helmig Reference Englert and Helmig2018).
Causal evidence for ways to increase volunteers’ performance is especially scarce. This is surprising, given the huge number of experimental studies in the lab and in the field studying the effects of financial and non-financial incentives on the performance of paid workers.Footnote 4 However, evidence from those studies is not easily transferable to unpaid volunteers. While the gold standard for performance increases among standard workforces is still money (see e.g. Levitt and Neckermann Reference Levitt and Neckermann2014), monetary incentives seem to crowd out intrinsic motivation among volunteers.Footnote 5 In a seminal experimental paper, Gneezy and Rustichini (Reference Gneezy and Rustichini2000) incentivized volunteers with small cash rewards. It became evident that rewarded volunteers worked fewer hours than volunteers who received no compensation. Similarly, Conrads et al. (Reference Conrads, Irlenbusch, Reggiani, Rilke and Sliwka2016) found in a field experiment that offering small monetary rewards does not help or even becomes detrimental compared to a pure volunteering treatment or the opportunity to get a certificate. On the other hand, in line with neoclassical reasoning, when volunteers in the same experiment were offered larger monetary rewards, hours they offered to work were high. So in the absence of budget constraints, money may help. Many nonprofit organizations, however, simply cannot afford to compensate their volunteers adequately. The question, then, is whether any non-financial tools are feasible. In general, non-monetary incentives such as worker recognition or adding meaning to mundane tasks can have a strong motivational impact on work performance of paid workers (e.g. Kosfeld and Neckermann Reference Kosfeld and Neckermann2011; Ashraf et al. Reference Ashraf, Bandiera and Jack2014; Kosfeld et al. Reference Kosfeld, Neckermann and Yang2017), but again, such means of motivation are not easily transferable to volunteers, especially not to episodic ones. However, it isn’t impossible to motivate volunteers with non-monetary incentives. Bradler et al. (Reference Bradler, Dur, Neckermann and Non2016) conducted a natural experiment in which a subset of students hired for a one-time data-entry job unexpectedly received thank-you cards during task performance. The output of the students in the subset increased significantly following the expression of gratitude. At the same time, several non-monetary incentives that have recently been studied for paid workers would be hard to transfer to a volunteer context. These include the implementation of competition among workers (Irlenbusch and Ruchala Reference Irlenbusch and Ruchala2008; Cardinaels et al. (Reference Cardinaels, Chen and Yin2018), as well as non-material benefits such as career opportunities and preferred parking (Barbara et al. Reference Barbara, Grolleau and Mzoughi2017).
The volunteering context seems to be simply too different to apply ordinary motivational factors from normal working life. This point is underscored by the few studies that have so far attempted to investigate a causal relationship between the factors of the work situation that can be manipulated and the performance of volunteers. Al-Ubaydli and Lee (Reference Al-Ubaydli and Lee2011) provided volunteers with tailored communication via newspaper articles according to their individual predominant motive for their volunteer engagement. Compared to a control group, the results show only a small positive effect on volunteered hours, and only for those volunteers who are mostly motivated by career concerns. Conrads et al. (Reference Conrads, Irlenbusch, Reggiani, Rilke and Sliwka2016) find potential detrimental effects of seemingly useful rewards, such as waiving a fee for student volunteers helping at a conference, which massively decreased the number of work hours offered.
When thinking about how to inspire people to perform best, it is crucial to create an atmosphere within people will increase their intrinsic motivation themselves. Such intrinsic, autonomous motivation is especially important in voluntary work, which is defined as performing an activity of one’s own free will, without formal obligations or remuneration (Bidee et al. Reference Bidee, Vantilborgh, Pepermans, Huybrechts, Willems, Jegers and Hofmans2013). Volunteers usually contribute to the greater good as long as they feel they are making a meaningful contribution. We build upon the concept of autonomous (also called self-determined) motivation, as it refers to engaging in an activity of one’s free will or with a sense of choice (Ryan and Deci Reference Ryan and Deci2000; Grouzet et al. Reference Grouzet, Vallerand, Thill and Provencher2004). The underlying self-determination theory (Deci and Ryan Reference Deci and Ryan1985; Ryan and Deci Reference Ryan and Deci2000) is one of the leading theories of human motivation. It posits that support in volunteers’ autonomy is the way to create the conditions within which other people will motivate themselves.
In this paper, we therefore experimentally test the impact of two conditions intended to increase autonomous motivation on the performance of unpaid workers. Our partner organization supports children with cardiac problems, raising funds through charitable donations and through the sale of goods. For an upcoming summer fair, the organization invited volunteers to a one-time social project about 1.5 h long. In total, 190 volunteers (mostly college students), showed up and agreed to produce handmade greeting cards by coloring mandala paints. We used this setting to test under which conditions different types of volunteers in the absence of pay would increase their performance. In the vote treatment, we allowed volunteers to vote for which purpose the earned money should be spent, while in the feedback treatment we announced that they would receive individual performance feedback after the work was done.
We observe a statistically and economically significant performance increase between both treatments and the control group. Volunteers in feedback colored 36.5% more cards and those in vote colored 44.6% more cards, while the cards’ quality does not differ significantly between treatments. Male volunteers respond more positively to the feedback announcement, while females get strongly motivated by the opportunity to vote for the preferred purpose. Both treatments work especially well among volunteers with low task enjoyment, a subgroup that has low intrinsic motivation. These findings support the idea that in the absence of monetary incentives, simple cost-effective tools—easy to adapt for diverse individuals—can be designed to boost the performance of volunteers.
2 Conceptual framework
Increasing the performance of volunteers is not a simple task, especially because incentives that seem reasonable at first glance (such as pay for performance) have been shown to backfire. Indeed, extrinsic rewards seem to crowd out intrinsic motivation (Gneezy and Rustichini Reference Gneezy and Rustichini2000), at least for low monetary incentives and relatively weak extrinsic motivators (Conrads et al. Reference Conrads, Irlenbusch, Reggiani, Rilke and Sliwka2016). The vast majority of people volunteer not for monetary reasons but many for a so-called “warm glow,” a positive feeling (Andreoni Reference Andreoni1989; Ellingsen and Johannesson Reference Ellingsen and Johannesson2009; Bauer et al. Reference Bauer, Bredtmann and Schmidt2013, Brown et al. Reference Brown, Meer and Williams2019). Volunteers “display a stronger desire to donate time and effort than to donate money” (Brown et al. Reference Brown, Meer and Williams2019, p. 33). Mentioning extrinsic rewards seems to reduce intrinsic motivation among volunteers (Conrads et al. Reference Conrads, Irlenbusch, Reggiani, Rilke and Sliwka2016). A crucial factor that explains the variability in intrinsic motivation is the perceived meaningfulness of a task. Experimental evidence from the lab (Ariely et al. Reference Ariely, Kamenica and Prelec2008) and the field (Chandler and Kapelner Reference Chandler and Kapelner2013; Chadi et al. Reference Chadi, Jeworrek and Mertins2017; Bäker and Mechtel Reference Bäker and Mechtel2018) suggests that people perform better when they feel that what they do is meaningful. Since typical voluntary tasks—such as stuffing letters, sorting donated clothes, or preparing standardized food packages—are often simple and repetitive (Smith et al. Reference Smith, Holmes, Haski-Leventhal, Cnaan, Handy and Brudney2010), easy to understand by mostly inexperienced volunteers (Hyde et al. Reference Hyde, Dunn, Scuffham and Chambers2014), and independent of volunteers’ cognitive or crafting skills (Hustinx et al. Reference Hustinx, Haski-Leventhal and Handy2008), the task itself usually provides no source of meaningfulness. Therefore, in volunteer settings, it is even more important that the entire work environment is designed to be as appealing as possible.
Psychologists emphasize that a social environment can stimulate, hinder, or block the positive features of human nature. The conceptual framework underlying this observation is the self-determination theory of Deci and Ryan (Reference Deci and Ryan1985) and Ryan and Deci (Reference Ryan and Deci2000), which defines three innate psychological needs for motivation: (1) competence (the feeling of being able to work efficiently and achieve the desired results) (2) autonomy (being able to choose one’s actions from a range of possibilities) and (3) relatedness (feeling connected to other human beings). In the seminal papers, Gagné (Reference Gagné2003) and Gagne and Deci (Reference Gagné and Deci2005) demonstrate that self-determination theory can be applied to the domain of prosocial motivation, and suggest encouraging social structures that fulfill basic psychological needs. People who feel competent, and related to their peers may be more likely to be motivated to engage in more prosocial behaviors. While survey evidence (e.g. Haivas et al. Reference Haivas, Hofmans and Pepermans2012; Bidee et al. Reference Bidee, Vantilborgh, Pepermans, Huybrechts, Willems, Jegers and Hofmans2013) support this notion, there is—to the best of our knowledge—no experimental study so far analyzing the impact of autonomy-supporting contexts on the actual performance of volunteers.
We designed two treatments that were intended to give people choice and encouragement for personal initiative and also support their feelings of relatedness. In the feedback treatment, we announced that volunteers would receive individual performance feedback after the work was done. This was expected to satisfy individuals’ basic psychological need of relatedness and competence in that people can better learn how they contribute to the greater good. As self-determination theory suggests, being involved in activities that benefit society and feeling related to other human beings, including to a group or the organization, can enhance intrinsic motivation (Ryan and Deci Reference Ryan and Deci2000). Feeling connected and engaged in the activity helps to strengthen volunteers’ relationship with the nonprofit organization and its members. Further, the prospect of feedback is likely to increase the feeling to perform adequately. The economic literature on the provision of feedback mostly suggests positive effects, such as on educational outcomes (Azmat and Iriberri Reference Azmat and Iriberri2010), student performance (Bandiera et al. Reference Bandiera, Larcinese and Rasul2015), work performance (e.g. Falk and Ichino Reference Falk and Ichino2006; Gerhards and Siemer Reference Gerhards and Siemer2015), and task motivation (Banuri et al. Reference Banuri, Dankova and Keefer2018). A few studies (e.g. Eriksson et al. Reference Eriksson, Poulsen and Villeval2009, Azmat et. al Reference Azmat, Bagues, Cabrales and Iriberri2019) report detrimental outcomes.
In the vote treatment, we allow volunteers to vote for which purpose the earned money should be spent. This treatment supports both autonomy (people have a say in the purpose of the money to be raised) and relatedness (people may contribute to the greater good in the way they like). By allowing volunteers to participate in the decision-making process, presumably their perceived freedom and choice was increasing. Besides, this treatment allows people to feel that their contribution matters for the greater good; they experience what they have contributed to the good cause by deciding the purpose of their work. While the causal effect of such a strategy has not been analyzed, there is some related evidence on the impact of participation in the decision-making process on workers’ performance. Charness et al. (Reference Charness, Cobo-Reyes, Jimenez, Lacomba and Lagos2012) and Jeworrek and Mertins (Reference Jeworrek and Mertins2019a) varied workers’ participation in the determination of wages. Allowing workers to self-determine their wages yielded performance-enhancing effects that were smaller in the field (Jeworrek and Mertins Reference Jeworrek and Mertins2019a) than in the lab (Charness et al. Reference Charness, Cobo-Reyes, Jimenez, Lacomba and Lagos2012). Related studies also show mixed effects. Franke et al. (Reference Franke, Gurtoviy and Mertins2016), for example, find adverse incentive effects of participation that presumably were triggered by negative reciprocity. It has been, however, an open empirical question how volunteers respond to the possibility of a majority vote on what the funds generated are used for.
Following self-determination theory, and in contrast to standard economic theory, we expect both treatments, feedback and vote, to significantly increase volunteers’ average performance (measured in number of cards produced) compared to the control group. Our rich data set makes it possible to take the heterogeneity among the volunteers (Dunn et al. Reference Dunn, Chambers and Hyde2016) into account—their varying levels of enjoyment in doing the task, their competitiveness, their solidarity with the charity. Given the literature on differences in preferences (see e.g., Niederle and Vesterlund Reference Niederle and Vesterlund2007; Croson and Gneezy Reference Croson and Gneezy2009), we expect to see that the treatments work differently for (1) male and female volunteers, (2) high and low task enjoyment volunteers, and (3) high and low competetive volunteers.
3 Experimental design
3.1 Field setting
Our charity partner, Kinderherzhilfe, is a nonprofit organization (NPO) run by the families of children with heart problems. It helps those children and their families with both monetary and non-monetary support. The organization’s social events are important for the children and their families to overcome stressful situations after medical treatments, and they allow the sharing of information. Furthermore, the organization regularly fulfills the wishes of affected children. To finance its projects, the organization raises money from donations, membership fees and commodities that it sells at flea markets and regional celebrations. For a fundraising event at the upcoming summer fair, we partnered with the NPO and agreed to host an event where a large group of volunteers would produce hand-colored greeting cards. The greeting cards had a mandala on the front page, a blank space in the middle for individual texts and the logo of the organization on the back of the card. The mandala was blank and had to be colored by hand, giving it an individual touch in order to raise more money through a higher selling price. We announced that there would be an event at which volunteers would do a one-time task for a good cause. To attract every potential volunteer, including the subgroup of supporters who did not enjoy coloring, we did not mention the specific task in the announcement. The upcoming event was announced at several lectures and was promoted as a special occasion to support a local charity with an urgent one-time task. Since the university is widely renowned for its focus on social studies subjects—such as social work, gerontology, and social services management—many charities regularly host events on the campus or recruit volunteers among a large number of socially-engaged students.
3.2 Work task
We took the opportunity that the charity planned to sell greeting cards at the upcoming summer fair to raise funds. The work task was prepared in cooperation with the charity to fit into the nature of the episodic event: it had to be temporary, feasible, and related to children. Also, the task had to be performed regardless of expertise or skills, since we expected volunteers with different backgrounds and sociodemographic characteristics to take part. While hand-colored cards are often used by NPOs to foster charitable giving, the task of preparing them had never been used by experimental economists. The task allowed us not only to measure the quantity of work done but also to control for the quality of the work.
The volunteering event attracted students from various fields. It had a friendly, informal atmosphere. The volunteers could leave whenever they wanted and knew that they would not get paid for the work task. Furthermore, it was made clear that it was a one-time event. After the volunteers entered the room, we assigned them a random treatment. The seating instructions were provided naturally, politely, and informally. By explaining that there were only three sets of premium pastel crayons that were essential for coloring pretty cards, we were able to allocate them into three treatment groups of similar size.Footnote 6
In the beginning, a member of the charity welcomed the participants and gave a short introduction. During the coloring event, each volunteer got two handouts and one questionnaire. The first sheet, Handout 1 (see Fig. 7 in Appendix), introduced the event, promised anonymity provided an individual supporter number to each participant, and included a small survey that asked about the respondents’ previous knowledge about the charity (1 item) and willingness to support it (5 items). We gathered the information in the survey to ensure that no unobserved factors would bias the potential treatment effects. In the next step, the member of the charity promoted the organization’s mission and goals, showing some pictures from previous activities and campaigns. Emphasizing that volunteers are supporting a good cause has recently been shown to be a significant positive determinant of their motivation to perform well (Carpenter and Gong Reference Carpenter and Gong2016; Jeworrek and Mertins Reference Jeworrek and Mertins2019b).
3.3 Treatments
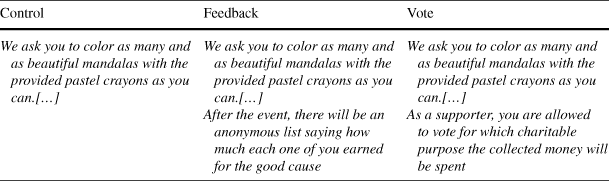
When the oral introduction ended, Handout 2 was distributed. It summarized the purpose of the event and introduced the task as well as the information that 100% of the money raised would be spent on charitable projects (see Fig. 8 in Appendix). It also announced that the charity needs the help of the present volunteers to color as many and as beautiful cards as possible because the NPO planned to sell them at the forthcoming summer fair using a pay-what-you-want mechanism. Handout 2 also contained treatment texts which varied in one sentence only.
In the control treatment, no further information was given. In the feedback treatment, we announced that the individual selling results—the amount of money that each person’s cards sold for would be published on a webpage some days later anonymously. We wanted to test whether the promise of feedback would increase volunteers’ performance. Since the results were anonymous and therefore private, the setting minimized image concerns and image motivation (Ariely et al. Reference Ariely, Bracha and Meier2009; Goette et al. Reference Goette, Stutzer and Frey2010); in other words, coloring more mandalas in order to be more liked or respected by others should play no decisive role. In the vote treatment, volunteers were given the right to vote for the purpose on which the money they raised would be spent. People could choose between the purposes by ticking the respective box: organizing a barbecue, sponsoring a family holiday, printing flyers, fulfilling children’ wishes, or buying toys for the cardiology ward of the local hospital.Footnote 7 In Table 1 we show the different treatment texts in direct comparison.
Table 1 Treatments
|
Control |
Feedback |
Vote |
|---|---|---|
|
We ask you to color as many and as beautiful mandalas with the provided pastel crayons as you can.[…] |
We ask you to color as many and as beautiful mandalas with the provided pastel crayons as you can.[…] After the event, there will be an anonymous list saying how much each one of you earned for the good cause |
We ask you to color as many and as beautiful mandalas with the provided pastel crayons as you can.[…] As a supporter, you are allowed to vote for which charitable purpose the collected money will be spent |
Volunteers had plenty of time to read Handout 2, which included the treatment texts, while student helpers distributed the blank greeting cards. After the pastel crayons were handed out, the coloring session started. Whenever volunteers finished drawing a card, they could take another one from a pile in front of them. The drawing session went smoothly and uninterruptedly. After forty-five minutes, we thanked all the participants. Subsequently, a group of students asked the volunteers to complete a questionnaire for an ongoing research seminar.Footnote 8 This questionnaire included items on individuals’ demographics (age, gender), task enjoyment, and competitiveness (see Fig. 9 in Appendix for the exact wording).Footnote 9 At the end, we collected all materials, sorted by individual participant.
3.4 Quality
The cards’ quality was likely to differ between volunteers: They could use up to 80 different colors. Some volunteers used a wide color spectrum, while others used just one crayon per card. Besides, the color intensity could be varied through pressure, and the colors could be mixed with a tiny drop of water or oil for some special effects.
To assess the quality of the cards, we used two different approaches. First, we asked three research assistants not involved in the conduct of the experiment to independently assess the subjective quality of each card by rating the subjective overall impression on a scale from 1 (“moderate”) to 5 (“very handsome”). The average rating from the three assessments gave us a subjective quality evaluation for each card. Then we calculated the averages over all cards per volunteer to get one subjective quality indicator per individual.Footnote 10 This variable is called rating. Second, we asked research assistants to assess every card based upon two characteristics: colors, the number of colors used; and areas, the number of areas colored. This resulted in two separate measures per card. Again, we calculated the averages over all cards per volunteer to get two objective quality indicators per individual. For an impression about differences in card quality, see Fig. 1.
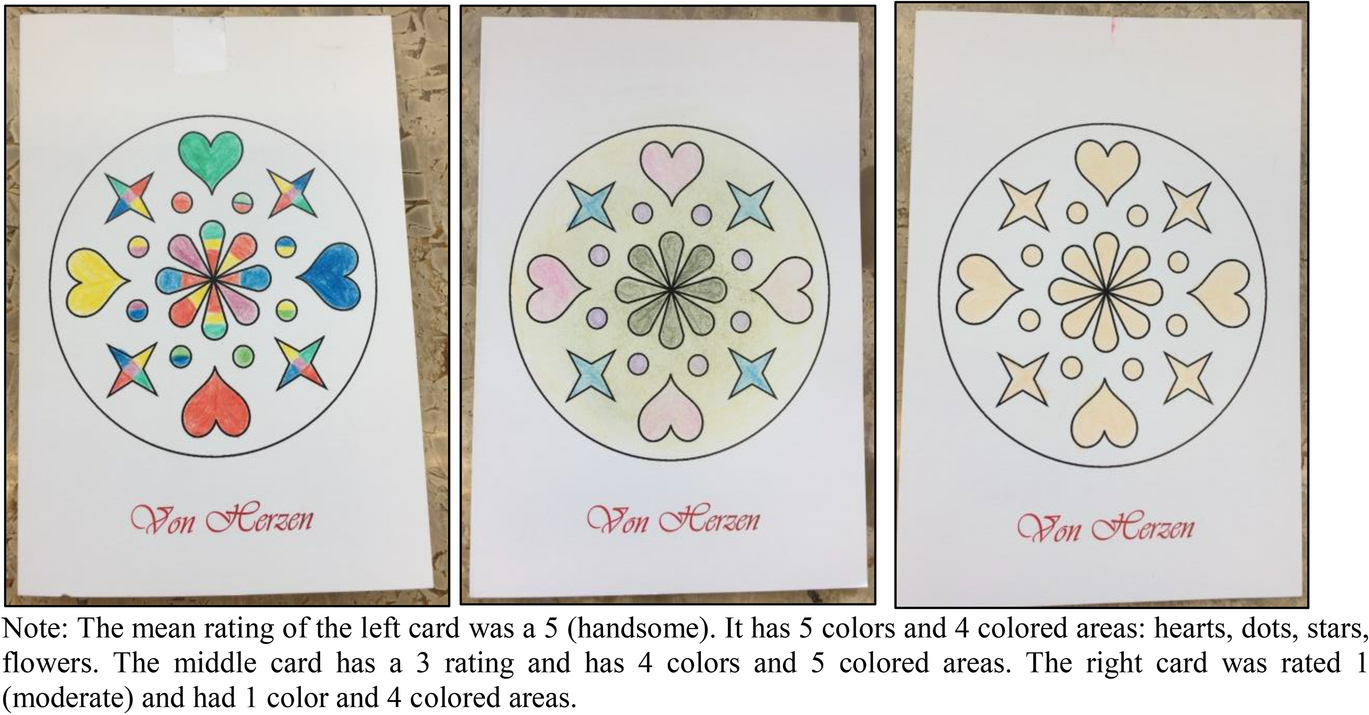
Fig. 1 Examples of differences in individuals’ quality indicators
3.5 Selling
Four days after the coloring event, the summer fair took place. The selling booth of the charity was decorated with posters and retractable banners introducing the charity (see Fig. 2). The greeting cards were hung in random order on washing lines to ensure that customers could compare them and choose their favorite. It was announced that the greeting cards were being sold to support cardiac children and their families and that one hundred percent of the money raised would be used for children’ wishes (as chosen by the majority of volunteers’ votes). Buyers were allowed to pay as much or as little as they wished for the cards (pay-what-you-want). We noted not only the price, but also the sales rank.Footnote 11 From time to time, the placement of the cards hanging on the washing lines was randomly changed. The selling variables sold cards, sales rank, and sales (each per individual) were again calculated at the volunteer level and used as three additional quality indicators in our analysis.Footnote 12
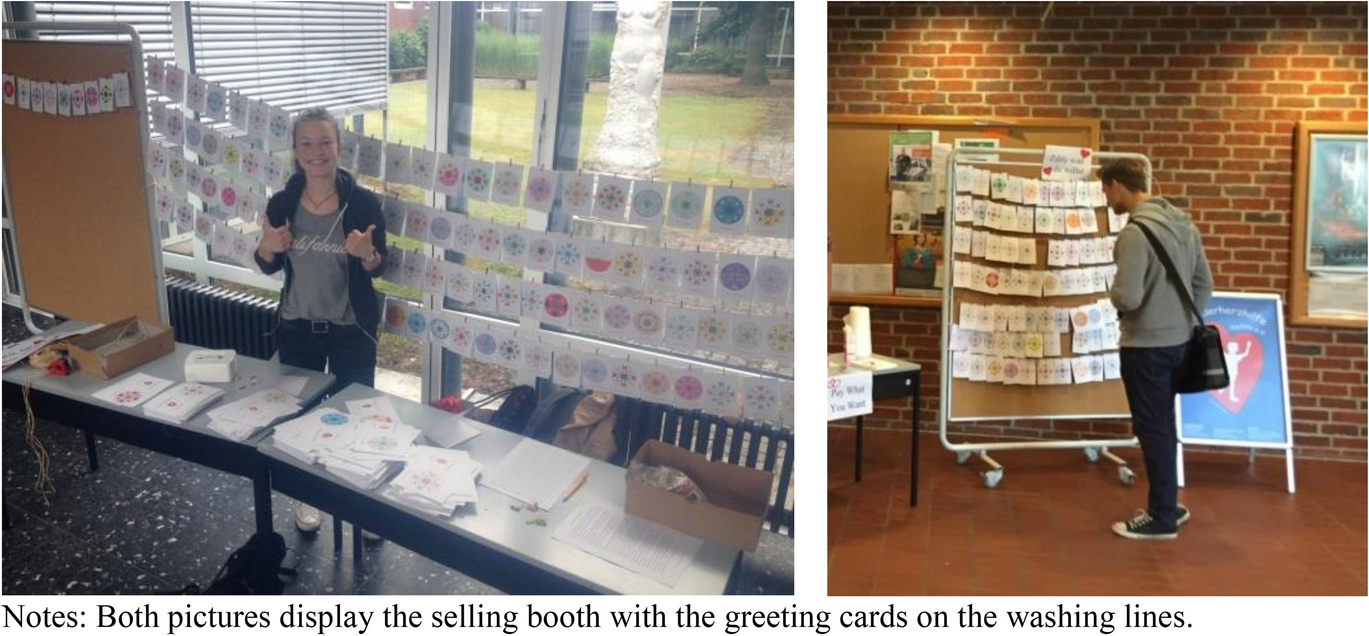
Fig. 2 Selling booth
Two weeks later, the results were presented to all volunteers through a public posting. We showed the realized donations per individual, anonymized by showing the supporter number next to the amount raised. Further, it was revealed that the money would be spent on individual children’ wishes (the outcome of the vote). Figure 3 summarizes the chronology of events in the field experiment.
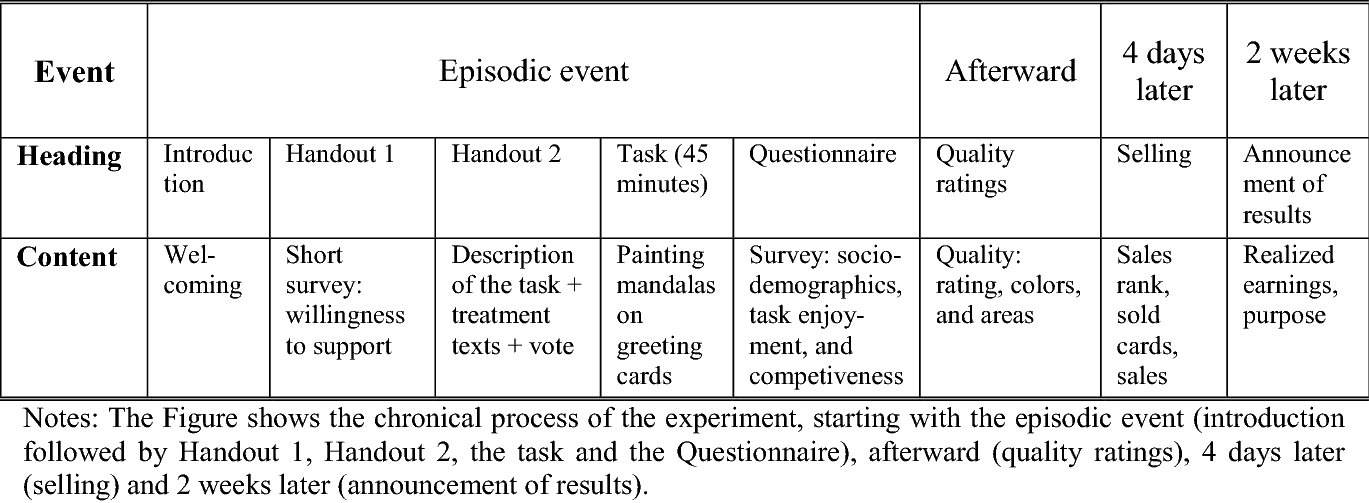
Fig. 3 Chronology of events
4 Results
4.1 Descriptive statistics
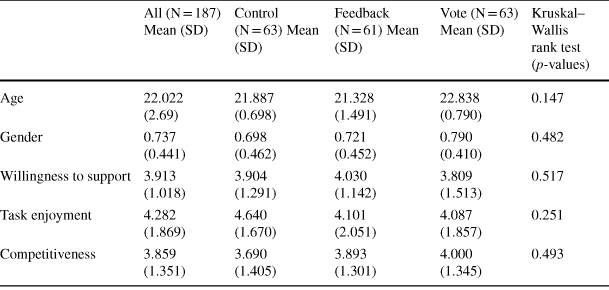
In total, 187 volunteers participated in the episodic volunteering event. Table 2 summarizes the descriptive statistics. Volunteers’ ages ranged from 18 to 37 (mean = 22.02, SD = 2.69) and 73.6 percent were female. Most of them were majoring in social services (social work, management of social services, gerontology). Accordingly, our sample reflects not only the population of the local student body but also a composition common for episodic events (Hustinx and Lammertyn Reference Hustinx and Lammertyn2003; Dunn et al. Reference Dunn, Chambers and Hyde2016). The volunteers colored a total of 667 greeting cards, with individual performance differences ranging from zero to ten. The median of colored cards per volunteer was three, and the average was 3.56 cards (SD = 1.71). About half the cards (n = 324) were sold at the summer fair with an average price of 1.13 € per card (min = 0.20 €, max = 10.00 €).Footnote 13 From 80 percent of the volunteers, the charity sold at least one card, while the number of sold cards per volunteer ranged from zero to seven.
Table 2 Descriptive statistics on volunteers’ characteristics
|
All (N = 187) Mean (SD) |
Control (N = 63) Mean (SD) |
Feedback (N = 61) Mean (SD) |
Vote (N = 63) Mean (SD) |
Kruskal–Wallis rank test (p-values) |
|
|---|---|---|---|---|---|
|
Age |
22.022 (2.69) |
21.887 (0.698) |
21.328 (1.491) |
22.838 (0.790) |
0.147 |
|
Gender |
0.737 (0.441) |
0.698 (0.462) |
0.721 (0.452) |
0.790 (0.410) |
0.482 |
|
Willingness to support |
3.913 (1.018) |
3.904 (1.291) |
4.030 (1.142) |
3.809 (1.513) |
0.517 |
|
Task enjoyment |
4.282 (1.869) |
4.640 (1.670) |
4.101 (2.051) |
4.087 (1.857) |
0.251 |
|
Competitiveness |
3.859 (1.351) |
3.690 (1.405) |
3.893 (1.301) |
4.000 (1.345) |
0.493 |
Gender is a dummy variable with 1 = female
Most of the volunteers did not know the charity beforehand. On a Likert scale from 1 (disagree completely) to 7 (agree completely) with the statement “I’m familiar with Kinderherzhilfe,” the mean value was 1.6 (SD = 1.31) and 75% chose “1.” Although only a few volunteers had heard about the charity beforehand, many volunteers showed up to support the event. This finding is in line with former research by Cnaan and Handy (Reference Cnaan and Handy2005) and Hyde et al. (Reference Hyde, Dunn, Scuffham and Chambers2014) who found that spontaneous interest in an opportunity to support an unknown charity is typical for episodic volunteers. This turns out to be the case in our field setting as well, since despite the low popularity of the charity, nearly 60% of volunteers chose 6 or 7 for the statement “Supporting children with cardiac problems is important to me” (mean = 5.65, SD = 1.32).
When asked about their willingness to support the charity, a majority expressed willingness to donate money (mean = 3.7, SD = 1.71) and time (mean 3.8, SD = 1.76), and most of them also said they were willing to promote the charity among friends (mean = 4.9, SD = 1.57) and strangers (mean = 3.6, SD = 1.8). We combine the item on their knowledge about the charity and the five items about their support readiness to the variable willingness to support (Cronbach’s alpha = 0.71). Also, we combine the three items from the Questionnaire asking for volunteers’ task enjoyment (Cronbach’s alpha = 0.88) and four questions on volunteers’ competitiveness (Cronbach’s alpha = 0.77). On average, volunteers’ task enjoyment was 4.28 (SD = 1.87) and competitiveness 3.86 (SD = 1.35). Regarding the random allocation into the treatments, the p-values of the Kruskal–Wallis rank tests for differences between the treatment groups (last column of Table 2) suggest no significant differences in volunteers’ age, gender, willingness to support, task enjoyment, or competitiveness.
4.2 Treatment differences
Our main interest is the analysis of potential treatment effects on volunteers’ performance. According to the conceptual framework, we test whether an increase in autonomous motivation through individual feedback provision and the opportunity of voting for the beneficial purpose leads to an increase in performance.
We find large treatment differences in the quantity of work done. In control, volunteers colored an average of 2.81 greeting cards, while volunteers in feedback and vote colored 3.84 and 4.06, respectively (see Fig. 4). This means that volunteers in the feedback group colored 36.5% more cards and those in vote 44.6% more, than did those in control. The pairwise comparisons between control and feedback as well as control and vote yield statistically and economically relevant differences, with p < 0.0001.Footnote 14
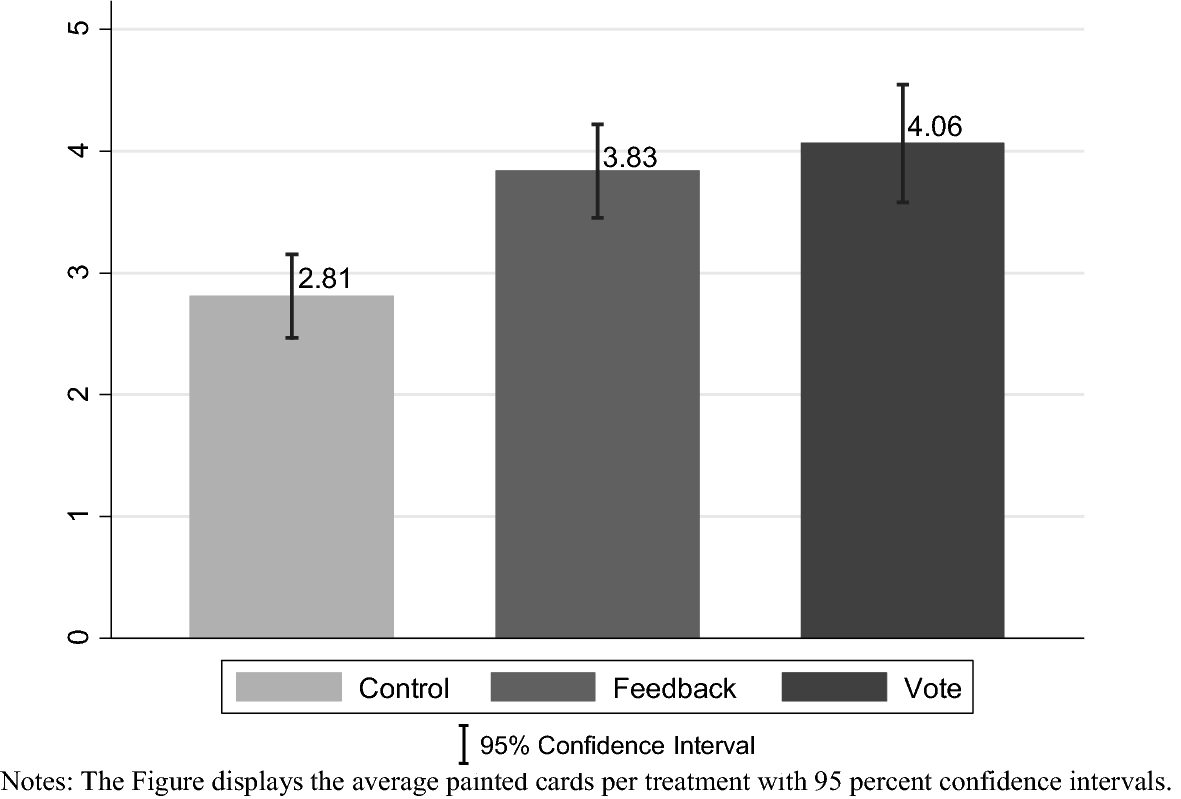
Fig. 4 Treatment differences in total colored cards
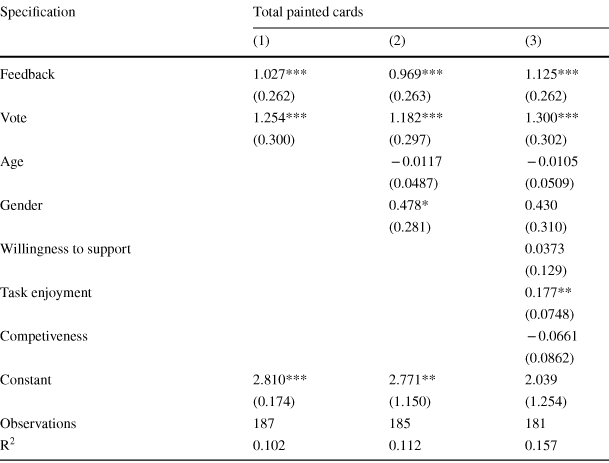
We run three OLS regressions (Table 3) to control for different variables which were taken from Handout 1 and the Questionnaire. In Column 1, we replicate the results from the non-parametric tests. In Column 2 we add two sociodemographic controls with age and gender, while Column 3 additionally adds volunteers’ willingness to support, task enjoyment, and competitiveness.Footnote 15 In any of the specifications, we observe highly significant treatment differences for both feedback and vote. The findings are completely robust when including any control variables, and the effects are sizeable and economically relevant.
Table 3 Main regressions
|
Specification |
Total painted cards |
||
|---|---|---|---|
|
(1) |
(2) |
(3) |
|
|
Feedback |
1.027*** |
0.969*** |
1.125*** |
|
(0.262) |
(0.263) |
(0.262) |
|
|
Vote |
1.254*** |
1.182*** |
1.300*** |
|
(0.300) |
(0.297) |
(0.302) |
|
|
Age |
− 0.0117 |
− 0.0105 |
|
|
(0.0487) |
(0.0509) |
||
|
Gender |
0.478* |
0.430 |
|
|
(0.281) |
(0.310) |
||
|
Willingness to support |
0.0373 |
||
|
(0.129) |
|||
|
Task enjoyment |
0.177** |
||
|
(0.0748) |
|||
|
Competiveness |
− 0.0661 |
||
|
(0.0862) |
|||
|
Constant |
2.810*** |
2.771** |
2.039 |
|
(0.174) |
(1.150) |
(1.254) |
|
|
Observations |
187 |
185 |
181 |
|
R2 |
0.102 |
0.112 |
0.157 |
The table presents ordinary least square estimates of treatment effects. In all five reported columns from (1)—(5), the dependent variable is the total amount of colored cards. The reference group in all estimations is Control. Willingness to support is the mean of six questions concerning someone’s willingness to support the charity. Task enjoyment is also a mean of three task-related enjoyment statements of drawing mandalas. Competiveness is the mean of four related statements Robust standard errors are displayed in parentheses
***p < 0.01, ** p < 0.05, **p < 0.1
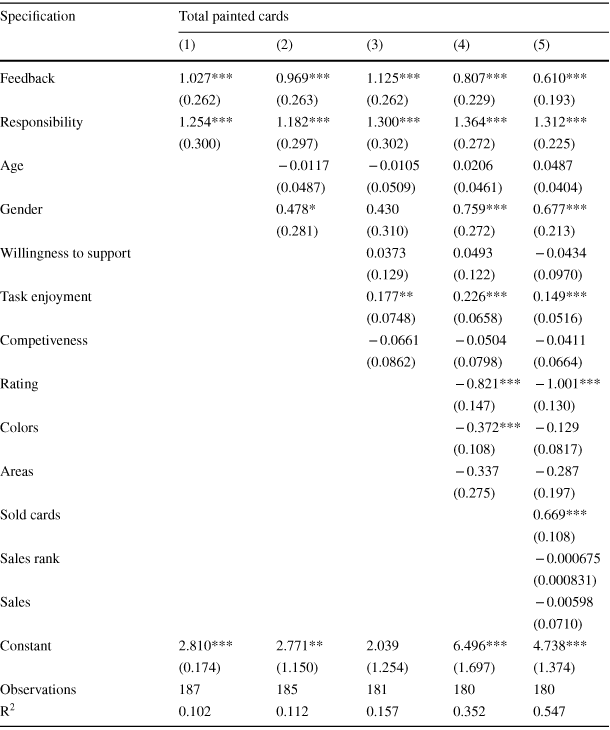
While age does not affect the number of colored cards, we find that women drew on average 0.47 to 0.79 cards more than men. Task enjoyment is a significant predictor of volunteers’ performance in terms of quantity in all specifications. This underlines the importance of task characteristics for individuals’ motivation. Volunteers’ willingness to support and their level of competitiveness are not predictors for their performance, probably because participants were highly homogenous in this regard. Although the quantity and quality outcomes are highly correlated (and endogenous), we find robust treatments effects on quantity when we control for the quality measures rating, colors, areas, sold cards, sales rank and sales (see Table 8 in Appendix). Thus, feedback and vote motivate volunteers to color more cards but do not crowd out beautifulness. Further, the treatments not only provided positive effects for the upper end of the performance distribution (outliers pull the effect); a further analysis reveals significant effects for all levels (see Fig. 5). As seen in the distribution of total colored cards, every volunteer in the treatment group colored on average one card more than their control group counterparts. This finding holds also true when analyzing the top performers in each treatment (fourth quartile). Top-performing volunteers in feedback and vote outperformed those in control in terms of quantity (p = 0.0251 and p = 0.0077) and rating (p-value = 0.0013 and p = 0.0223).
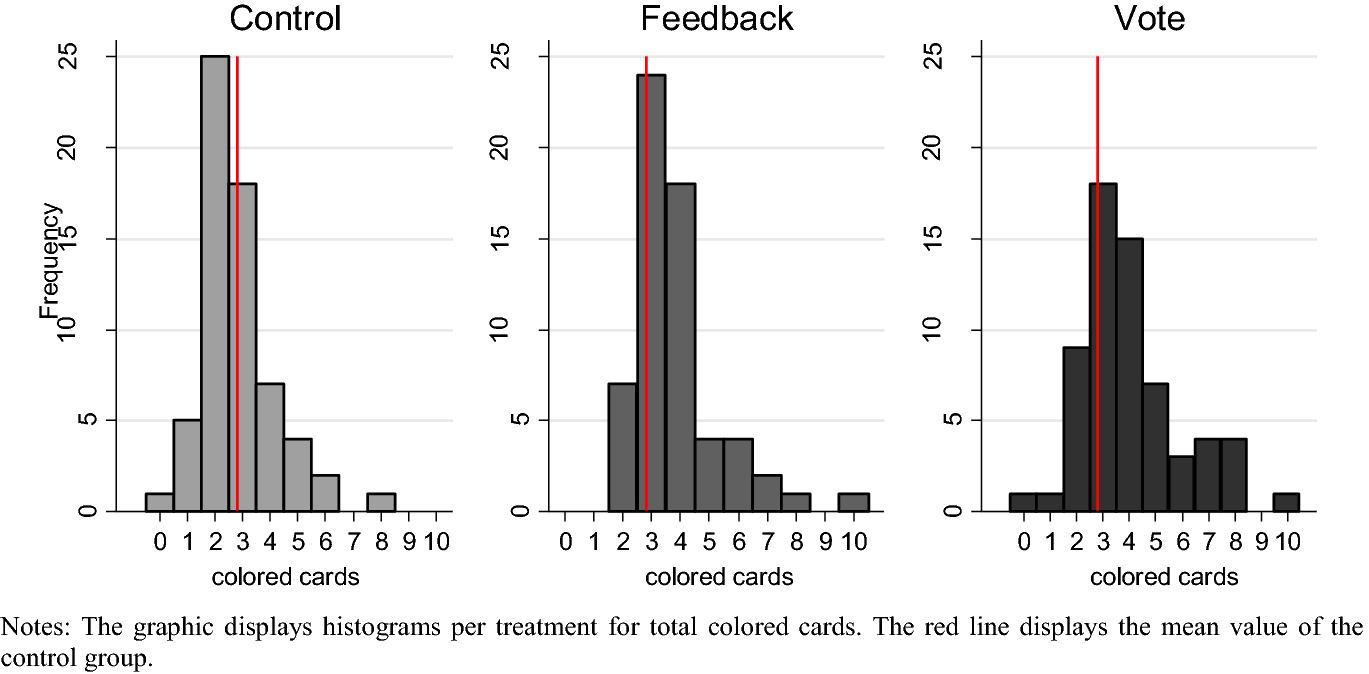
Fig. 5 Histogram of colored cards by treatment
Last, we analyze if the treatments differ in their effectiveness. A Wald test for equal coefficients shows no significant differences among treatments regarding effectiveness. In the subsequent section, we will analyze the effectiveness of both instruments for specific subgroups.
4.3 Further results
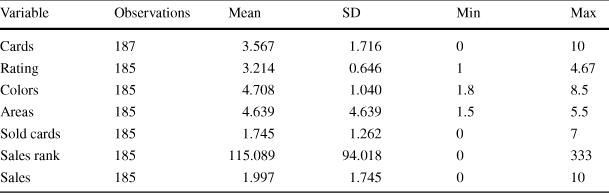
In this section, we take a closer look at the six quality measures– rating, colors, areas, sold cards, sales rank, sales—and then at the heterogeneous treatment effects. Among our volunteers, we observe large individual differences in all quality measures. Take, for example, the subjective quality measure rating, ranging from 1 to 5. While some volunteers reached the maximum rating of 5 with almost every card, others reached only averages of around 1.5. Similarly, the charity sold seven cards from some volunteers and zero from others. We report additional descriptive statistics in Table 9 in Appendix.
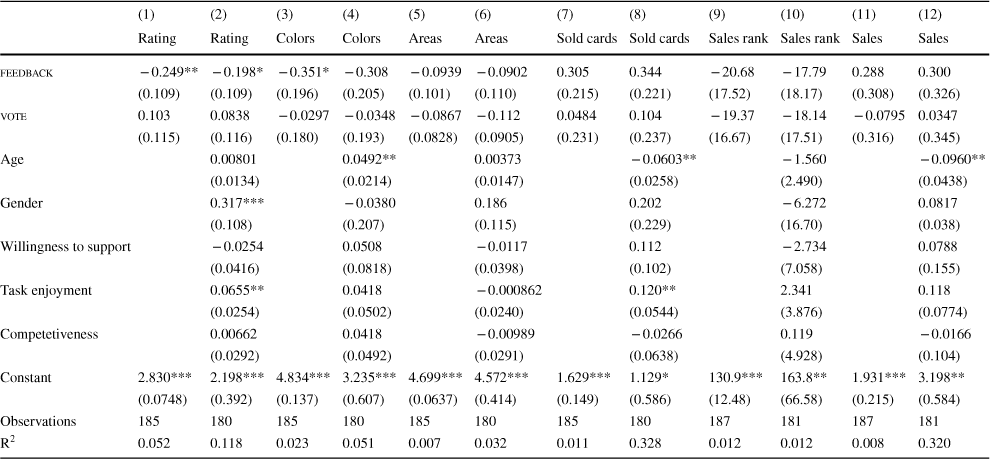
Despite the large individual heterogeneity, we do not observe reliable treatment differences regarding any of the six quality measures. Figure 6 shows the treatment comparisons with bar graphs including 95% confidence intervals for each quality indicator. It does not suggest that one treatment clearly outperforms any other in terms of quality output. As a robustness check, we run multivariate regressions on all quality measures with the standard set of control variables: age, gender, willingness to support, task enjoyment, and competitiveness (see Table 10 in Appendix). There is a small positive impact of vote on sold cards and sales; and feedback on rating but the results are far from conclusive.
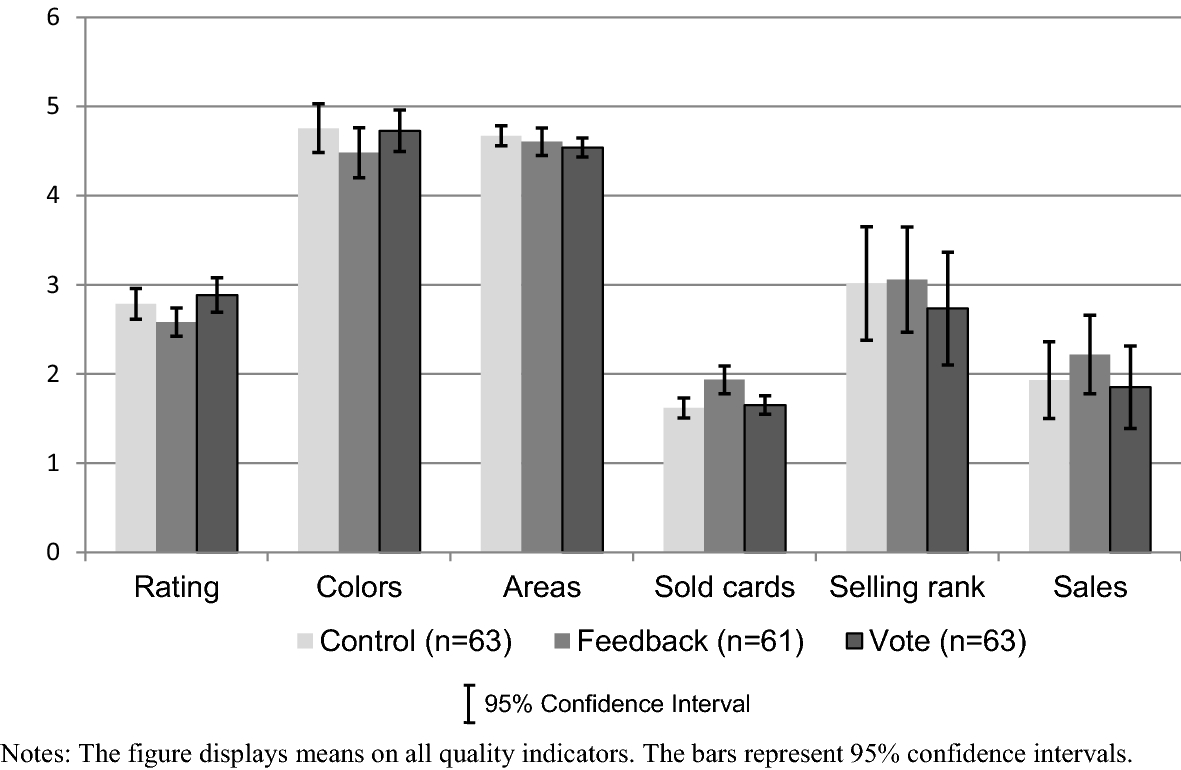
Fig. 6 Treatment differences for cards quality measures
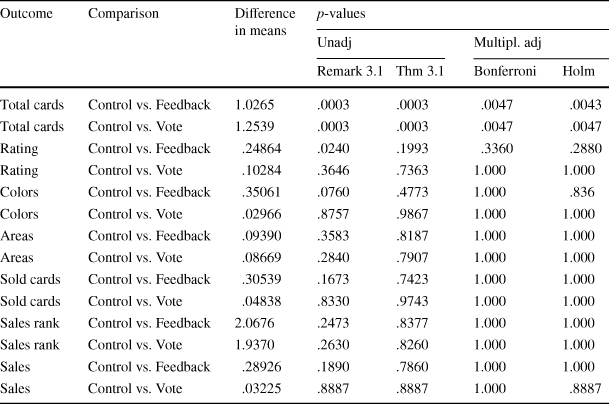
However, once we analyze this large set of outcome variables, we should consider multiple hypothesis testing. The multiple hypothesis testing (List et al. Reference List, Shaikh and Xu2019) confirms the former results. There are no noteworthy differences in quality (see Table 11 in Appendix). Thus, the sizeable increase in quantity has not crowded out the quality of produced cards.
For an adequate understanding of the following discussion of results, note the Pearson correlations between total colored cards and rating (− 0.2431, p = 0.0009), colored areas (− 0.2285, p = 0.0018), colors used (− 0.2864, p = 0.0001), cards sold (0.5284, p = 0.000), and sales (0.5096, p = 0.000). A trade-off between more cards, on the one hand, and prettier cards, on the other hand, is intuitive. Coloring prettier cards needs more patience and is, therefore, more time-consuming. On the one hand, more beautiful cards with more colors and/or more colored areas should result in fewer cards but may generate higher earnings. On the other hand, if a person colors more cards, there may be a higher chance that those cards will be bought and thereby increase the higher absolute earnings. Despite these considerations, while volunteers in both the feedback and vote treatment conditions colored significantly more cards, their cards were judged no less beautiful than those of the individuals in the control group.
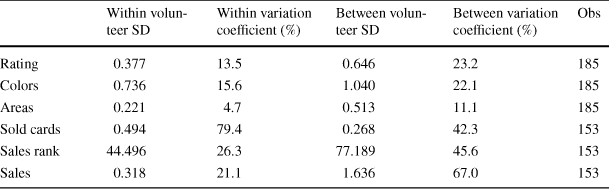
We argue that the volunteers’ coloring skills were fixed short-term and could not be increased as easily as could the effort that the volunteers exerted, especially given the tradeoff between quantity and quality. As a result, we assume that volunteers expressed their motivation through an increase in quantity rather than through an increase in quality. This argument is supported by further statistical findings. Table 4 shows standard deviations (SD) within volunteers (i.e. the differentiation between one person’s cards) and between volunteers (i.e. differentiation among different volunteers). First, the intrapersonal deviation is relatively small, with a coefficient below 25%. The intrapersonal rating deviates 0.377 points and the interpersonal rating 0.646 points. We find that the mean variation coefficient of each volunteer within his or her own cards is smaller than the coefficient comparing the volunteers together. Along with the relatively small within deviations at all and the statistically equal deviations between treatments seen in Table 4, this finding supports the assumption of fixed personal drawing skills.
Table 4 Quality differences within and between volunteers
|
Within volunteer SD |
Within variation coefficient (%) |
Between volunteer SD |
Between variation coefficient (%) |
Obs |
|
|---|---|---|---|---|---|
|
Rating |
0.377 |
13.5 |
0.646 |
23.2 |
185 |
|
Colors |
0.736 |
15.6 |
1.040 |
22.1 |
185 |
|
Areas |
0.221 |
4.7 |
0.513 |
11.1 |
185 |
|
Sold cards |
0.494 |
79.4 |
0.268 |
42.3 |
153 |
|
Sales rank |
44.496 |
26.3 |
77.189 |
45.6 |
153 |
|
Sales |
0.318 |
21.1 |
1.636 |
67.0 |
153 |
The table presents standard deviations within and between volunteers as well as variation coefficients for the quality measures rating, colors, areas, sold cards, sales rank, and sales
An alternative explanation might lie in the inefficient use of working time by volunteers in the control group. More precisely, the difference in total colored cards may not come from differences in coloring speed but rather in boredom resistance. In other words, volunteers in the control group might have taken more breaks and stopped working before the official end. However, there are a few facts that contradict this argument. First, we did not observe abandonment or unwillingness among any individual. Volunteers seem to have colored continuously and no-one left the coloring session ahead of time. Second, volunteers reported high enjoyment during the task (see Table 2). If volunteers in the control group had gotten bored drawing mandalas, we would have seen a difference in their task enjoyment, which is not the case. From this data, our observations, and informal conversations after the event, differences in levels of enjoyment during the event can be ruled out. Third, volunteers arrived and stayed voluntarily at the event to support the good cause. It would have been unusual for volunteers to stop working during a charity event.
It is reasonable to assume that volunteers colored each mandala as beautifully as they could, and every time their personal threshold was reached, they started a new card instead of improving the former one. Therefore, the absence of quality effects is likely not a result of a lack of motivation but rather a lack of skill which ended in an optimization strategy to color as many cards as possible with a fixed quality standard. Thus, with the trade-off between more versus better cards, it is not appropriate to expect improvements in terms of quality. However, the task has its merits, above all the fact that it is a very common task in nonprofit organizations. Letting volunteers color mandalas requires little to no explanation and can be done by nearly everyone. It is easy to implement and a large number of people can perform it at once. The quantitative output is easy to measure and meaningful for both producer and charity. Further, coloring cards is not affected by the pitfall of teamwork. As quality differs largely between volunteers, but only slightly within them, it is nonetheless crucial to control for beauty.
While we found that both feedback and vote instruments motivate volunteers to color significantly more cards in the aggregate, we do not know yet how different types of volunteers react to the treatments. This is intriguing from a scientific and practical point of view because volunteers’ motivations and characteristics are typically highly heterogeneous (Clary et al. Reference Clary, Snyder, Ridge, Copeland, Stukas, Haugen and Miene1998; Hyde et al. Reference Hyde, Dunn, Scuffham and Chambers2014),Footnote 16 and thus they likely vary in their susceptibility towards the prospect of getting performance feedback or participation opportunities in the decision-making process. We focus on three different subgroups since many studies suggest gender (Croson and Gneezy Reference Croson and Gneezy2009), task enjoyment (Ryan and Deci Reference Ryan and Deci2000) and competitiveness (Niederle and Vesterlund Reference Niederle and Vesterlund2007) to be relevant impact factors for individual motivation.
4.3.1 Gender
Gender is an interesting variable for at least two reasons. First, imagine any episodic volunteering event where participants show up mostly unannounced and spontaneously (Cnaan and Handy Reference Cnaan and Handy2005). A nonprofit organization faces the challenge of having scarce information about episodic volunteers and this makes categorizations in different groups even harder than for regular volunteers. Among the visible characteristics, gender is easily accessible and therefore suggests itself as an appropriate candidate. Second, there is a large literature on gender differences in preferences (see, for example, the extensive literature review by Croson and Gneezy Reference Croson and Gneezy2009).Footnote 17 Therefore, it cannot be ruled out that in general, women and men react differently to the present motivational tools.
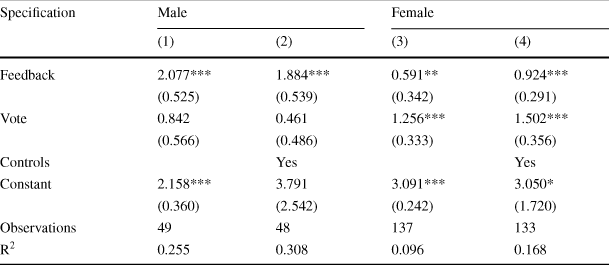
In our voluntary work situation, we observe significant gender differences in quantity (p = 0.028, two-sided Mann Whitney U-test), with women coloring more cards (mean = 3.7) than men (mean = 3.1). At the same time, we also observe significant gender differences in quality, at a 5 percent level, for most measures—rating, sold cards, sales rank, sales—with women outperforming men. To test whether men and women react similarly to feedback and vote, we estimate the main regressions separately for both subgroups with and without controls (see Table 5). Here we see that feedback has an economically and statistically significant effect on the quantity of work done by male volunteers, while the effect on females’ motivation is smaller and less significant. The effect among men is sizeable: the prospect of getting feedback motivated the men in that treatment to color 4.2 cards, twice as many as the men in the control group colored. Even taking into account control variables, the coefficient tells us that the treatment results in an increase of 1.8 cards, which is equivalent to an increase of approximately 50 percent compared to the average man in the control group. Note that the promised feedback was provided anonymously, so explanations related to social image concerns (Ariely et al. Reference Ariely, Bracha and Meier2009) should not play a role in here. Rather, men are known to be more susceptible to competitive environments than women (Gneezy and Rustichini Reference Gneezy and Rustichini2000, Niederle and Vesterlund Reference Niederle and Vesterlund2007). This finding is in line with previous findings from a lab-in-the-field experiment (Wozniak et al. Reference Wozniak, Harbaugh and Mayr2016) showing that men seem more interested in comparing themselves to others, in that they are more likely than women to pay for costly feedback.Footnote 18
Table 5 Heterogeneous treatment effects by gender
|
Specification |
Male |
Female |
||
|---|---|---|---|---|
|
(1) |
(2) |
(3) |
(4) |
|
|
Feedback |
2.077*** |
1.884*** |
0.591** |
0.924*** |
|
(0.525) |
(0.539) |
(0.342) |
(0.291) |
|
|
Vote |
0.842 |
0.461 |
1.256*** |
1.502*** |
|
(0.566) |
(0.486) |
(0.333) |
(0.356) |
|
|
Controls |
Yes |
Yes |
||
|
Constant |
2.158*** |
3.791 |
3.091*** |
3.050* |
|
(0.360) |
(2.542) |
(0.242) |
(1.720) |
|
|
Observations |
49 |
48 |
137 |
133 |
|
R2 |
0.255 |
0.308 |
0.096 |
0.168 |
The table presents ordinary least squares estimates of treatment effects. In all stated columns from (1)–(4), the dependent variable is the total number of colored cards. Controls include age, willingness to support, task enjoyment, competitiveness. The reference group is control. Robust standard errors are displayed in parentheses
***p < 0.01, ***p < 0.05, *p < 0.1
Intriguingly, we find somewhat reversed effects regarding vote. The opportunity to participate in the decision-making process motivates women to color 1.256 more cards, or 1.5 when adding control variables. The performance increase, however, is only observable among women and not men (the coefficient is neither economically nor statistically significant). This effect is in line with findings which suggest that women particularly like their opinion to make a difference (Konrad et al. Reference Konrad, Kramer and Erkut2008). More research is needed to improve our understanding on gender differences of performance-enhancing effects based on self-determined work. These results suggest a potential pathway for nonprofit practitioners to manage their volunteers more effectively by providing gender-specific treatments.
4.3.2 Task enjoyment
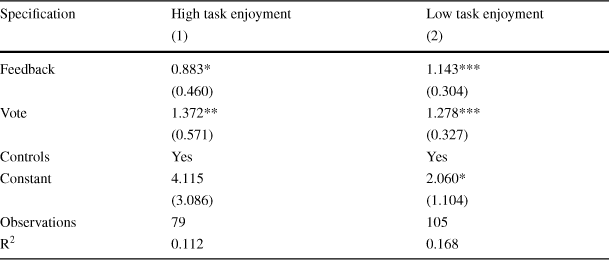
The tasks at episodic events are often simple, repetitive, and monotonous. This constitutes an important prerequisite at episodic events where large numbers of heterogeneous supporters should be able to participate directly or after a very short training period. Besides, if there are different tasks with high and low levels of impact and autonomy,Footnote 19 a recent literature review (Hyde et al. Reference Hyde, Dunn, Bax and Chambers2016) suggests that the tasks with higher degrees of impact, responsibility, and decision making are usually assigned to the regular volunteers who are familiar with the organization and who are expected to be more reliable. The drawback of simple, repetitive tasks is obvious: they are not likely to motivate volunteers in and of themselves. The reverse is likely true for interesting tasks, so we expected that the individual subjective perception of task enjoyment would be positively correlated with the quantity measure of performance, which proved to be the case (p = 0.022). We split the participants into two groups using a median split on task enjoyment (1–7), with the median being 4.667.Footnote 20 The mean of colored cards among the low-enjoyment volunteers is 3.34, while the high-enjoyment individuals colored an average of 3.85 cards. Table 6 reveals that feedback and vote both have strong effects on low-enjoyment volunteers, while the high-enjoyment volunteers responded to vote but less to feedback. For the latter, the regression coefficient diminishes and is barely significant. Interpreting this result yields some relevant management implications. Every supervisor, whether of paid staff or volunteers, faces the issue of workers having low task enjoyment. The results suggest that empowerment may constitute a simple way to increase engagement for people with low enjoyment performing them.
Table 6 Heterogeneous treatment effects by task enjoyment
|
Specification |
High task enjoyment |
Low task enjoyment |
|---|---|---|
|
(1) |
(2) |
|
|
Feedback |
0.883* |
1.143*** |
|
(0.460) |
(0.304) |
|
|
Vote |
1.372** |
1.278*** |
|
(0.571) |
(0.327) |
|
|
Controls |
Yes |
Yes |
|
Constant |
4.115 |
2.060* |
|
(3.086) |
(1.104) |
|
|
Observations |
79 |
105 |
|
R2 |
0.112 |
0.168 |
The table presents ordinary least squares estimates of treatment effects. In both specifications (1) and (2), the dependent variable is the total amount of colored cards. The reference group is control. The levels of task enjoyment were divided into two groups at the median. Controls included were age, gender, willingness to support, competitiveness. Robust standard errors are displayed in parentheses
***p < 0.01, **p < 0.05, **p < 0.1
4.3.3 Competitiveness
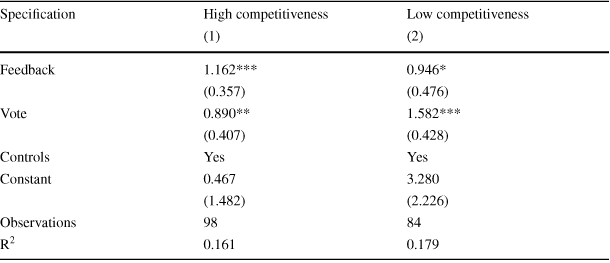
Although competitiveness in voluntary tasks is not the primary focus of NPO managers, its massive influence on workplace behavior has been impressively shown (Niederle and Vesterlund Reference Niederle and Vesterlund2007; Buser et al. Reference Buser, Niederle and Oosterbeek2014; Banuri et al. Reference Banuri, Dankova and Keefer2018). Differences in competitiveness can explain differences in education, labor market outcomes, and scientific careers (Buser et al. Reference Buser, Niederle and Oosterbeek2014), and it is also strongly correlated with the effectiveness of relative performance feedback (Banuri et al. Reference Banuri, Dankova and Keefer2018). We estimate the standard regression with total colored cards as the dependent variable once with the upper median bound of competitiveness, and once with the lower median bound (see Table 7). While feedback has a strong positive effect on total colored cards for volunteers with above-median competitiveness (coefficient = 1.162, p = 0.002), it does motivate volunteers with low levels of competitiveness less (coefficient = 0.031). Hence, the results suggest that granting costless individual performance feedback is useful in the aggregate among volunteers, and especially among those with high levels of competitiveness.
Table 7 Heterogeneous treatment effects by competiveness
|
Specification |
High competitiveness |
Low competitiveness |
|---|---|---|
|
(1) |
(2) |
|
|
Feedback |
1.162*** |
0.946* |
|
(0.357) |
(0.476) |
|
|
Vote |
0.890** |
1.582*** |
|
(0.407) |
(0.428) |
|
|
Controls |
Yes |
Yes |
|
Constant |
0.467 |
3.280 |
|
(1.482) |
(2.226) |
|
|
Observations |
98 |
84 |
|
R2 |
0.161 |
0.179 |
The table presents ordinary least squares estimates of treatment effects. In both specifications (1) and (2), the dependent variable is the total amount of colored cards. The reference group is control. The levels of competitiveness were divided at the median into two groups. Controls included were age, gender, willingness to support, task enjoyment. Robust standard errors are displayed in parentheses
***p < 0.01, **p < 0.05, **p < 0.1
5 Conclusion
In this paper, we study the performance, and the potential boosters thereof, of unpaid volunteers using a collaborative field experiment. This is novel from at least three perspectives. First, we focus on actual work behavior. This is an important outcome among paid workers and has been researched accordingly. But despite its importance for the functioning of the nonprofit sector, focusing on the actual work performance of volunteers is surprisingly rare in research and practice alike. Second, we derive inspiration from self-determination theory on how to support volunteers’ intrinsic motivation, given that volunteering is too different from paid labor to apply classic monetary or non-monetary incentive schemes: those schemes either tend to fail in such a context or are simply inappropriate for volunteers. The treatments we implemented are novel in research and easy to put into practice even in the presence of budget constraints. Third, we can reliably investigate causal effects by using a randomized and controlled environment, a rather unusual approach when studying volunteer motivation. The randomized control is not compromised by the costs of artificial environment (Harrison and List Reference Harrison and List2004; List Reference List2011) as our experiment was conducted in cooperation with a charity under natural circumstances.
Both the feedback and vote treatments boost performance. We observe a large increase in the average total number of colored cards per volunteer through the announcement of individual performance feedback (36.5%) and an even larger increase (44.6%) through the opportunity to vote on the donation use. As their implementation does not involve significant costs, but raises average performance without any decrease in quality, both instruments are effective for charities in managing their human resources more efficiently. The rich data set allowed us to investigate treatment effects on volunteers’ individual performance and subgroup effects. Our study is only a first attempt at using a natural field experiment to investigate heterogeneous treatment effects in the domain of volunteer motivation. If the preliminary results are confirmed by further studies, nonprofit organizations can motivate their volunteers more efficiently by providing specific treatments to different target groups. Our results suggest that the men significantly increase their performance by the opportunity to receive individual performance feedback, while the women increase their effort when provided with the opportunity to vote. Importantly, the treatments did not affect the quality of the work, even though the volunteers were encouraged to maximize both quantity and quality. The information that customers would pay whatever they wished for the greeting cards made it clear that it was very important to produce beautiful cards. In fact, every worker seems to have had a specific quality level that could not be exogenously manipulated, at least not by the instruments that we examined, and obviously not in the short run.
While episodic volunteers were the focus of this paper, it would be exciting to study these instruments among highly intrinsically motivated paid workers—for example in geriatric care, in youth health, in nursing, or in services for homeless people, addicted people, or pregnant women. Further, the tools proved to be particularly effective for a workforce with low task enjoyment, so our findings could also be relevant for paid one-time or casual jobs where commitment to the organization is low and people tend to be less intrinsically motivated—for example in classic day labor (e.g. in developing countries and/or the manufacturing industry), in digital day labor (Uber, Mechanical Turk, Foodora), or in agricultural labor.
To the best of our knowledge, this is the first paper providing field experimental evidence on work motivation in an episodic volunteering setting. We conclude that more research is needed to understand work motivation in volunteerism, as “one swallow doesn’t make a summer” (Maniadis et al. Reference Maniadis, Tufano and List2014). We left out some related topics that deserve similar attention, such as how particular arrangements and work characteristics of voluntary settings affect volunteers’ willingness to engage in an episodic event, or the probability that people will volunteer regularly for a social organization to maintain the social capital of our society.
Funding
Open Access funding enabled and organized by Projekt DEAL.. Open Access funding enabled and organized by Projekt DEAL.
Appendix
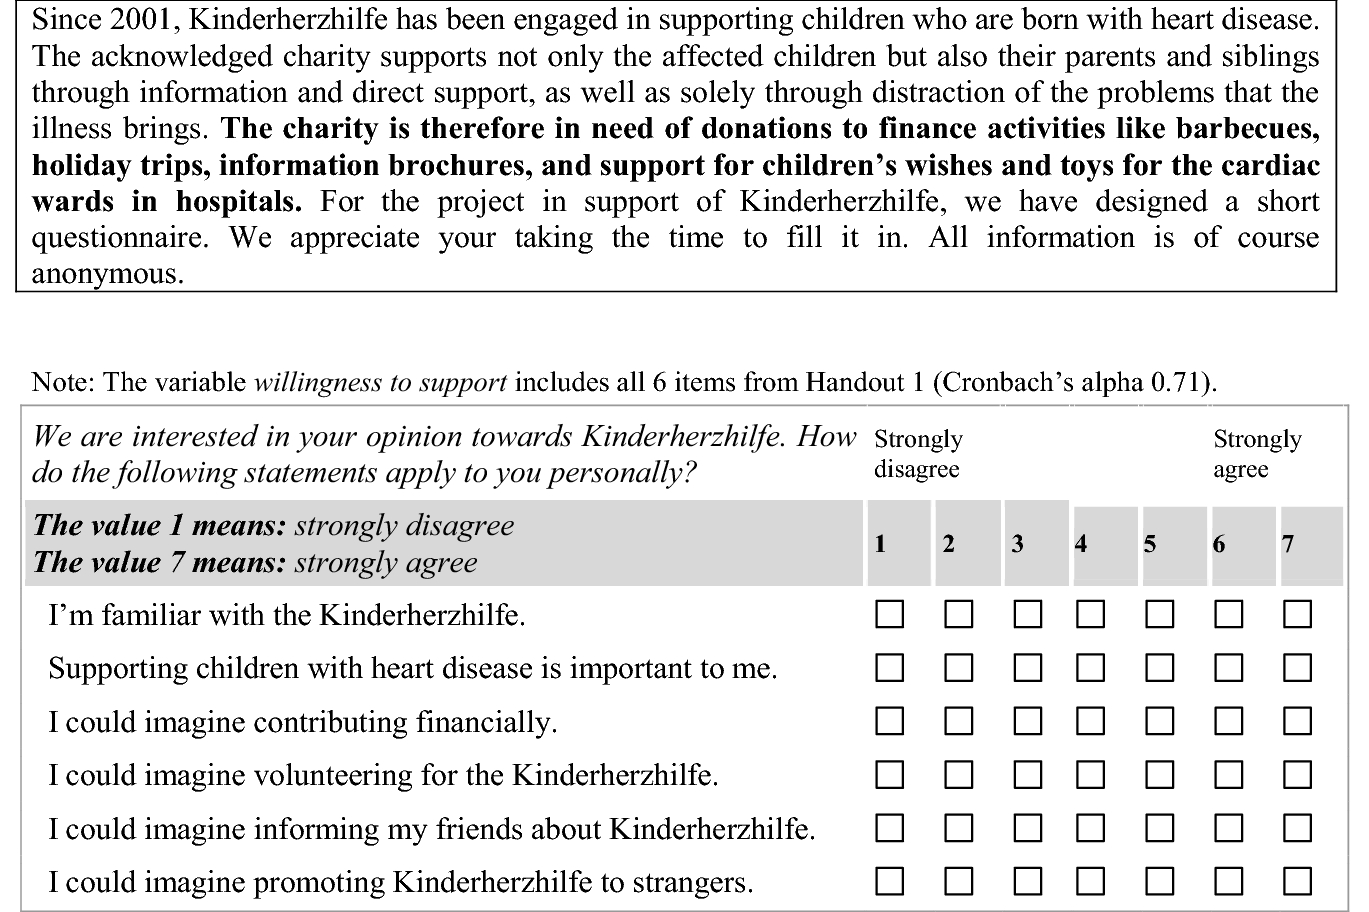
Fig. 7 Handout I (english version)
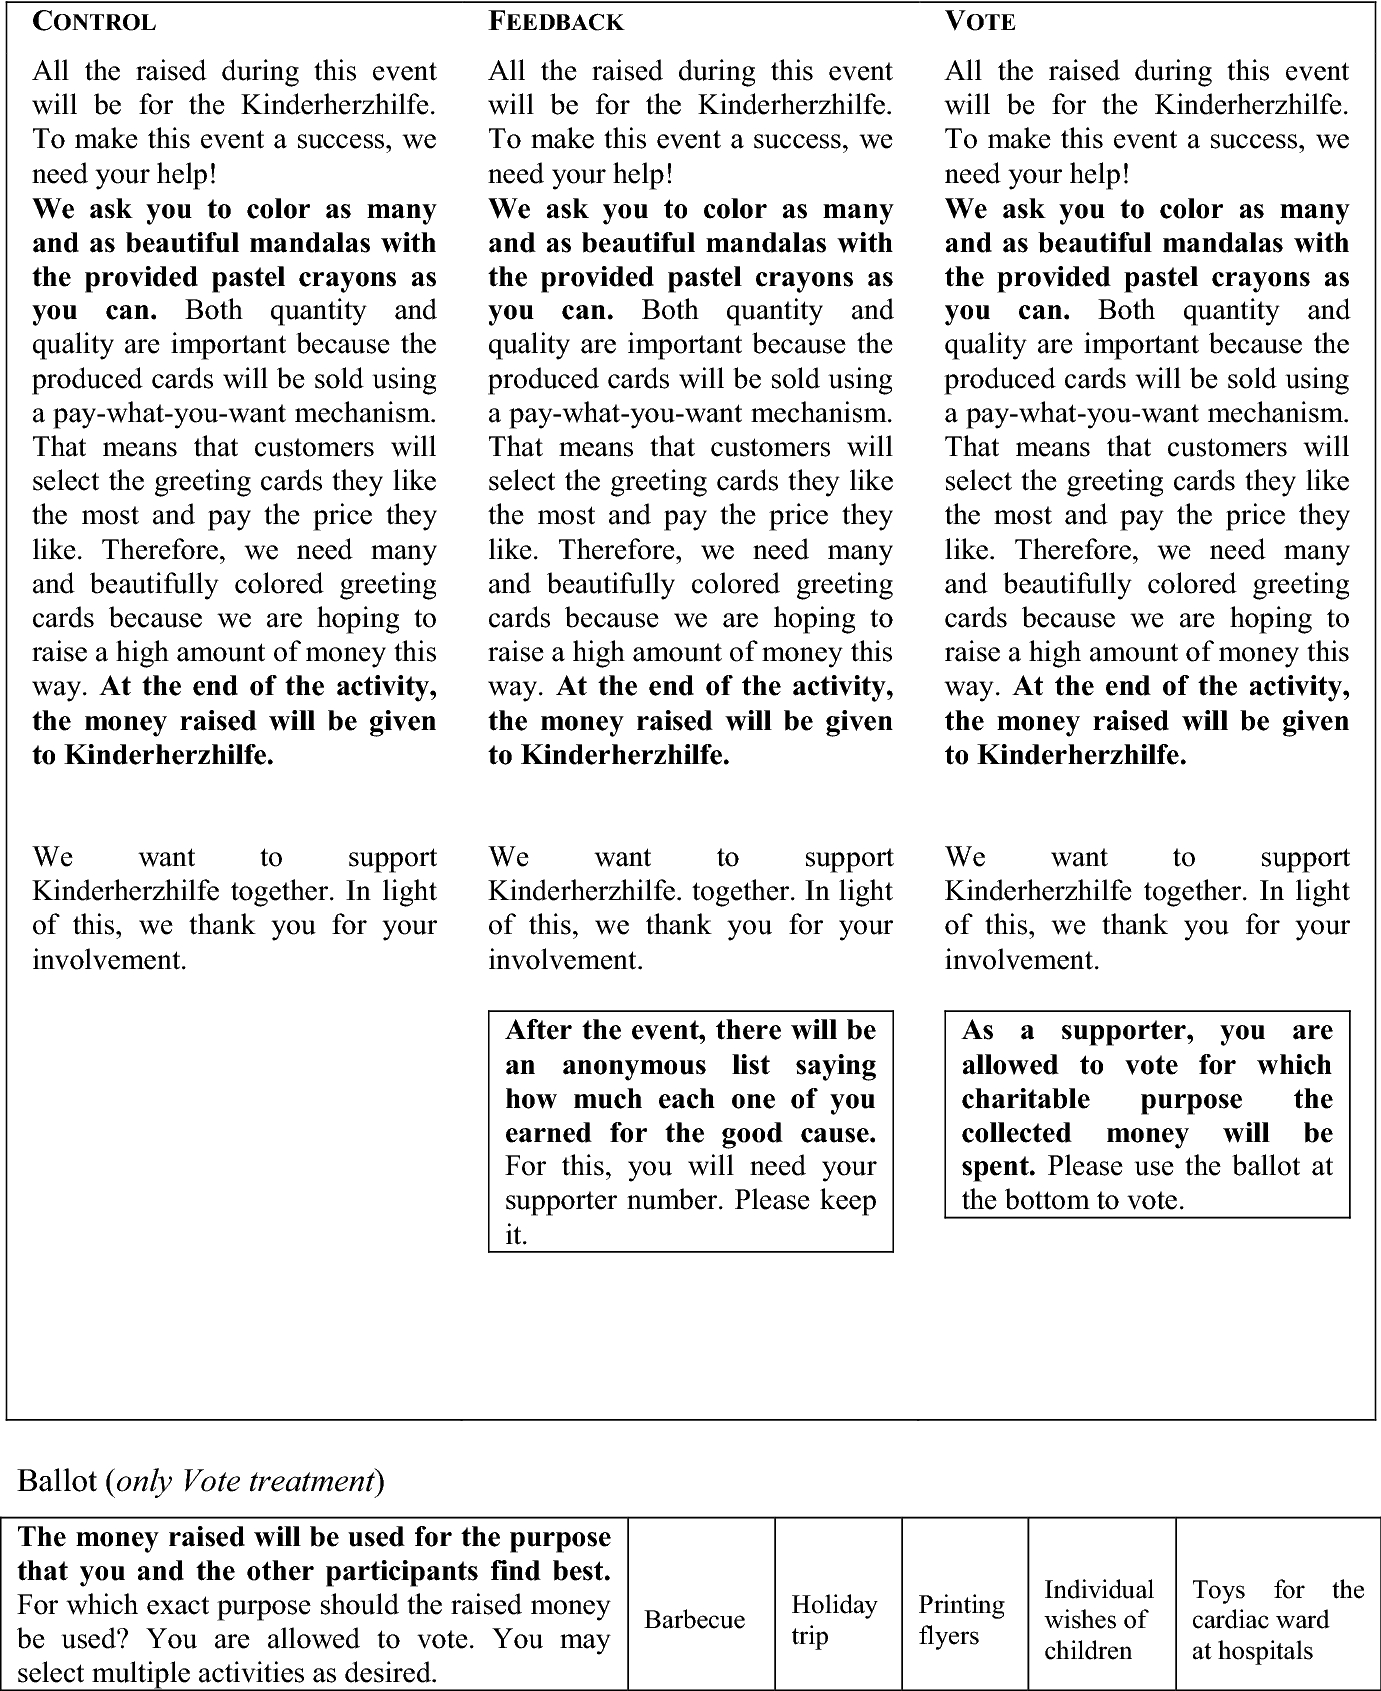
Fig. 8 Handout II—treatments (english version)
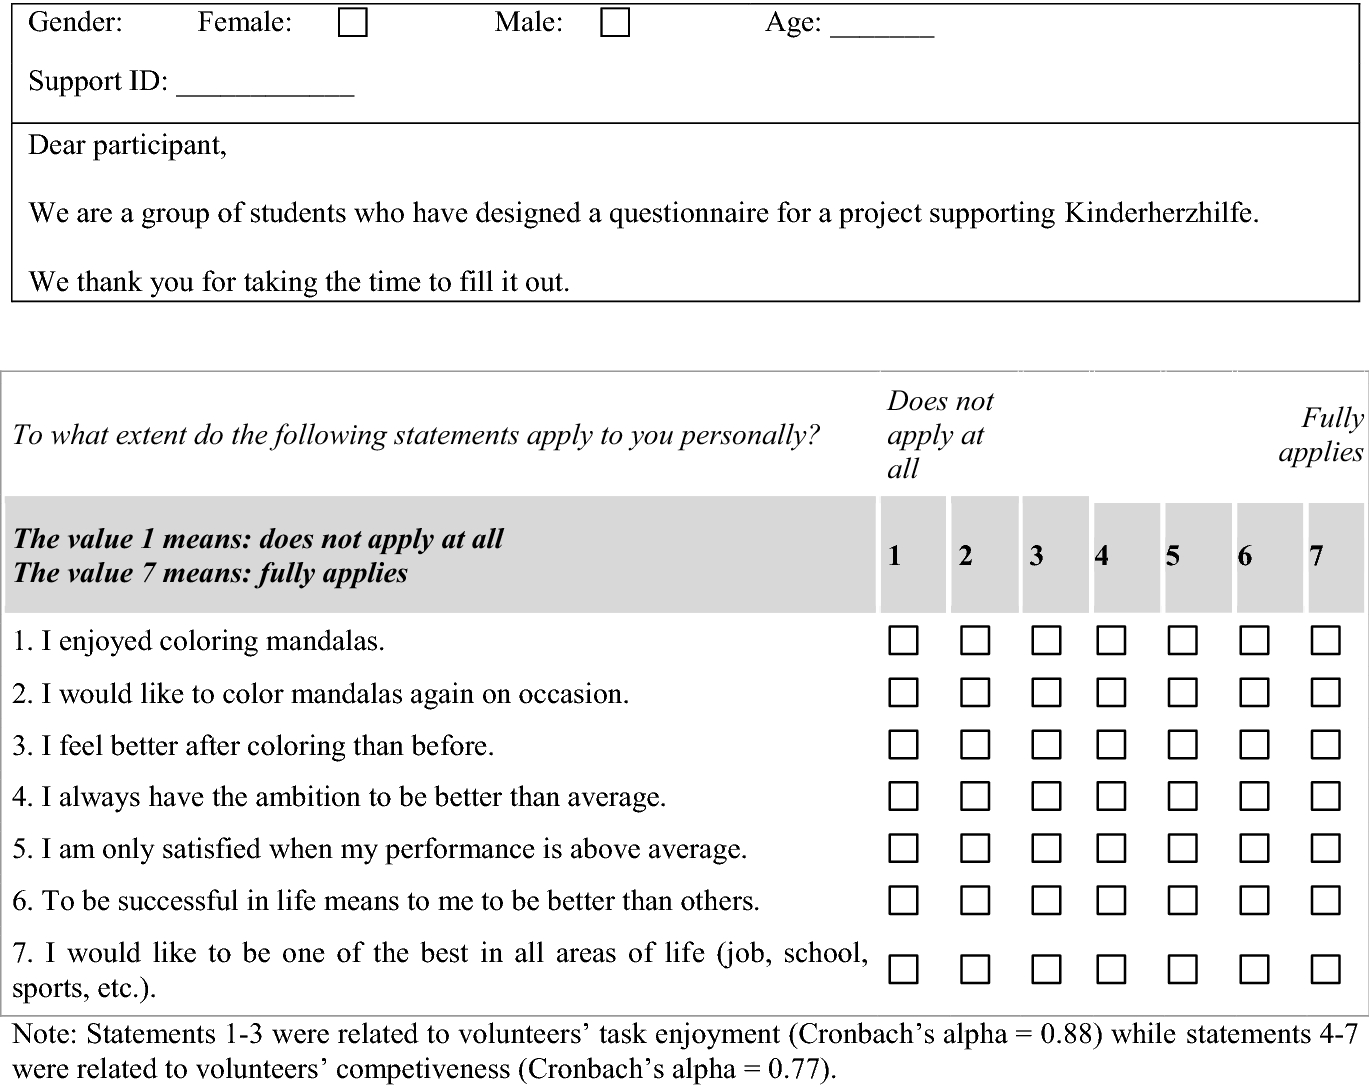
Fig. 9 Questionnaire
Table 8 Main regressions (with quality measures)
|
Specification |
Total painted cards |
||||
|---|---|---|---|---|---|
|
(1) |
(2) |
(3) |
(4) |
(5) |
|
|
Feedback |
1.027*** |
0.969*** |
1.125*** |
0.807*** |
0.610*** |
|
(0.262) |
(0.263) |
(0.262) |
(0.229) |
(0.193) |
|
|
Responsibility |
1.254*** |
1.182*** |
1.300*** |
1.364*** |
1.312*** |
|
(0.300) |
(0.297) |
(0.302) |
(0.272) |
(0.225) |
|
|
Age |
− 0.0117 |
− 0.0105 |
0.0206 |
0.0487 |
|
|
(0.0487) |
(0.0509) |
(0.0461) |
(0.0404) |
||
|
Gender |
0.478* |
0.430 |
0.759*** |
0.677*** |
|
|
(0.281) |
(0.310) |
(0.272) |
(0.213) |
||
|
Willingness to support |
0.0373 |
0.0493 |
− 0.0434 |
||
|
(0.129) |
(0.122) |
(0.0970) |
|||
|
Task enjoyment |
0.177** |
0.226*** |
0.149*** |
||
|
(0.0748) |
(0.0658) |
(0.0516) |
|||
|
Competiveness |
− 0.0661 |
− 0.0504 |
− 0.0411 |
||
|
(0.0862) |
(0.0798) |
(0.0664) |
|||
|
Rating |
− 0.821*** |
− 1.001*** |
|||
|
(0.147) |
(0.130) |
||||
|
Colors |
− 0.372*** |
− 0.129 |
|||
|
(0.108) |
(0.0817) |
||||
|
Areas |
− 0.337 |
− 0.287 |
|||
|
(0.275) |
(0.197) |
||||
|
Sold cards |
0.669*** |
||||
|
(0.108) |
|||||
|
Sales rank |
− 0.000675 |
||||
|
(0.000831) |
|||||
|
Sales |
− 0.00598 |
||||
|
(0.0710) |
|||||
|
Constant |
2.810*** |
2.771** |
2.039 |
6.496*** |
4.738*** |
|
(0.174) |
(1.150) |
(1.254) |
(1.697) |
(1.374) |
|
|
Observations |
187 |
185 |
181 |
180 |
180 |
|
R2 |
0.102 |
0.112 |
0.157 |
0.352 |
0.547 |
The table presents ordinary least square estimates of treatment effects. In all five reported columns from (1)—(5), the dependent variable is the total amount of colored cards. The reference group in all estimations is control. Willingness to support is the mean of six questions concerning someone’s willingness to support the charity. Task enjoyment is also a mean of three task-related enjoyment statements of drawing mandalas. Competiveness is the mean of four related statements Rating is the mean assessment of volunteers’ painted cards. Colors is the amount of volunteer’ mean colors used per mandala. Areas is the mean amount of areas someone colored per mandala. Sold cards is the number of total sold cards. Sales rank is the ordering in which the cards got sold. Sales are the total earnings volunteers earned for their painted cards. Robust standard errors are displayed in parentheses
***p < 0.01, ** p < 0.05, **p < 0.1
Table 9 Additional descriptive statistics
|
Variable |
Observations |
Mean |
SD |
Min |
Max |
|---|---|---|---|---|---|
|
Cards |
187 |
3.567 |
1.716 |
0 |
10 |
|
Rating |
185 |
3.214 |
0.646 |
1 |
4.67 |
|
Colors |
185 |
4.708 |
1.040 |
1.8 |
8.5 |
|
Areas |
185 |
4.639 |
4.639 |
1.5 |
5.5 |
|
Sold cards |
185 |
1.745 |
1.262 |
0 |
7 |
|
Sales rank |
185 |
115.089 |
94.018 |
0 |
333 |
|
Sales |
185 |
1.997 |
1.745 |
0 |
10 |
All values are calculated at the individual level
Table 10 Quality regressions with and without controls
|
(1) |
(2) |
(3) |
(4) |
(5) |
(6) |
(7) |
(8) |
(9) |
(10) |
(11) |
(12) |
|
|---|---|---|---|---|---|---|---|---|---|---|---|---|
|
Rating |
Rating |
Colors |
Colors |
Areas |
Areas |
Sold cards |
Sold cards |
Sales rank |
Sales rank |
Sales |
Sales |
|
|
feedback |
− 0.249** |
− 0.198* |
− 0.351* |
− 0.308 |
− 0.0939 |
− 0.0902 |
0.305 |
0.344 |
− 20.68 |
− 17.79 |
0.288 |
0.300 |
|
(0.109) |
(0.109) |
(0.196) |
(0.205) |
(0.101) |
(0.110) |
(0.215) |
(0.221) |
(17.52) |
(18.17) |
(0.308) |
(0.326) |
|
|
vote |
0.103 |
0.0838 |
− 0.0297 |
− 0.0348 |
− 0.0867 |
− 0.112 |
0.0484 |
0.104 |
− 19.37 |
− 18.14 |
− 0.0795 |
0.0347 |
|
(0.115) |
(0.116) |
(0.180) |
(0.193) |
(0.0828) |
(0.0905) |
(0.231) |
(0.237) |
(16.67) |
(17.51) |
(0.316) |
(0.345) |
|
|
Age |
0.00801 |
0.0492** |
0.00373 |
− 0.0603** |
− 1.560 |
− 0.0960** |
||||||
|
(0.0134) |
(0.0214) |
(0.0147) |
(0.0258) |
(2.490) |
(0.0438) |
|||||||
|
Gender |
0.317*** |
− 0.0380 |
0.186 |
0.202 |
− 6.272 |
0.0817 |
||||||
|
(0.108) |
(0.207) |
(0.115) |
(0.229) |
(16.70) |
(0.038) |
|||||||
|
Willingness to support |
− 0.0254 |
0.0508 |
− 0.0117 |
0.112 |
− 2.734 |
0.0788 |
||||||
|
(0.0416) |
(0.0818) |
(0.0398) |
(0.102) |
(7.058) |
(0.155) |
|||||||
|
Task enjoyment |
0.0655** |
0.0418 |
− 0.000862 |
0.120** |
2.341 |
0.118 |
||||||
|
(0.0254) |
(0.0502) |
(0.0240) |
(0.0544) |
(3.876) |
(0.0774) |
|||||||
|
Competetiveness |
0.00662 |
0.0418 |
− 0.00989 |
− 0.0266 |
0.119 |
− 0.0166 |
||||||
|
(0.0292) |
(0.0492) |
(0.0291) |
(0.0638) |
(4.928) |
(0.104) |
|||||||
|
Constant |
2.830*** |
2.198*** |
4.834*** |
3.235*** |
4.699*** |
4.572*** |
1.629*** |
1.129* |
130.9*** |
163.8** |
1.931*** |
3.198** |
|
(0.0748) |
(0.392) |
(0.137) |
(0.607) |
(0.0637) |
(0.414) |
(0.149) |
(0.586) |
(12.48) |
(66.58) |
(0.215) |
(0.584) |
|
|
Observations |
185 |
180 |
185 |
180 |
185 |
180 |
185 |
180 |
187 |
181 |
187 |
181 |
|
R2 |
0.052 |
0.118 |
0.023 |
0.051 |
0.007 |
0.032 |
0.011 |
0.328 |
0.012 |
0.012 |
0.008 |
0.320 |
The table presents ordinary least square estimates for twelve regressions (six with and six without control variables) for the dependent variables rating, colors, areas, sold cards, sales rank, and sales
***p < 0.01, **p < 0.05, **p < 0.1
Table 11 Multiple hypothesis testing
|
Outcome |
Comparison |
Difference in means |
p-values |
|||
|---|---|---|---|---|---|---|
|
Unadj |
Multipl. adj |
|||||
|
Remark 3.1 |
Thm 3.1 |
Bonferroni |
Holm |
|||
|
Total cards |
Control vs. Feedback |
1.0265 |
.0003 |
.0003 |
.0047 |
.0043 |
|
Total cards |
Control vs. Vote |
1.2539 |
.0003 |
.0003 |
.0047 |
.0047 |
|
Rating |
Control vs. Feedback |
.24864 |
.0240 |
.1993 |
.3360 |
.2880 |
|
Rating |
Control vs. Vote |
.10284 |
.3646 |
.7363 |
1.000 |
1.000 |
|
Colors |
Control vs. Feedback |
.35061 |
.0760 |
.4773 |
1.000 |
.836 |
|
Colors |
Control vs. Vote |
.02966 |
.8757 |
.9867 |
1.000 |
1.000 |
|
Areas |
Control vs. Feedback |
.09390 |
.3583 |
.8187 |
1.000 |
1.000 |
|
Areas |
Control vs. Vote |
.08669 |
.2840 |
.7907 |
1.000 |
1.000 |
|
Sold cards |
Control vs. Feedback |
.30539 |
.1673 |
.7423 |
1.000 |
1.000 |
|
Sold cards |
Control vs. Vote |
.04838 |
.8330 |
.9743 |
1.000 |
1.000 |
|
Sales rank |
Control vs. Feedback |
2.0676 |
.2473 |
.8377 |
1.000 |
1.000 |
|
Sales rank |
Control vs. Vote |
1.9370 |
.2630 |
.8260 |
1.000 |
1.000 |
|
Sales |
Control vs. Feedback |
.28926 |
.1890 |
.7860 |
1.000 |
1.000 |
|
Sales |
Control vs. Vote |
.03225 |
.8887 |
.8887 |
1.000 |
.8887 |
The table presents p-values for two-sided comparisons of means according to the multiple hypothesis tests procedure of List et al. (Reference List, Shaikh and Xu2019)


 Open access