Tropical forest soils contain large stocks of C (Pan et al. Reference PAN, BIRDSEY, FANG, HOUGHTON, KAUPPI, KURZ, PHILLIPS, SHVIDENKO, LEWIS, CANADELL, CIAIS, JACKSON, PACALA, MCGUIRE, PIAO, RAUTIAINEN, SITCH and HAYES2011), and studies and models indicate that soil C storage may be vulnerable to changes in climate conditions (Cox et al. Reference COX, BETTS, JONES, SPALL and TOTTERDELL2000, Jenkinson et al. Reference JENKINSON, ADAMS and WILD1991). Knowledge of direct and indirect effects of precipitation on the C cycling and soil C storage of tropical forests has been derived from studies in mesic to wet gradients (Posadas & Schuur Reference POSADAS and SCHUUR2011, Schuuret al. Reference SCHUUR, CHADWICK and MATSON2001). Measurements on these gradients show that C storage increases with mean annual precipitation (MAP), but this trend is altered by excess precipitation. Despite seasonally dry tropical forests (SDTF) (i.e. forests with a mean annual precipitation of 250–2500 mm) occupying around 40% of the tropical forest area (Miles et al. Reference MILES, NEWTON, DEFRIES, RAVILIOUS, MAYL, BLYTH, KAPOS and GORDON2006), and consequently their effect on the interactions between land surface and atmosphere being potentially substantial, the potential effect of precipitation variability on biogeochemical processes in these ecosystems have not been studied as extensively as in the tropical moist forests. Here, we quantify the C pools in the litter layer and in topsoil of SDTF in a regional precipitation gradient of the Yucatan Peninsula, that have the advantage that most site conditions can be assumed to be relatively similar across the gradient (e.g. mean annual temperature, topography, rock material, soil type and vegetation type).
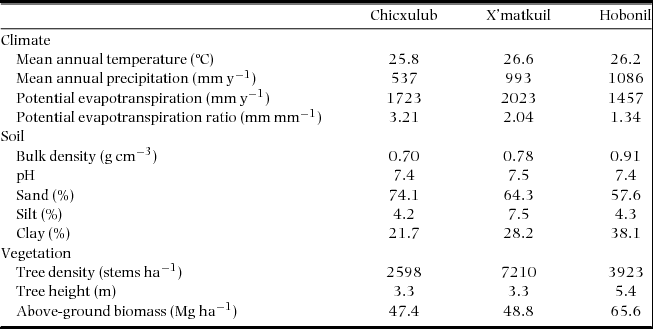
The study was carried out in south-eastern Mexico in three sites within the Yucatan Peninsula (Chicxulub, 21º14′N, 89º32′W; X'matkuil, 20º52′N, 89º36′W; and Hobonil, 20º00′N, 89º02′W) with different precipitation regimes (Table 1). The climate is hot and subhumid and would support either tropical dry or very dry forest in the Holdridge system (Holdridge et al. Reference HOLDRIDGE, GRENKE, HATHEWAY, LIANG and TOSI1971). Mean temperature across sites is around 26ºC. The averages of annual precipitation (MAP) and of annual potential evapotranspiration (PET), as well as the potential evapotranspiration ratio (i.e. PET/MAP ratio), differ considerably among sites (Table 1). The landscape consists of flat areas (less than 35 m asl). Soils (lithic rendolls) are mainly shallow and organic-rich and directly overlie weathered calcium carbonate (Shang & Tiessen Reference SHANG and TIESSEN2003). The predominant vegetation in the Yucatan Peninsula is SDTF in which mean canopy height is 3–5 m. Floristically, Leguminosae are the most important family in all studied sites. The whole of the Chicxulub and X'matkuil selected areas were previously used for Agave fourcroydes Lem. cultivation, and for slash-and-burn agriculture, whereas the Hobonil area was used for cattle ranching. All selected areas were abandoned approximately 40 y ago.
Table 1. General characteristics of the three study sites. Climate data from Servicio Meteorológico Nacional (personal communication), soil data from Roa-Fuentes (Reference ROA-FUENTES2013), and vegetation data from Roa-Fuentes et al. (Reference ROA-FUENTES, CAMPO and PARRA2012).

Three forest stands (5–14 km apart) were selected in each site and four plots (144 m2) per stand were established in March 2010. Plots were installed taking into account the similar elevation and slope, and with similar MAP. In addition, plot installation was carried out avoiding large variation in the vegetation structure and composition at the local scale. In each plot, dead fallen phytomass was sampled during the dry season (March 2010) and partitioned into fine-litter fraction (includes leaves, flowers, fruits and small twigs), and deadwood debris to include all woody residues deposited on the litter layer. Fine litter was collected in four 0.5-m2 subplots per plot. Fine-litter samples were selected to exclude all wood residues less than 5 mm in diameter. Deadwood debris was sampled using the planar-intersect technique (Kauffman et al. Reference KAUFFMAN, SANFORD, CUMMINGS, SAMPAIO and SALCEDO1993), and two planar intersects were established in each plot. The diameter was measured to all pieces of wood that intersected each sample plane. A subsample of wood was taken to the laboratory to determine the specific density. Four soil cores (5 cm in diameter) from the upper 10 cm of soil (surface horizon) were collected (March 2010) randomly in each plot, combined in the field and stored at 4 ºC until processing. When the soil was very shallow (< 10 cm in depth), the soil samples were collected up to rock contact. All soil samples were stored to 4 °C until they were processed. Roots in the upper soil profile (0–10 cm) were sampled using one micro-plot (1 m2) located in a corner of each plot, which was carefully excavated.
Soil samples were hand homogenized and sieved (to pass a 2-mm mesh) in the laboratory and a subsample was dried at constant weight for moisture determination. Fine roots (2 mm or less) were separated from soil samples. The remaining soil was used to measure organic C concentrations. Roots collected from micro-plots were separated on trays, collected with forceps and classified in size classes (4 mm diameter or less; > 4 to 10 mm; > 10 to 20 mm, and > 20 mm). Samples of fine litter, and samples for each size class of wood debris and roots were oven dried at 70 °C for 48 h. A subsample of each of these samples was milled and weighed to determine C concentrations. Carbon concentrations in fine litter, wood debris, root and soils were determined using an automatic C-analyser (SHIMADZU 5000A). Soil inorganic C concentration was estimated from carbonate concentration in samples; a subsample of 5 g of each soil sample was ground, sieved (No. 100), mixed with 50 ml of 0.5 N HCl and heated until boiling over 5 min. The mixture was filtered (No. 2) and the extracts were separated to an aliquot of 5 ml. Aliquots were mixed with two drops of phenolphthalein to titrate the remaining acid with 0.25 N of NaOH (van Reeuwijk Reference VAN REEUWIJK2002). Soil organic C concentration was determined from the difference between the total C concentration and the inorganic C concentration. All analyses were performed in duplicate samples.
The mean of each C pool was calculated for each forest stand, and these means were averaged to obtain the regional values. The resulting C masses in each pool, including three stands in each site, were analysed by one-way ANOVA. Thus, analysis of variance was based on three sites, each them included three forest stands. The honest significant difference (HSD) test was used to examine the effect of site on C pools on the litter layer, soil and roots. Where necessary, data were log-transformed. Statistical analyses were performed using R 2.13.1 1 (http://www.rproject.org).
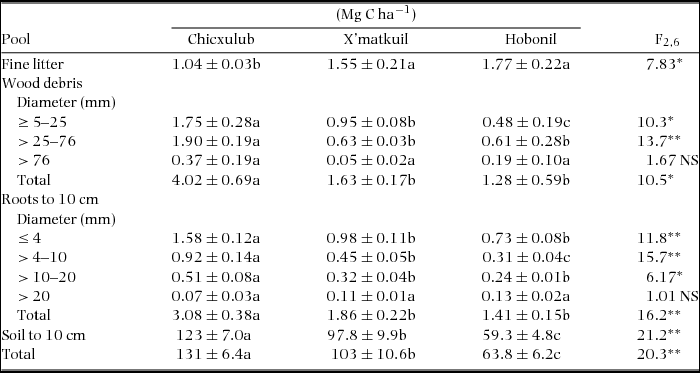
Fine-litter C pool increased with increasing MAP (Table 2). In contrast, C pools in total wood debris decreased with increase in MAP, reflecting large differences across sites in pools associated with lower size classes. Also C pools in total root biomass were larger in the driest, Chicxulub site, than in wetter sites (by a factor of 1.7 relative to C pools in X'matkuil, and by a factor of 2 relative those pools in Hobonil). Differences across sites reflected changes in C pools for size classes lower than 20 mm in diameter. Roots of the largest size class (i.e. > 20 mm in diameter) constituted a statistically homogeneous group across sites (P > 0.05). Chicxulub soils also had the highest organic C pools relative to soils from wetter counterparts. Overall, we found a decreasing gradient in the total C pool in Yucatan soils in the direction of Chicxulub > X'matkuil > Hobonil, and the corresponding ANOVA indicated that this gradient is highly significant.
Table 2. Soil carbon pools in three study sites of Yucatan Peninsula. Data are mean ± SE of three forest stands. Different lowercase letters (a, b) indicate means are significantly different, when testing for differences among regions. NS, P ≥ 0.05; *, P < 0.05; **, P < 0.01.

A high proportion of the total C pool (93–95%) was in the top 10 cm of soil in all forest sites. The smallest C pool was in roots (1.8–2.4% of the total C), meanwhile the C in the litter layer represented 3–5% of the total pool. These patterns were observed irrespective of study site. However, distribution of C in the litter layer (i.e. wood debris vs. fine litter) varied across sites; the proportion of the forest-floor C pool in wood debris decreased from 80% in the driest site, to 51% and 42% in X'matkuil and Hobonil sites, respectively.
Total C pools on the Yucatan Peninsula, calculated from Table 1 (for above-ground biomass with a C concentration of 50%; 23.7 Mg C ha−1 for Chicxulub, 24.4 Mg C ha−1 for X'matkuil and 32.8 Mg C ha−1 for Hobonil) and Table 2, were 154 Mg C ha−1 for Chicxulub, 127 Mg C ha−1 for X'matkuil and 96.6 Mg C ha−1 for Hobonil. Surface-soil C accounted for 85%, 81% and 66% of the total C for Chicxulub, X'matkuil and Hobonil sites, respectively. These C proportions in Yucatan soils are larger than values in other tropical forest soils (soil C accounted for 32% of total C in tropical forests; De Deyn et al. Reference DE DEYN, CORNELISSEN and RICHARD2008, Pan et al. Reference PAN, BIRDSEY, FANG, HOUGHTON, KAUPPI, KURZ, PHILLIPS, SHVIDENKO, LEWIS, CANADELL, CIAIS, JACKSON, PACALA, MCGUIRE, PIAO, RAUTIAINEN, SITCH and HAYES2011). Our data are not enough to support a mechanistic explanation. However it has been reported that karstic soils and specifically Yucatan's soils have high potential to form aggregates with carbonates, favouring C stabilization by slow organic matter decomposition (Shang & Tiessen Reference SHANG and TIESSEN2003). Thus, the stabilization of the C and the low water availability in Yucatan's soils driving a low metabolic activity prevent C losses by either soil respiration or leaching.
Three pools provide evidence for the significant decrease in soil C storage with increase in MAP in Yucatan Peninsula (wood debris, roots and soil organic C). The consistent trend with precipitation amount in soil C storage that we found seems to contradict findings that C storage in tropical forest soils increases with MAP (Posadas & Schuur Reference POSADAS and SCHUUR2011, Schuur et al. Reference SCHUUR, CHADWICK and MATSON2001). A potential explanation for this inconsistency between our and Schuur's studies includes an increasing C turnover time with decreasing MAP, resulting in higher C accumulation per unit of C input in the driest site. Inter-site experiments conducted throughout the tropics show that rainfall is positively correlated with decay rates in tropical forests (Powers et al. Reference POWERS, MONTGOMERY, ADAIR, BREARLEY, DEWALT, CASTANHO, CHAVE, DEINERT, GANZHORN, GILBERT, GONZÁLEZ-ITURBE, BUNYAVEJCHEWIN, GRAU, HARMS, HIREMATH, IRIARTE-VIVAR, MANZANE, OLIVEIRA, POORTER, RAMANAMANJATO, SALK, VARELA, WEIBLEN and LERDAU2009). Decomposition rates of leaves from dominant tree species were measured across the local precipitation gradient in Yucatan where other factors (topography, parent material, vegetation and ecosystem age) were held constant (M. Bejarano unpubl. data). Results of these experiments indicate that decomposition rates of leaves placed on the soil surface increase by 55% with increased precipitation, whereas litterfall increased only by 10% across the gradient (J. Campo pers. obs.). Thus, decomposition processes may be inhibited to a greater degree than plant productivity at low levels of precipitation, and lead to an accumulation of soil organic matter.
The new climate relationships observed in the Yucatan Peninsula add to our conceptual understanding of the effect of precipitation regime on soil carbon storage in tropical forests. Patterns observed in carbon storage in Yucatan soils have several implications for how carbon sequestration and turnover in tropical forests may respond to climate change.
ACKNOWLEDGEMENTS
We are grateful to three anonymous referees for valuable and constructive criticisms to an earlier draft of this paper. This study was supported by PAPIIT-UNAM 220610 and CONACYT 60429 and 154754 grants. LLRF thanks Consejo Nacional de Ciencia y Tecnología (CONACYT) for the grant during PhD studies.


