


Introduction
The existence of very complex biological structures is undoubtedly one of the most outstanding characteristics of all kinds of life forms. A simple survey, even superficial of the structures that characterize even the simplest forms of life, causes astonishment. These often beautiful symmetries, regularities, hierarchies, orderings, etc., are normally a consequence of symmetries, regularities, etc., also observed in their most elementary components, even at the most basic molecular levels. It is also well known that the forces that control and organize these structures at all levels are ultimately of electric origin. Since the atoms of all the elements that intervene in biological systems are electrically charged, electrical interactions in all their manifestations are responsible for the energy transformations that occur in the realm of life in aqueous media. Therefore it is electrical interactions that give rise to all the transformations that occur in biology. They range from the covalent bond that builds the elementary water molecules, to the complex interplay cycles that give rise to muscle contraction or nerve impulse propagation, to mention just a few conspicuous examples. Electrical interactions manifest more elaborate forms of action the more complex the associations of atoms are. In this way the interactions can range from the simple coulombian interaction between ions considered as point charges embedded in a homogeneous medium, to the sophisticated transfer of protons between macromolecular complexes, including the existence of permanent dipole effects (water molecules), or induced dipolar associations among macromolecular complexes. In short, the more complex a system is, the more complex its electrical interactions are.
The hydrophobic effect is a phenomenon of electrical origin that manifests itself in situations involving complex molecular systems and water and/or polar molecules. Hydrophobicity is a merging property in a complex molecular system that does not manifest itself in each of the individual components. Due to such emergent properties, its associated phenomenology needs to be described with its own laws. The hydrophobic effect arises due to the relatively strong affinities water molecules exert on each other, as compared with the affinities that other molecules (i.e. hydrocarbons) exert on other hydrocarbons or even the affinities that these molecules exert on water. Affinities among water molecules are at least an order of magnitude stronger than the affinities among other molecules. Hydrophobicity is thus an entropic force where water molecules present the strongest interaction among themselves and as a consequence confine these other molecules (‘hydrophobic’) to the least interacting surface with water. Since hydrophobic forces are the result of many electrical interactions between many atoms that give rise to their own interaction laws, they may compete with other simpler electrostatic interactions also present in molecular complexes. In the end, it is the nuanced balance between both electric and hydrophobic interactions that ends up giving rise to the myriad of structures and functions found in the world of biology. Hydrophobic forces are thus, paramount in the interactions of proteins and nucleic acids and in the formation of higher structures and activities (Zhu et al., Reference Zhu, Xu and Yan2020). There is an excellent and classical description by Tanford (Reference Tanford1980) and more recently by Kronberg (Reference Kronberg2016).
Since hydrophobicity manifests as an entropic force, it can be considered as a stored energy in each system due to the molecular arrangement of its components and thus contributing to the free energy of the system. The formal study of hydrophobicity in macromolecular complexes is not straightforward. A very common way of approaching the hydrophobic effect has been to consider phenomenological models based on the surface area accessible to water in proteins for example (Jackson and Sternberg, Reference Jackson and Sternberg1994; Chandler, Reference Chandler2005; Patel et al., Reference Patel, Varilly and Chandler2010). More rigorous models have been based on the existence of hydrophobic potentials. Although these models are not described in this review, it is worth noting that they have worked well especially in small molecules, as demonstrated by Lin et al. (Reference Lin, Fawzi and Head-Gordon2007) and Makowski et al. (Reference Makowski, Czaplewski, Liwo and Scheraga2010) and are by no means in conflict with other models. Theoretical descriptions may be found in the literature (Israelachvili and Pashley, Reference Israelachvili and Pashley1982; Hummer, Reference Hummer, Garde, García, Pohorille and Pratt1996; Hummer, Reference Hummer1999; Gao et al., Reference Gao, Remsing and Weeks2002; Kegel and van der Schoot, Reference Kegel and van der Schoot2004; Meyer et al., Reference Meyer, Rosenberg and Israelachvili2006; Lin et al., Reference Lin, Fawzi and Head-Gordon2007; Hammer et al., Reference Hammer, Anderson, Chaimovich, Shell and Israelachvili2010; Makowski et al., Reference Makowski, Czaplewski, Liwo and Scheraga2010; Sarkar and Kellogg, Reference Sarkar and Kellogg2010; Israelachvili, Reference Israelachvili2011; Patel et al., Reference Patel, Varilly, Jamadagni, Hagan, Chandler and Garde2012). These works show that finding simple analytical expressions to describe transformations, in which hydrophobic forces are paramount, is difficult. In fact, the two deeply intertwined forces show an intricate interdependence that can result in either opposing or cooperative actions. For example, Kegel and van der Schoot (Reference Kegel and van der Schoot2004) in their study of the self-assembly of hepatitis B virus showed that hydrophobic forces are responsible for the formation of the virus capsid, while electrostatic forces oppose assembly. Such complexity originates the need for a bold definition of a hydrophobic energy in order to facilitate a comparative treatment of both electric and hydrophobic force fields. In spite of the difference in range, the pseudo-hydrophobic energy used in our work is based on an analogy with the electrostatic potential. It is reasonable to assume that the hydrophobic energy used in this work is a function of the actual hydrophobic energy holding a system together. For instance, the description of protein self-assembly in terms of the simultaneous action of both electrostatic and hydrophobic energies should help in the understanding of any type of complex macromolecular association.
Biological membrane model
The unprecedented development of the PDB structure pool has enhanced all of these methods by making thousands of structure coordinates immediately available. In the last few years our group has developed an empirical methodology using a partial analogy with electrical forces and making use of some properties of the theoretical results mentioned above. This method focuses on two concepts: the hydrophobic moment and the hydrophobic energy of interaction between molecules or complexes as described in the following sections. The interaction of these hydrophobic moments is modelled by using the so-called ‘biological membrane’ model (BM model, Mozo-Villarías et al., Reference Mozo-Villarías, Cedano and Querol2014, Reference Mozo-Villarías, Cedano and Querol2016, Reference Mozo-Villarías, Cedano and Querol2017; Mozo-Villarías and Querol, Reference Mozo-Villarías and Querol2019), according to which the hydrophobic moments of macromolecules tend to align like phospholipids in the double layer of a membrane. The hydrophobic tails of the phospholipids tend to hide from the aqueous medium while the hydrophilic heads are exposed to the aqueous medium, as is well known (Fig. 1).

Fig. 1. BM effect. (a) Schematic representation of two single phospholipids. The hydrophobic moment H (green arrow) is defined as the vector obtained from multiplying the hydrophobicity of the phospholipid h+, times the vector D (black arrow) joining the hydrophobic centroid (‘+’, somewhere in the tail) and the hydrophilic centroid (‘–’, in the polar head). (b) Schematics of a lipid bilayer showing the total hydrophobic vectors of each layer (green arrows). The BM effect is the tendency of the hydrophobic dipoles of the phospholipids to join in parallel forming one of the layers of the membrane. The hydrophobic moment H of the layer is the vector resulting from adding those of the phospholipid vectors. The lipid bilayer is formed joining two layers with opposite H vectors. This is a phenomenon that is not reduced to the bilayers of a membrane but has a general character and dictates the behaviour of any set of macromolecules having a hydrophobic vector.
This implies the existence of positive and negative ‘hydrophobic charges’ and allows the definition of the hydrophobic fields and moments.
Naturally, hydrophobic forces are not the only ones to determine the interactions between macromolecules. Electrostatic forces, as mentioned above, have a strong influence with intensities that, at the molecular level, may be in the same or similar ranges as hydrophobic forces. As far as we are aware of, with a few exceptions (Kegel and van der Schoot, Reference Kegel and van der Schoot2004; Isom et al., Reference Isom, Castañeda, Cannon, Velu and García Moreno2010; Peng et al., Reference Peng, Liu, Zhao and Zhou2014) and in some of the discussions found in the articles on hydrophobicity cited above, most studies on hydrophobicity and hydrophobic moments, are not usually compared with electrostatic forces. The latter forces have a better and more precise approach when tools such as the Poisson–Boltzmann treatment are available, so no much work relating hydrophobic interactions in macromolecules with electrostatic properties is available. In this review, based on a coarse–grain approach, studies are explicitly made separately of the electrical effects with respect to the hydrophobic ones. This review will show results of studies in which both the electric dipole moment and the hydrophobic moment appear and some attempts will be made to find relations among them.
This review tries to cover the application of these ideas basically on two main subjects: interaction of protein to form assemblies and self-assemblies on one hand and protein–DNA interactions, especially DNA transcription systems on the other hand. Some perspectives on future applications will also be discussed.
Moment vectors and energies
Electric dipole moment
The importance of electric forces in the realm of the interaction of biomacromolecules has been known for a long time (Perutz, Reference Perutz1978). The macromolecules of interest in this study are, as outlined above, proteins and DNA. These macromolecules, in aqueous solution, have net positive and negative electrical charges distributed in space corresponding to their charged amino acids and nucleotides. Except for the case of naked DNA, they give rise to the appearance of a permanent global dipole moment since the positive and negative centroids do not coincide. DNA is a polyanion and only in polar media is able to show an induced dipole moment. The measurement of a permanent electric dipole moment in proteins and DNA complexes has been a historical topic of interest for researchers from many points of view. Experimental studies began and had their most fruitful time in the 1960s and 1970s, largely due to the attempt to elucidate the structure of chromatin. Pioneers in this field were Frederic and Houssier (Reference Frederic and Houssier1973) who studied the electro-optical properties of DNA and chromatin, in particular their permanent and induced electrical dipole moments. These same techniques have been used to experimentally measure the bending and other physical properties of DNA (Stellwagen, Reference Stellwagen2002; Lu et al., Reference Lu, Weers and Stellwagen2003). Other authors were able to obtain the dipole moment of several filamentous proteins (F-actin: Kobayasi et al., Reference Kobayasi, Asai and Oosawa1964; vimentin: Kooijman et al., Reference Kooijman, Bloemendal, Traub, van Grondelle and van Amerongen1997). These and other researchers used these filamentous proteins since they were suitable for electric birefringence studies. By using other biophysical techniques, other authors have been able to obtain the dipole moment of globular proteins. Such is the case of Petersen and Cone (Reference Petersen and Cone1975) who were able to determine the electric dipole moment of rhodopsin by using dielectric dispersion measurements. The rising appearance of bioinformatics methods allowed Barlow and Thornton (Reference Barlow and Thornton1986) to deal with a larger number of proteins and compute their dipole moments and other electric characteristics. Other authors like Takei et al. (Reference Takei, Watanabe and Amako1999) have used sophisticated techniques such as Stark modulation spectra to determine dipole moments. Chari et al. (Reference Chari, Singh, Yadav, Brems and Kalonia2012) determined experimentally the dipole moment of RNase by measuring solution capacitance and there are other specialized theoretical studies applied to secondary structures (Hol, Reference Hol1985; Sengupta et al., Reference Sengupta, Behera, Smith and Ullman2005).
The development of the Protein Data Bank (REF) has brought about general access to the actual atom coordinates of many macromolecules. This has made it possible to obtain many properties of these macromolecules more easily and in particular to calculate the electric dipole moment, either in vacuum or simulating conditions in solution. It has also allowed researchers to apply exact solutions to the computation of the dipole moment of a number of globular proteins (Orttung, Reference Orttung1977; Washel and Russell, Reference Washel and Russell1984; Antosiewicz, Reference Antosiewicz1995; Honig and Nichols, Reference Honig and Nichols1995). Nevertheless, probably the greatest advance has been achieved by having access to large computing resources allowing the entire theoretical corpus of knowledge to be integrated into the study and visualization of specific macromolecules with great speed and precision. An example of these possibilities is offered by web servers such as Dipol (Felder et al., Reference Felder, Prilusky, Silman and Sussman2007) and Proteopedia (Hanson et al., Reference Hanson, Prilusky, Renjian, Nakane and Sussman2013).
Other studies are based for the most part, on interpretations of coarse–grain models. See for example the case of α- and γ-chymotrypsins (Takashima, Reference Takashima1996); HU protein (Takashima and Yamaoka, Reference Takashima and Yamaoka1999); lysozyme, ribonuclease A, phospholipase, HU protein and myoglobin (Takashima, Reference Takashima2001). For the most part of these studies, the definition of dipole moment, D, used by these authors is the well-known definition:

where qi are the individual electric charges of the amino acids of the protein and ri their positions with respect to an origin of coordinates. Our group has also used this definition but with the following caveats and considerations. Taking into account that ∑qi ≠ 0 in most proteins or protein–DNA complexes, our group has used an alternative definition of electric dipole moment:

where q +i are the positive charges of the amino acids in the protein and c + and c – are the positive and negative electric centroids of the protein. Results obtained with both definitions are very similar, following the same trends. For example, Takashima and Yamaoka (Reference Takashima and Yamaoka1999) computed the dipole moment of the HU protein (PDBid: 1HUE) and those of its subunits, and α-chymotrypsin (Takashima, Reference Takashima1996). Figure 2 shows the electric dipole moments computed using Eq. (1) (top left in Fig. 2) and using Eq. (2) (Fig 2, top right). The relative directions and intensities in both cases are qualitatively similar. The same can be observed for the α-chymotrypsin (bottom row in Fig. 2) where computation of the electric dipole moment was computed using Eq. (1) (bottom left) or Eq. (2) (bottom right).
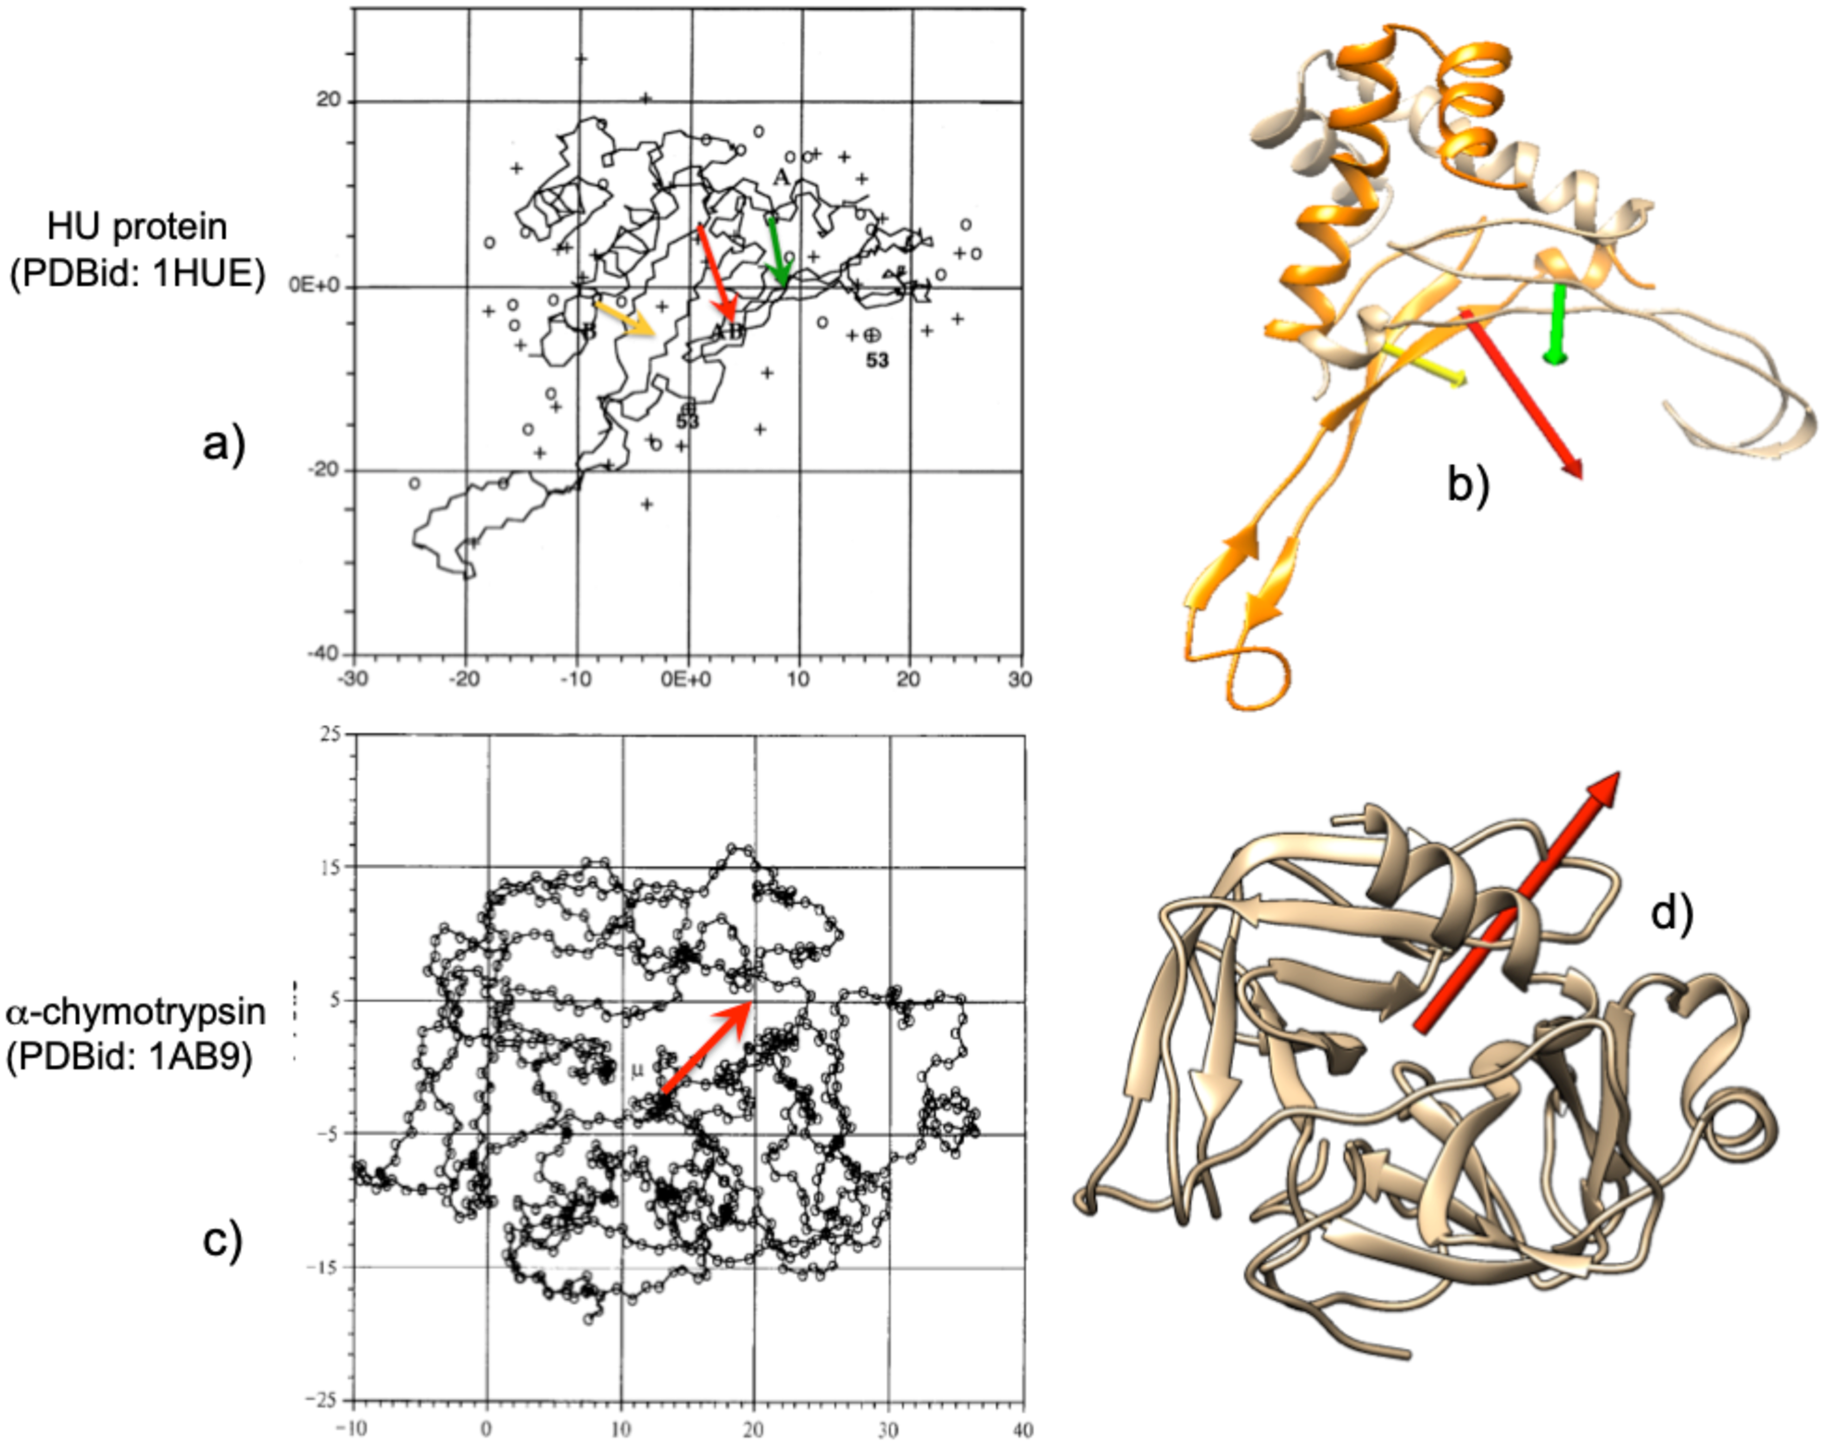
Fig. 2. Examples of graphic comparison of the electric dipole moments computed with Eqs. (1) and (2) (see text) for the HU protein (PDBid: 1HUE) and its subunits, as well as α-chymotrypsin (PDBid: 1AB9). (a) The vectors of the subunits are represented as yellow and green arrows, and that of the total protein in red, as obtained by Takashima and Yamaoka (Reference Takashima and Yamaoka1999) using the exact dipole moment equation (Eq. (1)). (b) Vectors of the same species, using the definition of Eq. (2) of the text. In (b) and (d) an attempt has been made to show the same orientation of the proteins as in (a) and (c). The orientations of the vectors differ relatively little in (b) from (a). Bottom row: (c) α-chymotrypsin as reported by Takashima (Reference Takashima1996) with electric dipole moment as a red arrow. (d) 1AB9 in the same relative position as dipole moment vector obtained with Eq. (2). Figures reproduced with permission.
There is a final consideration concerning the definition of electric dipole moment. In the same way that the dipole moment can be defined using the sum of positive electric charges according to Eq. (2), it can also be defined as

where q –i are the negative charges of the protein. If the considered protein or macromolecular complex is not electrically neutral, D+ ≠ D–, nevertheless the trends and variations observed for both definitions are the same, in our studies. Taking the exact definition and using the centre of mass of the macromolecule as reference system, D (=∑qi⋅ri) takes an intermediate value between D+ and D–. To facilitate computations, the exact definition has been adopted in what follows.
Our group has applied this concept to several issues of interest in molecular biophysics in combination with the analogous concept of the hydrophobic dipole moment. It is defined in an analogous manner as the electric dipole moment and is developed in the following section.
Hydrophobicity index
As mentioned above, the three-dimensional (3D) structure of a macromolecule is mostly determined by its hydrophobic character and properties. Since proteins and nucleic acids are made up of many components, their hydrophobic character is determined as a whole by the hydrophobic properties of their individual components by associating a hydrophobicity value to each component. These hydrophobicity values are determined experimentally and are mostly the result of computing the free energy of the transfer of these amino acids or nucleotides when transferred from an aqueous medium to a hydrophobic medium (or vice versa). Various authors have obtained hydrophobicity scales of such values. At the time the Eisenberg group published their first studies, several hydrophobicity tables existed (Eisenberg et al., Reference Eisenberg, Weiss, Terwilliger and Wilcox1982a). Most studies, including those of the Eisenberg group are based on a ‘consensus scale’ computed from the scales reported by Nozaki and Tanford (Reference Nozaki Y and Tanford1971), Von Heijne and Blomberg (Reference Von Heijne and Blomberg1979), Janin (Reference Janin1979), Chothia (Reference Chothia1976) and Wolfenden et al. (Reference Wolfenden, Anderson, Cullis and Southgate1981). This scale is tabulated in Table SI in the Supplementary material. As can be seen, for all the amino acids there is a gradation of values that go from 0.73 (most hydrophobic Ile) to −1.8 (most hydrophilic Arg) that correspond to the electrically charged amino acids.
For nucleotides, the scale is based on studies carried out by Boldina et al. (Reference Boldina, Ivashchenko and Régnier2009). Hydrophobicities of nucleotides are negative, and hence the strong hydrophobic character of the interior of DNA. Nevertheless new hydrophobicity scales continue to appear based on new criteria or fine-tuning existing ones (Wimley and White, Reference Wimley and White1996; White and Wimley, Reference White and Wimley1999; Mant et al., Reference Mant, Kovacs, Kim, Pollock and Hodges2009; Tasi and Lee, Reference Tasi and Lee2011; Kapcha and Rossky, Reference Kapcha and Rossky2014; Peters and Elofsson, Reference Peters and Elofsson2014). The interest of these assigned hydrophobicity values is that they can be equated to hydrophobicity ‘charges’ (equivalent to the electric charges) for computing hydrophobic moments.
Hydrophobic moment
In the early 1980s, Eisenberg's group (Eisenberg et al., Reference Eisenberg, Weiss, Terwilliger and Wilcox1982a, Reference Eisenberg, Weiss and Terwilliger1982b, Reference Eisenberg, Weiss and Terwilliger1984) devised a simple way to analyse periodicity and symmetry in proteins by calculating the hydrophobic dipole moment of secondary structures, α-helices, and β-sheets. To do this, a series of hydrophobic profiles in very simple structures based on hydrophobic vectors were determined, following a certain analogy with the case of charges and electric moments. Three definitions of hydrophobic moment (HM) were devised. The first one is:

where Hi is the individual hydrophobicity index of each amino acid and si is a unit vector pointing from the alpha carbon atom of the ith residue to the centre of the residue's side chain. This definition of hydrophobic moments holds for each individual amino acid and is extendable to an entire segment of any length. The second definition used by this group is:

where ri is a vector from any origin to the centre of the chain of the ith residue, and 〈Hi〉 is the average hydrophobicity for the amino-acid side chains in the structure.
This moment is independent of the choice of origin of coordinates and represents the degree of amphiphilicity in the directions perpendicular and parallel to the axis of the secondary structure. When applying both definitions to a comparative study of the α-helices of haemoglobin and myoglobin (Eisenberg et al., Reference Eisenberg, Weiss, Terwilliger and Wilcox1982a), a reasonable correlation was found between them. All this allowed them to observe (Eisenberg et al., Reference Eisenberg, Weiss and Terwilliger1982b) a certain correlation when grouping hydrophobic helices inside membrane proteins with positive hydrophobicity, while helices with negative hydrophobicity were grouped in soluble globular proteins.
Later, to study in more detail the periodicity of structures, these authors (Eisenberg et al., Reference Eisenberg, Weiss and Terwilliger1984) used a more generalized and sophisticated definition of dipole moment:

where δ represents the periodicity of the protein, to be determined. In this manner, the hydrophobic moment is the Fourier transform of the hydrophobicity function, taking the hydrophobic values of each residue as the coefficients of the transform. This definition was applied to different types of groupings of secondary structures in model peptides of different composition of Arg, Ile, Ala and Leu. This allowed them to obtain different profiles and their comparison to other proteins.
On average, it was determined that the periodicity of hydrophobicity in α structures shows a maximum over 100°, while in β structures it is over 160° (Eisenberg et al., Reference Eisenberg, Weiss and Terwilliger1984). This study also reveals another aspect of the formation of the secondary structure of proteins since it was observed that the periodicity in hydrophobicity is an important factor in the formation of segments of these structures. A further analysis of this method can be found in the review of Phoenix and Harris (Reference Phoenix and Harris2002) and applications to membrane proteins (Wallace et al., Reference Wallace, Daman, Harris and Phoenix2004). With all these, Eisenberg et al. (Reference Eisenberg, Weiss and Terwilliger1984) saw in these parameters a property related to folding, suggesting that even these structures acquire hydrophobic moments with high values when they form at the polar/apolar interfaces on the protein surfaces. Similar results were obtained by Worch (Reference Worch2013) in a study of the influenza fusion peptide. Although this analysis has shown limitations, it has also led to quite a few predictions (Phoenix and Harris, Reference Phoenix and Harris2002).
In the early 2000s, Silverman (Reference Silverman2001, Reference Silverman2003) studied the 3D structure of proteins with a somewhat more nuanced definition of hydrophobic moment. On the one hand, a definition for the moment:

which describes the amphiphilicity and the hydrophobic imbalance with respect to the average hydrophobicity. Another definition includes the exposure of each residue to the medium pi:

where hi is the hydrophobicity index of the ith amino acid. With these definitions, the 3D structure of a set of proteins was studied as well as the hydrophobic imbalance that occurs in proteins. It was clearly seen that the magnitude of the hydrophobic moment provides a clear indication of the difference in distributions of amphiphilicity in hydrophobic zones and hydrophilic zones. Silverman also studied the tensor characteristics of amino acid distributions in proteins.
In a similar manner than the case described for electric dipole moments, in general the total hydrophobicity of a protein is not zero, ∑hi ≠ 0, so our group (Mozo-Villarías et al., Reference Mozo-Villarías, Cedano and Querol2003) adopted a definition of hydrophobic moment, H+, analogous to the electric dipole moment

or simply,

We can define H– which corresponds to the hydrophilic moment of the protein analogously to the electrical case. Both definitions approximate the exact definition of hydrophobic dipole moment when the difference H+i − H–i tends to zero.
We use the positive hydrophobicities of each amino acid, h +i, to define the hydrophobic moment vector H, since it is the hydrophobicity and its transformations that are the object of our interest. When applied to those proteins studied by Silverman, very similar results are obtained (Fig. 3).
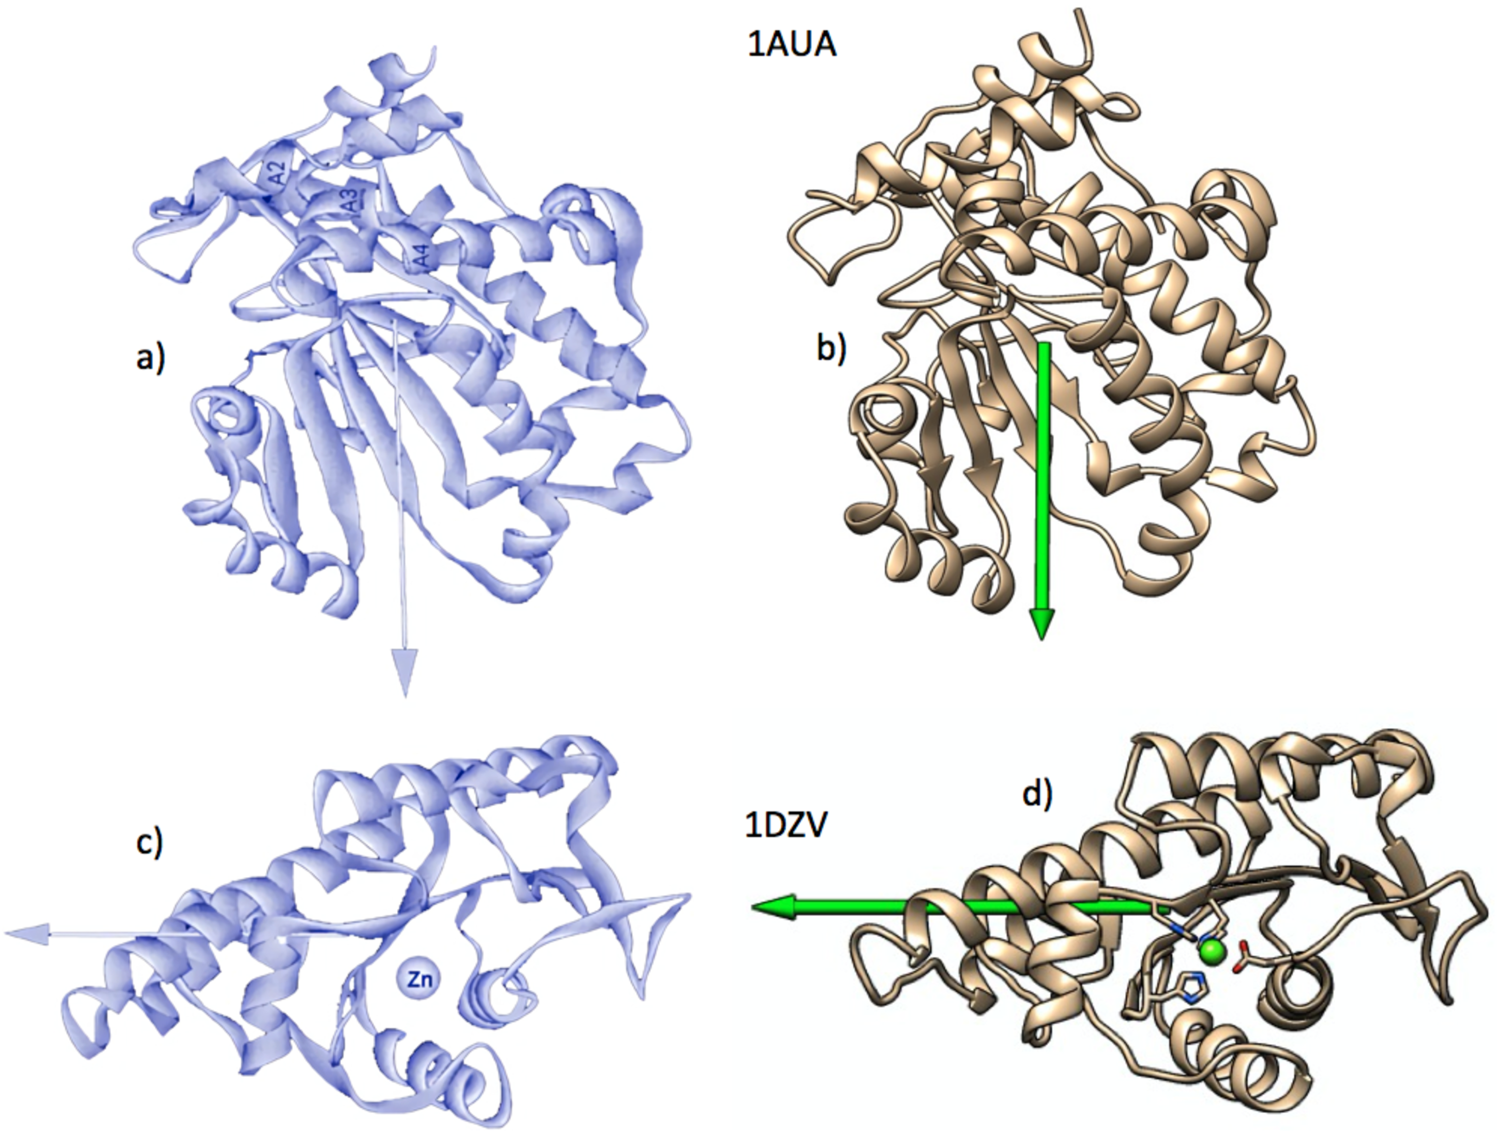
Fig. 3. Examples of graphic comparison of the hydrophobic dipole moments computed for phosphatidylinositol transfer protein (PDBid: 1AUA) and l-fuculose-1-phosphate aldolase (PDBid: 1DZV). (a) The vectors on the left figures (black backgrounds) were obtained by Silverman (Reference Silverman2003), using Eq. (5). Those on the right were obtained by the authors, using Eq. (9). As in Fig. 2, proteins shown on the right have been drawn trying to show the same orientations as those on the left. Figures reproduced with permission.
Other authors have used hydrophobic vectors in a variety of systems. Vik studied the transmembrane helices of complex I of Escherichia coli trying to identify the helices that are more likely to be in contact with membrane lipids (Vik and Dao, Reference Vik and Dao1992; Vik, Reference Vik2011). With the analysis of the 13 helices of the complex, Vik was able to conclude that helices 1, 2, 3, 9, 13 and 14 were the most likely to contact the membrane. On the other hand, helices 4, 5, 7 and 8 are those with the least probability of contact.
For their part, Rawat and Biswas (Reference Rawat and Biswas2012) applied this methodology to characterize the packing of intrinsically disordered proteins (IDPs). Although these proteins lack a fixed 3D structure, these authors were able to conclude that IDP proteins can be considered prolate ellipsoids. This result is to be expected in proteins with a low content of hydrophobic amino acids and a high proportion of polar amino acids. However, they retain a certain proportion of secondary structure in an intermediate situation somewhere between the quasi-sphericity of globular proteins and completely unstructured protides. There have also been reports on the limitations of the hydrophobic moment of helices in peptides, due to being quite limited predictors of the degree of helicity. This was observed by Cherry et al. (Reference Cherry, Higgins, Melroy, Lee and Pokorny2014) using Eisenberg's definition of hydrophobic moment. Using several variants of the δ-lysin peptide with the same hydrophobic moment, they observed that there was a variable degree of helicity between the δ-lysin variants when binding to bilayers of different composition.
By that time, Reißer et al. (Reference Reißer, Strandberg, Steinbrecher and Ulrich2014) used a definition of hydrophobic moment specially suited in 3D space and more sophisticated than the Eisenberg definition and its variants, which were only applicable to secondary structures. This definition is based on a method devised by Decherchi and Rocchia (Reference Decherchi and Rocchia2013) consisting of the projection of rays to triangulate multiple complex surfaces. They calculate the electrostatic potentials in the corner points of these triangles |V e|ij using the Poisson–Boltzmann equation. With all these, Reißer et al. define the hydrophobic moment as:

(see Reißer et al., Reference Reißer, Strandberg, Steinbrecher and Ulrich2014, for a full description).
This method, seemingly more precise than those previously described, was used to study the hydrophobic properties of small antimicrobial peptides such as gramicidin and PGLa magainin. These authors obtained 3D hydrophobic moments that showed very precise orientations as can be seen in Fig. 4. It is worth mentioning that they related geometrical arrangements of electric charges with hydrophobic moments, although without mentioning electric dipole moments. Figure 4 shows a comparison of the results of PGLa obtained by Reißer et al. with those obtained by our group on the same molecule. There is reasonable agreement between both results in spite of the difference in methodology.

Fig. 4. Graphic comparison of the hydrophobic moments of magainin PGLa as obtained by Reißer et al. (Reference Reißer, Strandberg, Steinbrecher and Ulrich2014) (a), and by our group (b). The vertical projection of the moments shows a greater inclination obtained by the more precise method of Reißer et al. This difference is attributable to the fact that PGLa is a relatively small peptide, which makes the result more sensitive to the degree of precision of the method used. Figures reproduced with permission.
As can be seen, both for the case of electric dipole moments and for the hydrophobic moments studied and published in the literature, the specific definition is not very decisive on the results, since they all correspond to coarse–grain models. In what follows, the electric dipole moments (DM) vectors will be designated by D and the hydrophobic dipole moment vectors (or simply hydrophobic moment vectors, HM) by H. Note that with our definitions, all the macromolecules described (or significant parts of their structures such as alpha helices, beta sheets, protein domains and subdomains, stacked bases sets, etc.), are addressed in 3D. Hence, H and D directly indicate the direction and magnitude of the hydrophobic and electrical anisotropies (Mozo-Villarías et al., Reference Mozo-Villarías, Cedano and Querol2014, Reference Mozo-Villarías, Cedano and Querol2017; Mozo-Villarías and Querol, Reference Mozo-Villarías and Querol2019). This review shows examples of DNA and protein behaviour as well as protein self-assembly and interactions with DNA. In all these cases, D and H were computed simultaneously and, as far as possible, a relationship between both is sought, even if it is empirical in nature.
Energy simulations
When studying the affinities between protein elements (i.e. monomers) that are being assembled, it is of great interest to know the energy that the dimer will adopt. It is known that two parallel counter-aligned electric dipoles attract each other, while they repel each other if they are aligned. The electric dipoles that can occur in macromolecules are usually assembled by adopting a multitude of relative orientations in space due to the steric hindrances that may be present.
For electrical interactions, we use the well-known expression for the interaction energy of two electric dipoles, D1 and D2, separated by a distance r

where ur is the unit vector that defines the distance between D1 and D2. Factor 4πε 0 is taken to be 1 and thus enD units are arbitrary.
Analogously, considering the individual hydrophobicities of each amino acid as hydrophobic ‘charges’, the interaction energy between two hydrophobic dipoles H1 and H2 is postulated (Mozo-Villarías and Querol, Reference Mozo-Villarías and Querol2019) as:

where the constant k is taken as 1.
Hydrophobic moments interact, in our approximation of the hydrophobic force field, analogously to electric dipole vectors but with opposite affinities. Hydrophobic charges of the same sign attract each other, whereas charges of opposite sign repel each other. The differences between these two formulas are, on the one hand, the opposite sign that both exhibit, and on the other hand, the spatial dependence of the energy between the interacting dipoles. In the hydrophobic case, it is considered an inverse exponential dependence (Israelachvili and Pashley, Reference Israelachvili and Pashley1982; Israelachvili, Reference Israelachvili2011). Since in these formulas D and H are pseudo-moments and are expressed in arbitrary units, both enD and enH are taken here as pseudo-energies or energy indices that depend directly on the electrical and hydrophobic energies. Consequently, the need to express these pseudo-energies in arbitrary units prevents any comparison between the enD and enH energies.
A comment must be made regarding the dependence of both enD and enH energies with distance, r. Since enD and enH, as defined above, cannot be directly compared to each other, we must try to put both interactions into a relative mutual context in the range of distances involved in these studies. The fact that the variation of the function r −3/e −r versus r (i.e. enD/enH versus r) presents a minimum for a given distance r 0, is an indication that from this distance the electrostatic energy of the dipoles begins to prevail over the energy of the hydrophobic dipoles. We consider that this distance r 0 must be specific to each protein or molecular complex under scrutiny since it must depend on the particular spatial and environmental characteristics. This variable preponderance among different species of molecules should be expected since it would be superfluous for the nuanced action of the hydrophobic interaction to act in the same manner as the electrostatic.
In order to relate these energies to the actual 3D configuration that an assembly may adopt it was considered necessary to check whether two consecutive monomers in a given assembly result in an optimal energy conformation (minimum energy). To check this, rotations of a monomer B with respect to a monomer A in the three directions of space were simulated and the resulting energies, enD and enH, were computed for each simulated rotation by using Eqs. (11) or (12) respectively. Figure S1 (Supplementary material) schematically shows this approach in which two monomers interact to form a dimer. Both monomers have their H vectors (H1 and H2) and their D vectors (not drawn for simplicity). Both energies enD and enH are calculated by Eqs. (11) and (12). Then H2 (or D2) is rotated in three orthogonal directions, with respect to H1 in steps of 10°. These directions are: rotation around the x-axis as the joining distance vector of H1 and H2; rotation around the y-axis as the direction perpendicular to both the plane formed by the x-axis and vector H2; rotation around the z-axis as the direction perpendicular to both x- and y-axis. For each simulated rotation angle, enH is computed. The same procedure is applied to electric dipole moments D1 and D2, and enD is computed. It should be noted that rotations performed for the H2 vector are independent of those performed for the D2 vector using the same criteria.
In what follows in this review, the results are shown as a plot of enH (and enD) versus rotated angle, in the three directions of space as defined above. At an angle of 0°, the energy is native to the system. This simulation allows us to know if a certain configuration adopted by the monomers in a dimer is in its energetically optimal configuration (see Fig. S2 in the Supplementary material). These simulations can help predict the energetically most favourable 3D conformation that two dipole moment vectors (hydrophobic or electrical) may adopt when they interact attractively, taking into account the steric hindrances. A note on the rotation simulation plots and on the colour coding used in what follows in this review. To simplify the figures, the simulations of the rotation of one monomer over its neighbour, both hydrophobic and electrical curves are made on the same plot. Although in both hydrophobic and electric cases the units used are arbitrary, the left y-axis refers to enH and the right y-axis refers to enD. The colour green is used to designate both the H vectors and the simulated curves of enH energies. The red colour is used for the electrical case.
Examples of applications
Simultaneous observation of both vectors H and D have been carried out by our group to try to observe what trends each of them follows in their interactions. Both were computed in two types of large protein self-associations: closed systems, that is, systems in which a large number of monomers self-assemble to produce a completely closed structure, as are the case in the capsids of many viruses. Open systems are considered those assemblies in which the addition of new monomers does not have a defined limit, such as the case of microtubule growth, for instance. The aim is to find out the role played by both vectors H and D in these constructions.
It has been mentioned previously that it is very common that in their interactions in large biological macromolecules, one type of interaction attracts the components to form a complex, against the repulsive action of the other type of interaction. What follows below are a few examples of both cases, as well as the third case in which the two interactions act both in an attractive way.
Closed systems
Hepatitis B virus
This system (PDBid: 1QGT) is made up of 60 dimers and is described below by its levels of organization. We first consider each of the 120 monomers. These monomers are organized into dimers that are the basic elements in the organization of the entire structure. The dimers, in turn, are groups of five, thus completing a total of 12 pentamers of dimers in the whole capsid. Each monomer in the dimer has a secondary structure made up of several alpha helices (Fig. 5b). The two largest amphipathic helices are attributed to the formation of dimers (Katen et al., Reference Katen, Tan, Chitapu, Finn and Zlotnick2013). A vector analysis reveals that these monomers possess strong hydrophobic moment vectors, H. Figure 5c shows the angular profile of a simulation in which the two monomers of the dimer rotate one over the other in the three dimensions of space (see Supplementary material for details).

Fig. 5. Hepatitis B virus spheroidal capsid (PDBid: 1QGT). (a) Scheme of the virus formed by 60 dimers grouped into 12 pentamers. In the figure, in one of the pentamers each dimer is represented in a different colour. The green and red arrows represent the H and D vectors respectively, pointing to the centre of the spheroid, making the total H and D vectors zero for the whole set. (b) Formation of the basic dimer bonded by hydrophobic forces against electrical repulsion. The non-perfect alignment of H and D gives rise to their respective resulting vectors (H in blue and D in yellow). (c) Simultaneous plot of the energies enH (green) and enD (red) in both simulations of the rotation of one of the monomers with respect to its adjacent. Left vertical axis in the plot is for enH, right vertical axis is for enD (both in arbitrary units, see Supplementary material for more details). Note that the H vectors are almost in opposition so that their native interaction energy is close to its minimum. The same can be said of the interaction between vectors D, which in this case are repelled. The formation of each dimer thus occurs by hydrophobic force. (d) Formation of a pentamer. The H and D vectors of the five dimers (in red and green respectively) are quasi-aligned in parallel and also here the pentamer is formed by hydrophobic affinity between the dimers, against the electrical force. Due to steric clashes, the dimers do not assemble linearly but form a ring in the shape of a bonnet. (e) Simulation of the energy of rotation of a dimer over another contiguous one in the pentamer. The hydrophobic interaction energy between them reaches the minimum in the native configuration, while the electrical interaction is repulsive for the native configuration. The resulting H and D moments are perpendicular to the cap plane and point towards the centre of the spheroid. Note. In the plots of this figure and in those that follow in this review, the angular variations of enH and enD are represented simultaneously in one plot. Although enH and enD are expressed in arbitrary units, the left ordinate axis represents the variations of enH in green. The right vertical axis corresponds to enD, shown in red. Also for those arrows representing vectors, green colour is used for H vectors and red is used for D vectors.
This figure shows that the native energy (0°) the hydrophobic energy enH of the dimer is at its minimum. This is in agreement with the observation by Wynne et al. (Reference Wynne, Crowther and Leslie1999) that a hydrophobic core stabilizes the monomer fold. In accordance to our BM model, the formation of the dimer is carried out in such a way that the H vectors tend to counter-align. This alignment though, is not complete, leaving a resultant net hydrophobic moment quasi perpendicular to both monomers (Fig. 5b). Alexander et al. (Reference Alexander, Jürgens, Shepherd, Freund, Ashcroft and Ferguson2013) consider that this dimerization is relatively weak because it results from the difference in ΔG contact − ΔG conf being ΔG contact the change in free energy of the dimer contacts and ΔG conf, changes in free energy of unfavourable conformational rearrangements.
In our view, these dimer ‘residual’ H vectors serve to group the dimers into a bonnet-shaped pentamer, where the H vectors point towards a common point that is the centroid of the capsid (Fig. 5a). The question that may arise here is why the dimers form these pentamer-rosettes, rather than associating in strict parallelism. We propose that given the obliquity of the orientation of these vectors, there is a ‘horizontal’ component to the pentamer plane. These horizontal components cancel out when the pentamer is formed, probably due to steric clashes, so this conformation can be considered in a minimum of conformational energy. The vertical components are strictly parallel fulfilling the condition of our membrane model and providing the pentamer of a solid hydrophobic attraction.
The same reasoning can be applied to the electric dipole moments of the monomers, the dimers and the pentamers of dimers but with opposite effects since the parallel association of electric dipole moments result in a repulsive action. According to Fig. 5b, there is a resultant vector D upon dimerization. When the pentamer of dimers is formed the five horizontal components cancel out, whereas the vertical components result in a parallel association of D vectors with the consequent mutual repulsion of the dimers in the pentamer. The conclusion is then that the conformation of the hepatitis B virus capsid is the resultant of two opposing forces, an attractive hydrophobic force and a repulsive electric force. Kegel and van der Schoot (Reference Kegel and van der Schoot2004) arrived to a similar conclusion when they proposed an interaction of mean force between the protein subunits that is the sum of an attractive hydrophobic interaction, driving the self-assembly, and a repulsive electrostatic interaction, opposing the self-assembly. These authors also suggest that the difference between these two interactions may be relevant as regards the interaction with the DNA load of the virus, since far from being a destabilizing element, the electrical action can be compensated by the electrical attraction between capsid and DNA, making it more difficult to form the empty capsid. This is the case in most instances of biological interactions where each situation is the subtle balance of two opposing tendencies, especially in those cases where opposite actions are needed for different situations. In such cases the net ΔG must be only marginal so not much expense is needed to change situations.
The cluster of 12 pentamers closes in a protein spheroid that constitutes the capsid of the virus (Fig. 5a). As can be seen, both the H and D vectors of each pentamer in the closed capsid point to the centre of the spheroid so that the resultant H and D vectors of the spheroid are zero. This indicates that the formation of the capsid spheroid is the net result of two opposing forces. On the one hand, the hydrophobic effect forces the pentamers to join since their respective H vectors act in quasi-parallel, resulting in a situation similar to that taking place in the formation of micelles. On the other hand, the electric force is a repulsive force by positioning the D vectors of the pentamers pointing in the same direction. This situation is also observed by Alexander et al. (Reference Alexander, Jürgens, Shepherd, Freund, Ashcroft and Ferguson2013), who consider that this result makes dimer–dimer contacts relatively weak.
Katen et al. test the action of AT-130, a member of the phenylpropanamide family of assembly effectors. According to these authors, factor AT-130 (Wang et al., Reference Wang, Naduthambi, Mosley, Niu, Furman, Otto and Sofia2011) is capable of producing substantial changes in the ternary and quaternary structures of the capsid without disrupting its structure of the capsid. AT-130 is sandwiched in the gap between the two basic dimer monomers and could serve as an inhibitor of virus production. A vector analysis allows us to see the difference between the 1QGT dimer and the dimer in which AT-130 has been interspersed (PDBid: 4G93). The modulus of the dimer hydrophobic vector H goes to a half value as an effect of intercalating the AT-130, while that of the D vector increases its value by 25%. In a straightforward conclusion, it seems entirely plausible that the essentially hydrophobic formation that assembles the virus capsid is diminished if the hydrophobic moments are significantly reduced while electrostatic repulsion is increased.
Portal protein P22
Another type of closed system is shown by those assemblies that give rise to pores, ionic channels, protein portals and in general orifices through which molecules of several kinds must circulate. They are characterized by finite cylindrical shapes, in which the elements that compose them are usually arranged in a closed circle providing the system with cylindrical symmetry; consequently the moment vectors H and D are also arranged in a circle. In general, each individual vector has two components, one in the direction of the axis of the cylinder and another in the plane perpendicular to the axis. The components in the plane of the circle cancel out while the components in the perpendicular plane are arranged in parallel. Complying with the BM model, the arrangement of the parallel components of the H vectors in the direction of the axis, means hydrophobic attraction among the elements, whereas for D vectors it means that the electrical force is repulsive.
Viral capsid formation is a fascinating process and there is a large number of viral structures that use protein portals to effect DNA entry into its capsid. An example is offered by the bacteriophage P22 protein portal system (Lokareddy et al., Reference Lokareddy, Sankhala, Roy, Afonine, Motwani, Teschke, Parent and Cingolani2017). There is a very interesting fact in this system composed by 12 elements arranged in a circle. These authors describe the structure of the pre-capsid state of the system (PDBid: 5JJ1), as well as that of the mature virion (PDBid: 5JJ3). Figure 6 shows the differences between the two. Although at first glance it shows a regular structure, Lokareddy et al. detect that the pre-capsid has an asymmetric structure (characterized with an average root mean square deviation (RMSD) of 3.4 Å in the crystal structure), while the mature virion has a symmetric and complete structure (RMSD: 0.134 Å). Vector analysis reveals the great difference that exists between both structures and its possible relevance for the introduction and packaging mechanism of DNA. Figure 6a shows the structure of the pre-capsid of the virus where its asymmetry is fully revealed when calculating the H and D moments of each of the 12 components of both structures. It is interesting to observe in the pre-capsid the great dispersion of the moment vectors, especially H vectors. In contrast, in the mature virion the H and D vectors show good rotational symmetry as well as homogeneity in the values of their relative intensities. It should be noted that in the case of the mature virion the resulting vectors, both H and D, are quasi aligned with the axis of the cylinder. This fact confirms the tendency of the H vectors to associate in parallel, according to the BM effect, while the D vector seems to have the function of electrostatically attracting DNA molecules towards the portal. Lokareddy et al. propose a scheme according to which the DNA is surrounding the portal and according to our analysis, the D vectors would be there to exert attraction on the DNA.

Fig. 6. Vector analysis of bacteriophage P22 protein portal (PDBid: 5JJ1). (a) Procapsid or P22 protein portal showing the individual H vectors of its 12 components (green arrows). They show a high degree of dispersion due to their relatively high RMSD value (3.4 Å), which causes that small variation in the position of the hydrophobic amino acids to translate into substantial variations in the modulus and direction of the H vectors (see text). The same happens to vectors D (not shown for simplicity), although to a lesser extent. (b) Superposition of the twelve elements of the complex. Here the dispersion of the H vectors is more clearly visible. This dispersion is in accordance with the asymmetry described by Lokareddy et al. (Reference Lokareddy, Sankhala, Roy, Afonine, Motwani, Teschke, Parent and Cingolani2017) for the procapsid. (c) Distribution of the energies enH and enD in a simulation of the rotation of two adjacent elements of the complex. In both the electrical and hydrophobic cases, the interactions are marginally attractive in the native position, 0°, although the variations are highly asymmetric, revealing the heterogeneity of the relative orientations. (d) Mature virion of P22 (PDBid: 5JJ3). The 12 monomers have been drawn with different colours and the green arrows represent their H vectors. For clarity, D vectors are not drawn. Total vectors (in blue and red) are directed on the axis of the complex, indicating efficient attractive hydrophobic interaction that outweighs electrostatic repulsion. It is observed that the H and D vectors of the monomers are much more homogeneous and symmetric than in the procapsid. This can be observed in the superposition of all the monomers (e) and in the symmetry of the plot of the simulated interaction energies enH and enD between two contiguous monomers (f).
An easy way to visualize this change from pre-capsid to mature virion is to superimpose the 12 components of each structure and observe the scattering of vectors. Figure 6b shows the superposition of the pre-capsid where one can appreciate the dispersion both in the protein chains and in their corresponding vectors. The mature virion shows a much smaller degree of dispersion than the pre-capsid due to its higher symmetry (Fig. 6e).
It should also be noted the greater dispersion of H vectors than of D vectors. This is explained taking into account that the electric charges of the charged amino acids can only vary between 0 and 1 (or −1) so that variations in the positions of the charged amino acids due to dispersion of their positions have a relatively lower effect on the vector D. Conversely, dispersion in the 3D structure of the protein affects hydrophobic amino acids with greater or lower hydrophobic charge differently in a way that is highly dependent on their location in the protein.
The distribution of energies enH and enD is also very different in the pre-capsid with respect to the mature virion. Figures 6c and f show the angular profiles of rotation simulations of elements A and B of the two structures. As can be seen, the shape of the angular distribution of enH in these two elements in the mature virion (Fig. 6f) is perfectly symmetrical and in the native conformation (0°) it shows that elements A and B are in their minimum hydrophobic energy of interaction. In contrast, in the pre-capsid case the enH energy for the native position is only marginally attractive (Fig. 6c), also showing a very asymmetric enH angular distribution. It is also interesting here to observe that in the mature virion the D vectors, being parallel, imply that the system repels itself electrically. However, in the pre-capsule in its native position, the vectors D show an attractive interaction, although the angular distribution of enD is asymmetric as happens with enH. It may seem somewhat paradoxical or contradictory that although there is a hydrophobic force that efficiently attracts the monomers to form the tubule, there is also an electrostatic force that opposes the assembly. The reason for such net electrostatic force is that it may interact with the DNA that has to circulate through the tubule to facilitate transfer. A similar fact has been described by Bui and Hoang (Reference Bui and Hoang2021) when estimating the interactions that occur in the ribosomal tube when it has to expel the newly formed protein.
Open systems
It has been seen until now that in closed systems, that is, systems with a finite number of components, the resulting vectors Htot and Dtot are totally cancelled such as in the cases of spheroidal structures. In the cases of cylinder-like structures, these vectors cancel out in the plane perpendicular to the direction of the main axis of the structure leaving net components parallel in the direction of the axis of the cylinder. Below we will see open systems, understood as structures that have unlimited growth, as is the paradigmatic case of amyloid assemblies, facilitated in this case because they are relatively small and simple proteic elements but do not have any restriction in their growth. Another type of open structure is the case of microtubules in which a circular type self-assembly is geometrically frustrated (Grason, Reference Grason2016; Lenz and Witten, Reference Lenz and Witten2017) by small asymmetries in the monomers relative to the distribution of their respective H and D vectors. This results in the impossibility of closing the assembling circle giving rise to a helical growth structure. The arrangement of the hydrophobic and electric dipole vectors will be illustrated with two simple and characteristic cases.
Amyloids
Over the last few years there have been a multitude of studies aimed at obtaining treatments for neurodegenerative pathologies such as Alzheimer's disease and others. Thanks to the development of advanced techniques such as cryo-electron microscopy (EM), X-ray crystallography and nuclear magnetic resonance, these studies have resulted in the detailed 3D description of the anomalous behaviour of the responsible peptides–amyloids that are characterized by their progressive self-assembly. These large polymers constitute plaques that deteriorate cellular activity mainly in neurons.
The elucidation of the mechanisms by which the fibres associated with these diseases are formed, makes it necessary to first consider the associative properties of the simplest amyloid peptides. As a general rule, these peptides contain a large proportion of hydrophobic amino acids in beta sheets. In what follows two systems are thus described. The first very simple (PDBid: 3HYD) will help us to describe the applicability of the BM model to these systems based on hydrophobic moments and their interaction energies. Two other examples (PDBid: 5O3L and PDBid: 2M4J) describe amyloids that, in addition to a large hydrophobic content, also include electrical charges. An attempt will be made to envision a possible relationship between the hydrophobic and dipole moments and their respective interaction energies.
The simplest amyloid. Ivanova et al. (Reference Ivanova, Sievers, Sawaya, Wall and Eisenberg2009) studied insulin assembly in a rare disease called injection amyloidosis. They found that the smallest element capable of causing amyloid fibrils is the LVEALYL peptide (PDBid: 3HYD) and determined the structure of the self-assembling microcrystals.
Since it only contains an electrical charge (Glu3) and being a very small peptide, the interaction between peptides occurs exclusively from the hydrophobic effect. The near perfection and simplicity of this beta sheet arrangement, as it appears in the PDB, makes it particularly suitable for studying and interpreting hydrophobic moments. Figure 7a shows a cartoon of the association of these peptides in fibrils.

Fig. 7. (a) Association of the LVEALYL fragment of insulin leading to an amyloidosis-like self-assembly. The green arrows represent the H vectors of each fragment. (b) Angular distribution of the energy enH in the simulation of rotation of one peptide over its adjacent partner. The angular distribution of energies of two opposite peptides is practically identical (data not shown). The quasi-perfect parallelism of the peptides and their hydrophobic vectors produces a very symmetrical angular distribution of energies. The native conformational energy (at 0°) coincides with the minimum energy.
The high degree of parallelism of the peptides is also matched by the perfect parallelism of the individual H vectors of each amyloid segment. Figure 7b shows, in a simulation of the rotation of one of the peptides relative to its parallel companion, that the native orientation between both corresponds to the minimum hydrophobic energy between both. This behaviour of the peptides is in line with the BM model for the assembly of macromolecules, in which the H moments are grouped in parallel and these groups in turn join in an antiparallel way with other groups. Lacking notable electrostatic interactions, this system shows the simplicity of the hydrophobic interaction in these protides.
It is worth mentioning here that Ivanova et al. speculate on the influence that an equimolar amount of peptide RRRRRRLVEALYLV would have on the attenuation of insulin fibrillation. It would certainly be very interesting to dispose of a 3D structure of this peptide in order to compare their respective H vectors, both in direction and intensity. The appearance of an electric dipole moment could also exert certain influence.
Amyloids with electric charges: tau filaments. Recently, the morphology of tau filament inclusions related to Alzheimer's disease has been resolved (Fitzpatrick et al., Reference Fitzpatrick, Falcon, He, Murzin, Murshudov, Garringer, Crowther, Ghetti, Goedert and Scheres2017). These authors determined that the fragment VQIVYKPVDLSKVTSKCGSLGNIHHKPGGGQVEVKSEKLDFKDRVQSKIGSLDNITHVPGGGNKKIETHKLTF is made up of several beta sheets, adopting a C shape (Fig. 8). They were able to observe two types of fibres, the paired helical filaments (PHFs) and the straight filaments (SFs), depending on the way in which the amyloid peptides associate as seen from a meridian section of the fibres.

Fig. 8. Meridian sections of the configurations of two different fibres found by Fitzpatrick et al. in amyloid plaques, present in an Alzheimer's patient (Fitzpatrick et al., Reference Fitzpatrick, Falcon, He, Murzin, Murshudov, Garringer, Crowther, Ghetti, Goedert and Scheres2017). The figure on the left corresponds to a PHF fibre (see text) in which the symmetrical placement of the peptides can be appreciated. Right, another configuration is represented in the placement of fibres (SF) less symmetrical than the previous one. Fitzpatrick et al. attribute a lower stability to SF than to PHF. This is manifested in the simulations of rotation of two adjacent peptides in both configurations. In both cases, the distribution of hydrophobic energy enH between two contiguous peptides (A and C, not plotted in the figure) shows in both cases a quasi-perfect and identical symmetry, for both PHF and SF fibres. This demonstrates a strong and efficient hydrophobic attraction between the peptides. The difference between both types of filaments lies in the interactions between the peptides of the two opposite groups, i.e. A and B. In the PHF filaments, peptides A and B are perfectly counter-aligned and their hydrophobic attraction is also optimal (lower left plot), while for SF fibres, the hydrophobic attraction is far from being optimal as shown in the asymmetry of the lower right plot. In both cases, the electrostatic interaction appears repulsive.
A vector analysis of these two types of fibres leads us to distinguish them clearly and to be able to determine their relative strength and stability. PHFs seem to be the most stable in view of Fig. 8. In both types of fibres (PDBid: 5O3L and 5O3T), each elemental peptide (A) associates in parallel with other equal ones (C), in a very tight association. This in turn implies a hydrophobic association since their hydrophobic vectors H join in parallel with minimum hydrophobic energy in a situation very similar to that seen in 3HYD. In both types of association, a simulation of the relative rotation of the hydrophobic moments of both peptides provides a perfectly symmetric bell-shaped angular distribution of enH, and thus a totally predictable optimum energy of association.
The electric dipole moments are also associated in parallel but their interaction is necessarily repulsive. This is a situation where the hydrophobic force manifestly overrides the electrical one. This association of the elements in parallel (A, C, E, G…, in Fig. 8) suggests that fibre growth is carried out by the lateral addition of amyloid peptides. Once started this fibre joins another similar one (B, D, F…) and makes the hydrophobic moments of both associations orient in an antiparallel manner (A versus B in Fig. 8). This form of association is the most stable and is the one adopted by BMs.
In SFs, the individual elements are strongly associated in parallel as in the previous case, by hydrophobic affinity. However, the way these groups come together seem more marginal than in the case of PHFs. Here, it can be seen how the elements (A) and (C) are strongly united as in the PHF case with the consequent repulsion between the electric dipole moments. However, the elements of different groupings (A) and (B) have an attractive but marginal hydrophobic interaction since the energies enH are not close to the minimums that could adopt under relative rotations of the H vectors of the groups. All of these results are in agreement with the basic conclusions reported by Fitzpatrick et al. According to them in PHFs, the N-terminal region of the tau monomers in both protofilaments folds to form an additional and less ordered β-sheet, against the β1–β2 sheets of the ordered nucleus. It is followed by a disordered zone and rearranges itself in the zone in which Glu7 and Glu9 interact with Lys317 and Lys321. On the other hand, in SF, only a single additional β sheet can be formed, and the N-terminal end of one of the protofilaments is part of the interface, resulting in a less orderly conformation than in the case of PHFs. An additional interesting aspect concerns the observation by these authors that the fibres studied do not present mutations in the gene sequence, so there must be other factors that lead to the disease.
More complexity: amyloids with favourable electric dipoles. There are amyloid systems in which the influence of electrical dipole moments can also favour self-assembly of amyloids. The PDBid: 2M4J system describes human brain-derived Aβ fibrils (Lu et al., Reference Lu, Qian, Yau, Schwieters, Meredith and Tycko2013). The amyloid fibres described by Lu et al. consist of fibres that in their meridian section show three equal amyloid peptides arranged as a triangle. Each of these amyloids of sequence DAEFRHDSGYEVHHQKLVFFAEDVGSNKGIIGLMVGGVV is hairpin-shaped not much unlike 5O3L (Fig. 9). In this case, the H and D vectors of each amyloid were computed, as well as the energies of the hydrophobic and electrical interactions of their different forms of association. As in the case of 5O3L, each amyloid has a hydrophobic moment and an electrical dipole moment in the plane of the hairpin-shaped peptide, forming a very small angle between them. The amyloids packed in parallel, due to their total parallelism and their proximity, have very strong hydrophobic attraction energy, while the D vectors repel each other. In this case too, the hydrophobic force is the one that prevails, as in the case of 5O3L. This is manifest in the quasi-symmetric forms of the angular distributions of enH and enD in simulations of the rotation of one peptide around another like the behaviour seen in the cases of 5OL3 and 3HYD.

Fig. 9. Meridian section of the amyloid fibres in the configuration (PDBid: 2M4J), described by Lu et al. (Reference Lu, Qian, Yau, Schwieters, Meredith and Tycko2013). As in the previous case, consecutive fibres (A and B) offer a very efficient hydrophobic attraction that is revealed in a very symmetric angular distribution of enH. This hydrophobic attraction outweighs the symmetrical electrostatic repulsion between their respective D vectors. Since these angular distributions of enH and enD for elements A–B, are identical to the 3HYD plots, they are not represented here. The main difference between 5O3L and 5O3T lies in the peculiar arrangement in a triangle. The plot on the right represents the angular variations of the rotation simulations for the pair A–B. Note that both interactions at the native configuration (0°) are attractive although neither of them adopts the energy optimum, probably because one effect counteracts the other.
However, the interaction between the three amyloids in any meridian section of the fibre is more complex. Both electric and hydrophobic interactions are attractive. A simulation of relative rotation among amyloids shows that these distributions are highly skewed. This implies that both interactions – electrical and hydrophobic – of the amyloids in the meridian section are only marginally attractive. It is important to emphasize here that a consequence of our analysis is that amyloid fibres of this type, as well as in 5O3L, seem to be formed in the first place with a stacking of amyloids. These stacks then give rise to fibres formed by two stacks (5O3L) or three (2M4J). This conclusion appears in contrast with those observed by Liu et al. (Reference Liu, Liu, Kanekiyo, Xu and Bu2013), in which it seems to be deduced that it is the amyloid trimer of the meridian section of the fibre, the species that nucleates the total fibre. Similar behaviour is observed in Aβ amyloid fibres studied by Paravastu et al. (Reference Paravastu, Leapman, Yau and Tycko2008). These amyloids are the same as those studied above (2M4J) except that they miss the first eight amino acids. Consecutive parallel amyloid peptides show hydrophobic attraction. Probably due to being a morphologically more variable stack and presenting a certain staggering, there is also an attraction between the electric dipole moments. However, both the hydrophobic and electrical attractiveness between the members that are part of the triangle of the meridian section is low.
The behaviour described so far regarding amyloids can be extended to other similar amyloids and even to amyloid formations in which the amyloid monomers are more complex proteins. Mozo-Villarías et al. (Reference Mozo-Villarías, Cedano and Querol2014, Reference Mozo-Villarías, Cedano and Querol2017, Reference Mozo-Villarías and Querol2019) described a number of amyloid complexes of various types, finding interactions between the H and D vectors following the effect of the BM model.
One issue that remains up in the air is the nucleation of the amyloid fibres in the cases seen here (and probably in all amyloid formation). Lu et al. (Reference Lu, Qian, Yau, Schwieters, Meredith and Tycko2013) postulate that due to the inherent polymorphism of Aβ fibres, there is a coexistence of different nucleation mechanisms that give rise to different filament structures. However, these authors admit that in the case observed by them, Aβ fibres are not polymorphic. They give as a possible explanation that the environment of the tissue with which they work only allows a single nucleation process without specifying which process this must be. They consider a multitude of fibres as an alternative explanation for the lack of polymorphism of the species that nucleate. Although our calculations cannot have kinetic implications, our results are consistent with this opinion due to the energetic reasons set out above. On the other hand, it has been proposed by Sabaté et al. (Reference Sabaté, Esparagó, de Groot, Valle-Delgado, Fernández-Busquets and Ventura2010), working with islet amyloid polypeptide, that the nucleation of amyloid growth involves the creation of series of high-energy oligomers.
The general conclusion is that given the relative regularity and symmetry shown by the amyloid fibres, together with the relative small size of the peptides involved, they allow an easy and immediate interpretation of the physics involved. The physical and geometric reduction of these species to these 3D vectors allows the demonstration of the BM model of association of biological macromolecules, as well as the possibility of making predictions on the structure and function of these species.
Tubules
In nature, there is a considerable number of types of microtubules that may grow indefinitely such as virus capsids (Ebola, PDBid: 6C54, 6NUT), tubulin microtubules (PDBid: 5SYC, 3J2U), and many others. Naturally, whatever type of microtubule is involved, it has its own limitation or termination mechanisms, but they are not intrinsic to the microtubules and must be external. They grow basically trying to complete a circle, but unlike finite cylinders, the circle does not close on itself. Instead, and due to asymmetries in the elements that are added to the complex, geometric frustration effects (Grason, Reference Grason2016; Lenz and Witten, Reference Lenz and Witten2017) are produced whereby the pieces that are assembled do not fit perfectly and they must do so in a helical shape. The growth of the capsid of the HIV virus is an example.
HIV virus. In 2013, Zhao et al. (Reference Zhao, Perilla, Yefenyuy, Meng, Chen, Ning, Ahn, Gronenborn, Schulten, Aiken and Zhang2013), using cryo-EM, obtained the 3D structure of the tubular capsid of the HIV virus with a resolution of 8 Å (PDBid: 3J4F). This structure corresponds to the mutant A92E and consists of a tubule that grows helically and whose growth elements are in turn star-shaped hexamers. Each hexamer is a closed system of a two-domain protein: seven α-helices and one β-sheet in the N-terminal domain and four α-helices in the C-terminal domain. Zhao et al. used the molecular dynamics flexible fitting technique to fit the 3D structure of this monomer to model the cryo-EM data. This system is interesting because of its study from the point of view of electric and hydrophobic dipole moments to establish the applicability of the method at two different levels. Figure 10a shows a turn of this tubule, made up of 12 hexamers.
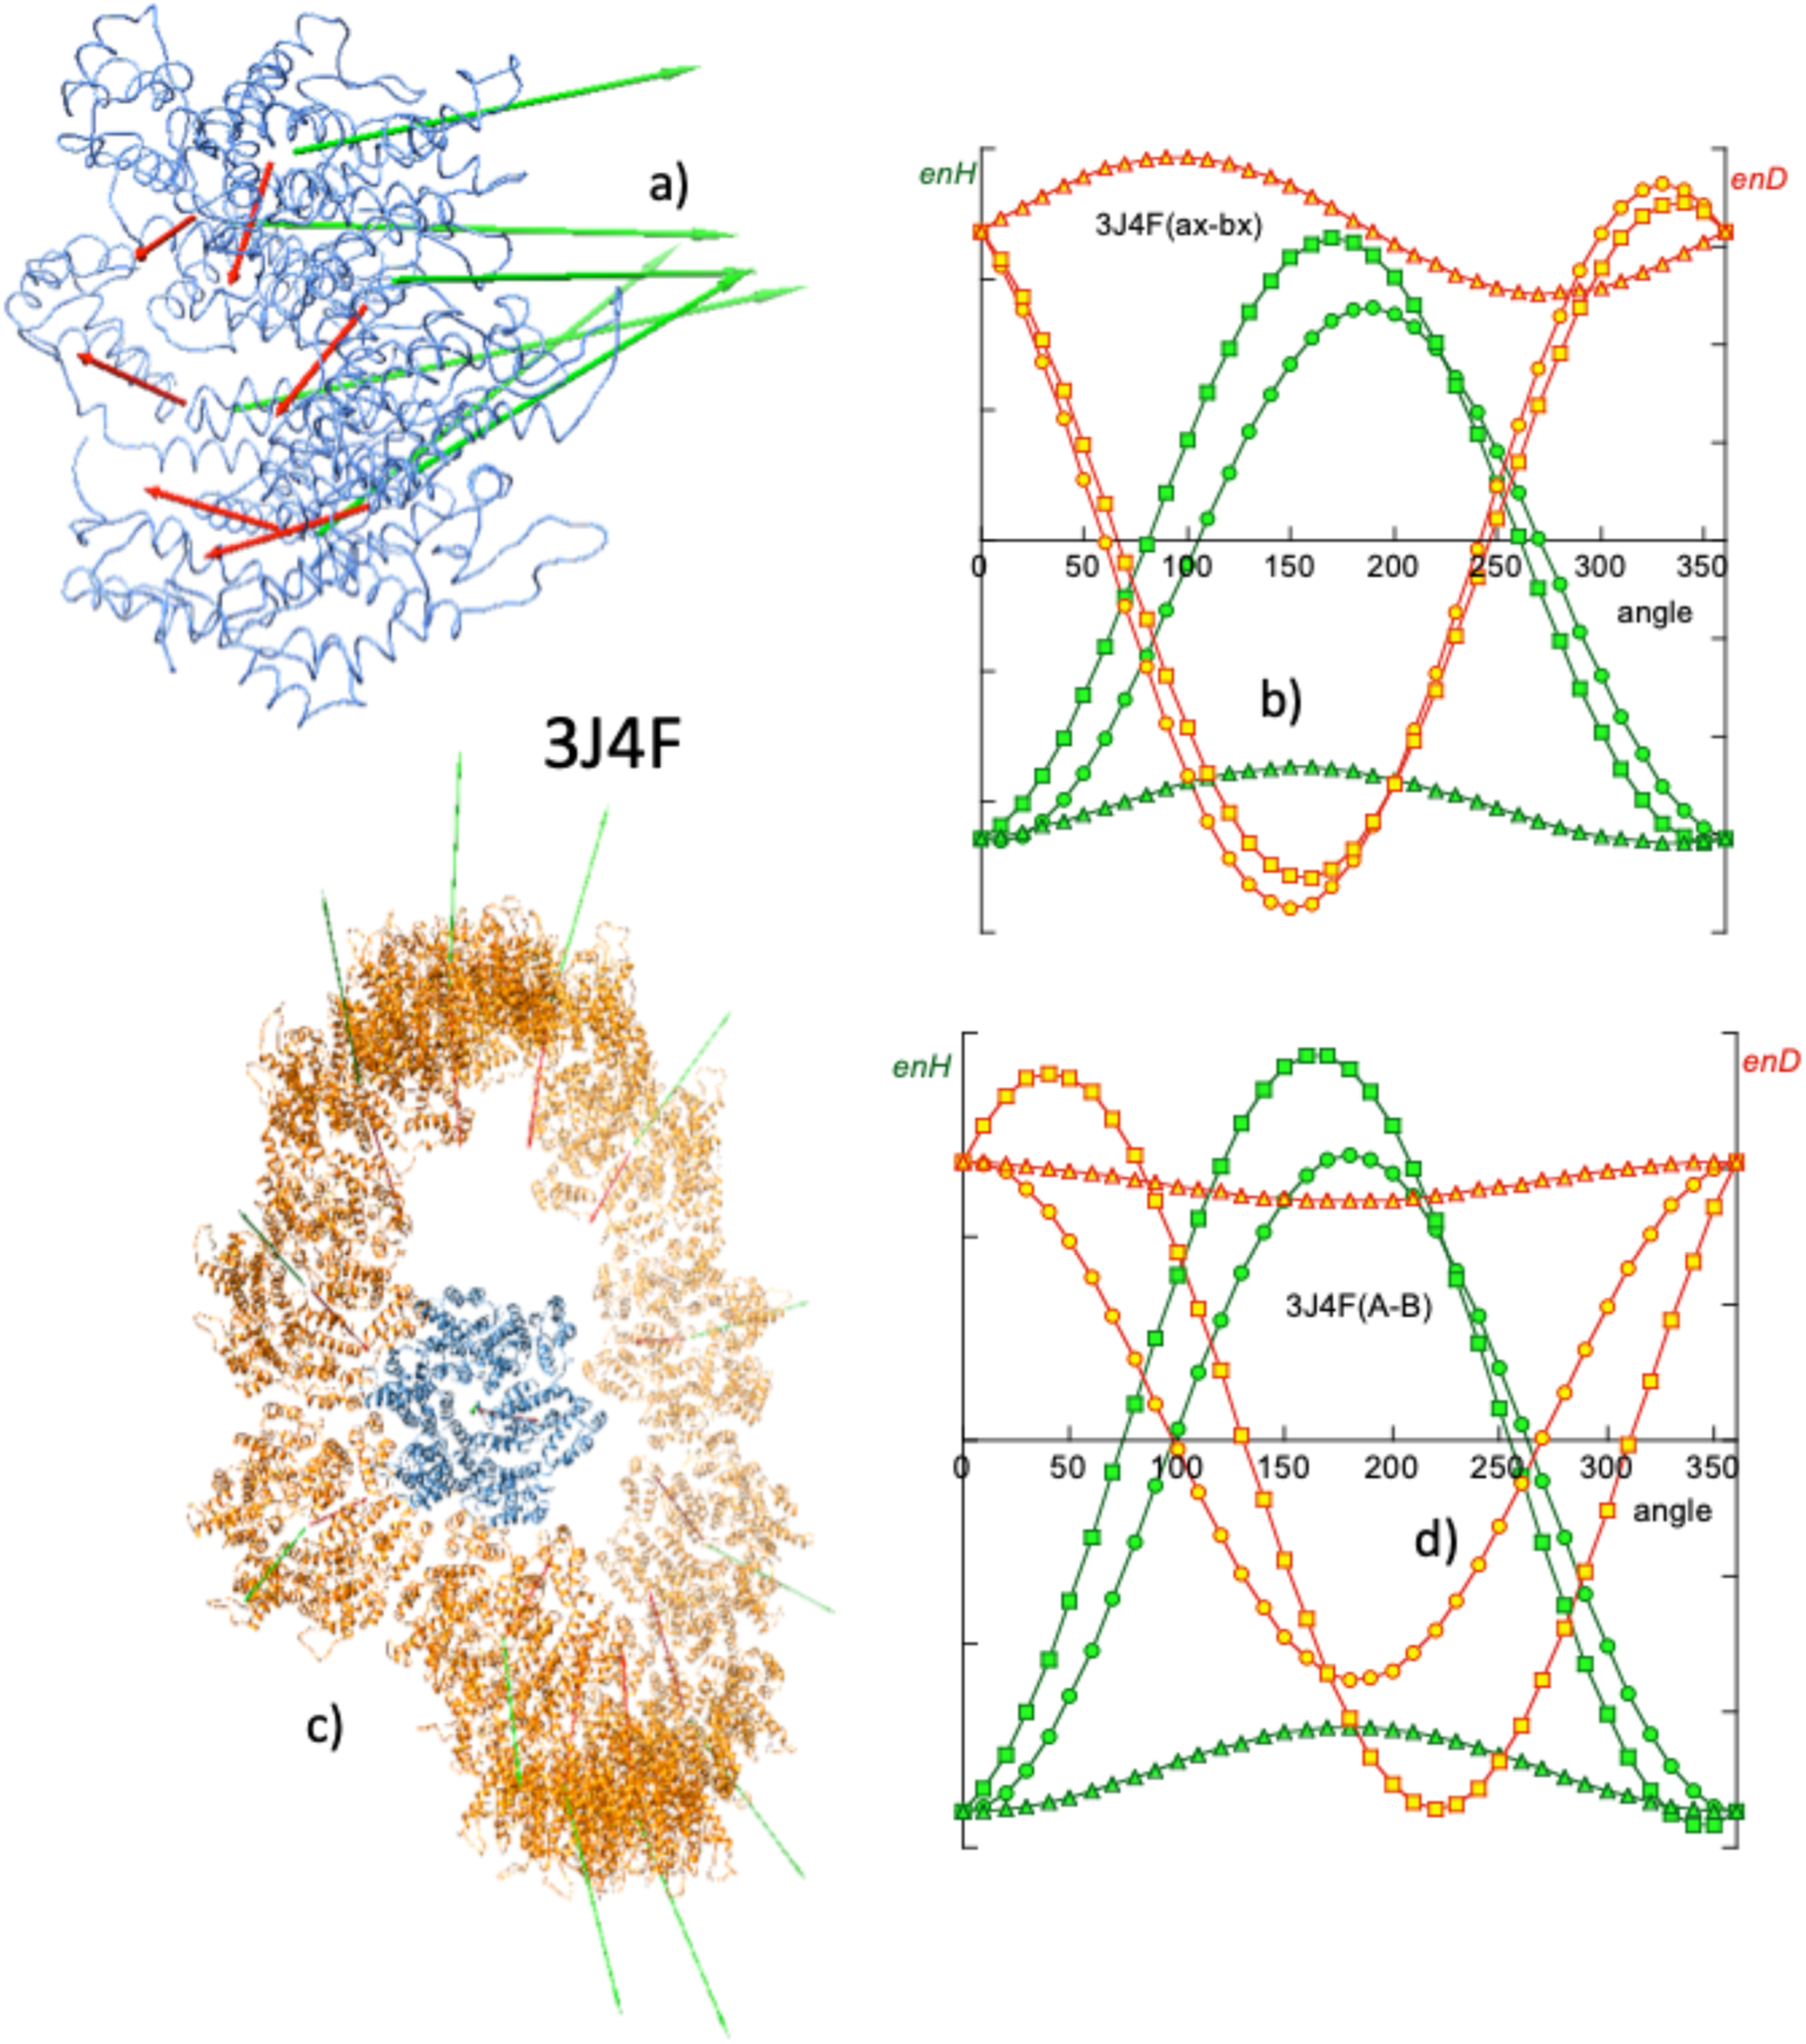
Fig. 10. Helical growth of the HIV capsid tubule (PDBid: 3J4F). (a) The basic monomer of growth is a hexamer whose elements have H vectors with components quasi-perpendicular to the plane of the hexamer. (b) Angular distribution of energies enH and enD, in simulations of the rotation of two contiguous monomers, revealing an attractive and symmetric hydrophobic interaction in opposition to the repulsive electrostatic interaction. (c) View of a turn of the helical growth of the tubule, showing the H and D vectors of each hexamer that lie very close to the plane of the spiral. The association is hydrophobic, but in this case, due to steric hindrances, the 12 elements do not close on themselves leaving element 13 above element 1 and thus determining the helical growth. This is reflected in a certain asymmetry in the distribution of enH (d) in rotation simulations.
Zhao et al. observed from directed mutagenesis experiments that hydrophobic interactions are critical in maintaining tubule structure. In particular, they consider the trio of adjacent amino acids I201, A204 and E213, each of three adjacent hexamers in contact, very important for the hydrophobic interaction (Zhao et al., Reference Zhao, Perilla, Yefenyuy, Meng, Chen, Ning, Ahn, Gronenborn, Schulten, Aiken and Zhang2013). Our computation of the H and D vectors in these species (Fig. 10) confirms and qualifies these observations.
At the level of a single hexamer, as can be seen in Fig. 10a, the H vectors of the components are mostly directed perpendicular to the plane of the hexamer. As seen above in the case of closed systems, the components of the H vectors in the plane of the hexamer cancel out. This quasi-parallelism between the H vectors complies for the BM model, implying a hydrophobic attraction among the six monomers and maintains the structure of the hexamer. Also, the components of the D vectors in the plane of the hexamer cancel out, leaving a perpendicular resultant. In this case the electrostatic force opposes the stability of the hexamer. From the energy point of view, being the hexamer a closed system, the interactions between the monomers give rise to observations similar to those described in the section on closed systems. In a simulation of the rotation of a monomer with respect to its immediate companion, a fairly symmetric angular distribution of enH is obtained. The native position (0° rotation) is at the minimum of attractive hydrophobic energy, while the electrostatic interaction (enD > 0) is repulsive.
From Fig. 10c it can be seen that each turn of the tubule is made up of 12 hexamers forming a hydrophobically attractive association, whereas electrostatic interaction is repulsive, as the D vectors also lie quasi-parallel. The angular distribution of enH is quasi-symmetric, revealing the fact that the vectors H are only quasi-parallel. In the absence of other restrictions, the lateral association of the hexamers would be linear, keeping their H vectors parallel according to the BM model. In the case of these species, the lateral fit of the neighbouring monomers forces the hexamers to form a circle. Other spatial incompatibilities prevent the circle from closing in on itself and hexamer no. 13 reaches above the first one. This is a case in which the BM effect, together with steric restrictions and probably the electrostatic repulsion effect, results in a helical assembly. A very interesting derivation of this type of treatment with mutations lies in the fact that making the structure more stable is not necessarily what is most desirable in terms of effectiveness.
Cell polarity scaffold protein. Assemblies formed from electrostatic interactions are not as frequent as those hydrophobically driven, but they are also illustrative as examples of the application of vector analysis.
Par-3 is the N-terminal segment of the Par-3/Par-6/atypical protein kinase C complex (Zhang et al., Reference Zhang, Wang, Chen, Zhang, Gao, Gao, Zhang, Dong, Basenbacher, Gong, Zhang, Sun and Feng2013). The important function of this protein is signalling for cell polarity and its structure has been determined by cryo-EM (PDBid: 3ZEE) as a tubule that grows helically. These authors determined that the self-assembly of this system is carried out via electrostatic interactions. The monomers are arranged in a ‘front-to-back’ manner, forming an angle of about 45° between the axes of their respective α-helices.
The moment vector characterization of this system is presented in Fig. 11 and reflects the arrangement described by Zhang et al., Fig. 11a highlights the first two monomers, A–B of the assembly. Their respective H vectors form an angle of 41°, while the D vectors form an angle of approximately 44°. These orientations put both vectors in a ‘quasi-row’ arrangement, making the electrical interaction attractive, while the hydrophobic interaction is repulsive.

Fig. 11. (a) Meridian and (b) lateral views of a turn of the helical growth of the N-terminus of Par-3 of atypical kinase C (PDBid: 3ZEE), reported by Zhang et al. (Reference Zhang, Wang, Chen, Zhang, Gao, Gao, Zhang, Dong, Basenbacher, Gong, Zhang, Sun and Feng2013). Due to the relative orientation of the H and D vectors of the A and B monomers in a ‘front to back’ or ‘quasi-row’ (see main text), the assembly is driven via electrostatic forces, opposed by a hydrophobic repulsion. It should be noted that in the simulation of rotations of B around A, asymmetric enD and enH curves appear, reflecting the deviation from a purely aligned relative orientation between the monomers. In this system, arguments similar to those mentioned in the former case (3J4F system) can be invoked to justify the helical growth. This ‘front-to-back’ association has to comply with steric conditions, while also overcoming hydrophobic repulsion. This makes the monomers associate in a circle that cannot close on itself.
The computation of the interaction energies enH and enD, as well as the simulations of the rotation of monomer B around monomer A, clearly demonstrates the electrostatic nature of this self-assembly. Figure 11c shows the angular variations of enH and enD in which it can be seen that enD is negative at the origin, as well as the asymmetry of its variation with the angle of rotation, which reflects the deviation of their directions. enH shows a marginally repulsive interaction between the A and B monomers in their native position (0°) and an asymmetric angular distribution.
Systems with DNA: transcription systems
In a previous section, pioneering work on the determination of dipole moments of DNA and chromatin has been mentioned. As is known, despite its net negative charge, DNA in aqueous solution does not present a permanent electrical dipole moment. Only in association with other proteins it is capable of presenting a significant EDM (Eletric Dipole Moment) (Frederic and Houssier, Reference Frederic and Houssier1973; Palau et al., Reference Palau, Mozo and Querol1980, Reference Palau, Mozo and Querol1983).
The structure of DNA is one of the most studied and as far as these authors perceive, it is classically considered that what joins the two strands of DNA are the hydrogen bonds established between them. However, more recently, the hydrophobic nature of the base stacking has been emphasized (Feng et al., Reference Feng, Sosa, Mårtensson, Jiang, Tong, Dorfman, Takahashi, Lincoln, Bustamante, Westerlund and Nordén2019; Xiao et al., Reference Xiao, Chen, Wei and Tian2020; Lindman et al., Reference Lindman, Medronho, Alves, Norgren and Nordenskiöld2021) as the ultimate force driving the formation of hydrogen bonds. This subtlety of hydrophobic interactions in DNA is also shown in the interactions of DNA with its interacting proteins. This property is manifested particularly in transcription systems.
Most of the transcription systems reported in the PDB consist of proteins or protein fragments attached to a more or less long fragment of DNA. Within this DNA fragment there is a segment, generally referred to as ‘consensus’ or ‘motif’ DNA, with which the protein interacts. The majority of these consensus DNA are palindromic segments. Due to its chemical constitution (bases and phosphate groups) and its spatial configuration (helical structure with phosphate in the exterior and hydrophobic bases in the interior), DNA exhibits a significant hydrophobic moment. This moment is due to the individual contribution of the hydrophobic moments of its bases. Each of these moments is generated by the ‘hydrophobic polarization’ derived from nucleotides being very hydrophobic (see Table SI) and the phosphate groups being electrically charged and thus, hydrophilic. Therefore, the hydrophobic moment of each base lies down in its plane. The total moment of the DNA molecule considered is thus the vector resultant of all the moments of the bases of which this fibre consists. It should be noted that this moment has an interest considered locally, since it depends on the length of the DNA reported in the PDB. Another notable aspect is that for straight DNA fragments, the hydrophobic moment is a vector perpendicular to the axis of the DNA. Therefore, DNA H vectors forming non-right angles to the axis can reveal aspects of curvature of the DNA fragment.
Transcription systems are considered particularly suitable for vector analysis under the BM effect because in general they involve rather short DNA fragments. In previous sections we have seen the fundamental role that hydrophobic interactions have in most protein self-assembly processes to form all kinds of complexes. This role of hydrophobic interactions, however, is not limited only to proteins but it is also used to form very specific complexes between proteins and DNA. In the particular case of transcription systems, very specific protein sequences bind to very specific DNA sequences (consensus or motif sequences). These consensus sequences, and not others, are the ones that drive the formation of specific hydrogen bonds between DNA and the protein, giving rise to specific biological functions.
As described by Hancock et al. (Reference Hancock, Stella, Cascio and Johnson2016), the abundant Fis nucleoid protein selectively binds to poorly related high-affinity DNA sequences (PDBid: 5E3L, Fig. 12a), in order to regulate various DNA reactions. According to these authors, Fis binds to selected target sites by reading the conformational properties of DNA sequences. To test the fundamental role that the hydrophobic force plays as an intermediate interaction between the nonspecific electrostatic interaction and the very specific hydrogen bonds, Mozo-Villarías et al. (Reference Mozo-Villarías, Cedano and Querol2021) carried out a series of tests using this transcription system. The protein of this system was simulated to slide along the DNA sequence (see procedure in Supplementary material). Figure 12b shows the hydrophobic energy enH of interaction between the Fis protein and the consensus DNA (TTT GAA TTT TGA GG), obtained by Eq. (11) in the simulated 3D rotation of the protein with respect to the DNA. In this particular case minimum energy is reached only for two rotations directions (x-, z-) and only near minimum for the y-direction, probably due to steric clashes. This rotation simulation was repeated for different positions of the protein when it was made to slide from its native position, along the DNA. Figure 12c shows a plot of enH as a function of the position of the protein as it moves away from its original native position, measured with respect to the original position with the DNA. Figure 12d is a plot of enH measured relative to the new contact on the DNA, as the protein moves away from its native position. Note that the native position exhibits the minimum enH as shown in both Figs 12c and d.

Fig. 12. (a) Transcription system nucleoid protein Fis–DNA complex (PDBid: 5E3L) as described by Hancock et al. (Reference Hancock, Stella, Cascio and Johnson2016). The green colour of the DNA represents the consensus DNA. Green arrows are the H vectors of both the protein and the consensus. The blue arrow is the H vector of the whole DNA. The red arrow is the protein D vector. (b) Rotation simulation of protein Fis around DNA (blue symbols) and around consensus DNA (sequence TTT GAA TTT TGA GG, green symbols). enH in the native positions is slightly above zero for Fis–DNA and negative for Fis-consensus. Sliding simulations: (c) and (d) Fis protein is made to slide along DNA and enH is computed. In (c) enH is computed taking the original native position on the DNA as reference (red spot). (d) enH is computed taking the new DNA spot as reference (orange dots).
Another test was carried out by reversing the orientation of the protein from its native position with respect to that of the DNA, as tested in Mycobacterium tuberculosis DnaA-DBD in complex with box1 DNA (Tsodikov and Biswas, Reference Tsodikov and Biswas2011). The protein attached to the consensus TTGTC (PDBid: 3PVV) was reversed from its original orientation (Mozo-Villarías et al., Reference Mozo-Villarías, Cedano and Querol2021)). Again, the original native configuration rendered the minimum value of enH obtained for some simulated variants of reversed positions of the protein (results not shown). Also, in its native position the number of hydrogen bonds was found to be maximum.
Future perspectives
As has been seen so far, the BM model, derived from the use of vector moments in all types of biological assembly, seems to apply to all macromolecular fields in which assemblages are involved. The success of this model may have applications in other related fields. Three fields are suggested here in which preliminary tests have already yielded some fruits, such as nucleosome structure, nascent protein and folding pathway, and the relationship between domains and multitasking function (moonlighting) as summarized in Fig. 13.

Fig. 13. (a) Front and side views of a nucleosome (PDBid: 3AFA) in which the H vectors of each of the bases are represented; cyan, AT; violet GC. The histone octamer, in light brown with its H (green) and D (red) vectors. The total H vector of DNA is in dark blue. (b) Top plot: Triple plot obtained by Prat Gay et al. (Reference Prat Gay, Ruiz-Sanz, Neira, Corrales, Otzen, Ladurner and Fersht1995) of the evolution of the conformation of barnase: ellipticity, fluorescence and binding to ANS. Bottom plot: Plot of the angle between the partial hydrophobic moment and the final hydrophobic moment (taken as reference), as a function of the number of amino acids (green); analogously the electric dipole moment (red) and the angle that H and D form at each moment (blue) of the growth. Note a shift of 20 amino acids between both top and bottom plots. Prat Gay et al. (Reference Prat Gay, Ruiz-Sanz, Neira, Corrales, Otzen, Ladurner and Fersht1995) used a protein missing the first 20 amino acids. There is a clear parallelism between the results of both Prat Gay et al. and BM methodologies (note the main transitions shown between the two vertical dotted lines). (c) Mutual interaction between different domains in a protein (PDBid: 1J1B). Bottom plot: Simulation of the rotation of domains A and C within the protein. Except for an electrically repulsive interaction between domains B and C, the other interactions are attractive in the case of this protein.
Nucleosome structure
The transcription systems reported in the PDB usually consider relatively small fragments of DNA. However, the considerations made in the previous section can also be applied to DNAs of any length and in particular to the DNA in the nucleosome. As seen previously, the hydrophobic moment vector of a given DNA is the resultant vector obtained by adding the individual hydrophobic vectors of all the bases. Figure 13a shows the hydrophobic moment vectors of each base of the DNA in the nucleosome (PDBid: 3AFA). The individual moments lay in the plane of their bases and are quasi-perpendicular to the DNA axis. By adding these vectors, a resultant H vector is obtained located in the plane of the nucleosome. For its part the histone octamer has its own H and D vectors. The D moment of the octamer interacts locally with the induced dipole moments distributed helically along the DNA double turn fibre. These induced dipoles are formed by the negative charge of the phosphate groups and the positive charges of the ions of the polar medium and they are credited for the main affinity of the histone octamer to the DNA. The total hydrophobic moment of the octamer also interacts with that of the DNA. This is an attractive interaction as is suggested in Fig. 13a by the relative positions of both vectors. However, since each nucleosome has a different base composition, the direction and modulus of its H vector varies among nucleosomes. There may be cases in which this hydrophobic interaction with that of the histone octamer may be minimal (but never repulsive). Unfortunately, it would be necessary to dispose of more 3D structures of nucleosomes with different sequences to check on this issue.
Another interesting point for a future study is related to the interaction between nucleosomes. The H vectors of the nucleosomes should be attracted due to the BM effect, forcing them to couple in parallel. This fact is in agreement with the interdigitated solenoid model (Dabán and Bermúdez, Reference Dabán and Bermúdez1998; Collepardo-Guevara and Schlick, Reference Collepardo-Guevara and Schlick2014).
Nascent protein and folding pathway
A possible and promising application of the parameters studied in this review is the study of the birth and evolution of proteins. Pioneering work by Prat Gay et al. (Reference Prat Gay, Ruiz-Sanz, Neira, Corrales, Otzen, Ladurner and Fersht1995) applied various biophysical techniques to the study of conformational changes of the serine proteinase inhibitor CI-2 (PDBid: 2CI2). Prat Gay et al. produced 10 fragments of this inhibitor of increasing lengths from the N-terminal (5, 13, 25, 28, 40, 50, 53, 60, 62 and 63 amino acids) and subjected them to independent tests with fluorescence techniques, circular dichroism and binding to the hydrophobicity exposure marker ANS (8-anilinonaphthalene-1-sulphonate) in order to establish their degree of secondary structure. With these experiments, these authors tried to characterize the so-called ‘molten globules’, that is, intermediate 3D structures prior to the final native folding. Figure 13b shows the overlapping variations of the parameters measured with these three techniques as a function of the length of the peptides. According to the conclusions reached by these authors, this small protein gradually acquires 3D structures and it is from amino acid 40 that major changes give rise to the native structure.
A preliminary study carried out by our group found behaviour compatible with that reported by Prat Gay et al. Fig. 13b (bottom plot) shows the variations suffered by the angles formed by the H (or D) vectors of the fragments with the Hf (or Df) vector that corresponds to the final native structure, as the number of amino acids incorporated increases. Likewise, the angle formed by H and D vectors in each state of growth is also plotted since this angle must reflect major structural changes. From these variations we reach conclusions similar to those of Prat Gay et al., in which it is observed that the chain is completed when reaching 80% of the total sequence.
Multitasking proteins and domains (moonlighting)
Since the appearance of the first multitasking protein databases (Franco-Serrano et al., Reference Franco-Serrano, Hernández, Calvo, Severi, Ferragut, Pérz-Pons, Piñol, Pich, Mozo-Villarías, Amela, Querol and Cedano2017), an interesting double problem arises. On one hand the possibility of the determination of the domains in proteins was raised. On the other hand, the assignment of functions – both canonical and moonlighting – of a multitasking protein, related to those detectable domains was also considered. A simple example is shown by the case of the tau-protein kinase, TPK I/GSK3b (PDBid: 1J1B). This enzyme consists of three domains (Aoki et al., Reference Aoki, Yokota, Shigiura, Sasaki, Hasegawa, Okumura, Ishiguro, Kohno, Sugio and Matsuzaki2004) and the potential offered by the analysis of moment vectors, D and H, is to be able to refine the establishment of subdomains. Figure 13c (top row) shows this protein indicating its D and H vectors of the three domains.
Also in Fig. 13c, the variations of enH and enD of the interactions of two of the three domains (A–C) are represented. It was found that except for the electrical interaction between subdomains B and C, all the interactions (electric and hydrophobic) are attractive (data not shown). These interactions, especially the hydrophobic ones, are relatively asymmetric, revealing a rather marginal character, since their relative native positions are far from the minimum energy positions. Aoki et al. noted that an ATP molecule is inserted between the A and B domains (catalytic site). It can be expected that the interactions between domains are rather marginal, thus implicating the investment of a minimum of energy in their catalytic function if it involves conformational changes.
Concluding remarks
The importance of hydrophobic interactions in the building and maintenance of the 3D structure of proteins has been known for a long time. In this review we extend and emphasize the preponderance that hydrophobic interactions also have in the assembly and maintenance of the structure of macromolecular biological systems in the maintenance of life. In most instances these interactions have to compete with repulsive electrostatic interactions and steric hindrances, always resulting in highly nuanced and diverse structural results.
The analytical formalism using electric and hydrophobic dipole moment vectors for the elucidation and characterization of macromolecular structures has grown in recent years to become a powerful predictive tool. It has allowed the detailed analysis of 3D structures ranging from simple antimicrobial peptides to mechanisms of amyloid formation to large protein assemblies in the formation of microtubules and interactions of proteins with nucleic acids. In this review it is shown how the relative magnitudes and orientations of the D and H vectors and their variations are able to describe and predict the behaviour of monomers in their ability to assemble. In this description, a given protein is associated with a set of vectors, D and H, allowing the prediction of its behaviour interacting with other protein vector sets. The use of these vectors has been a very useful tool to establish the validity of the BM effect and open new fields of exploration.
Supplementary material
The supplementary material for this article can be found at https://doi.org/10.1017/S0033583522000038.
Acknowledgements
This research was supported by the Ministerio de Economía y Competitividad of Spain [BFU2013-50176-EXP and BIO2017-84166R] and by the Centre de Referència 449 de R + D de Biotecnologia de la Generalitat de Catalunya. We thank Mrs. Lynn Strother for revising the English text. Parts of Figs 2, 3, 4 and 13 are reproduced with permission of their Editors.


