I. INTRODUCTION
Rietveld X-ray diffraction (XRD) analysis has been increasingly used in the aluminum industry since the beginning of the 1990s. Initial applications involved predominantly raw materials and selected products. During the last few decades, its use expanded to every stage of aluminum production and presently Rietveld analysis has become a recognized analytical technique, applied routinely in bauxite exploration, reduction, and fabrication processes. Typical Rietveld applications in the aluminum industry at present are listed in Table I. The number of crystalline phases determined represents usual industrial requirements, and may vary between laboratories. The conventional cavity slide sample preparation technique is the most commonly used for the applications. The success rate of Rietveld application, understood as accuracy and reliability of obtained information, obviously depends on the matrix.
Table I. Typical Rietveld applications in the aluminum industry.

Rietveld analysis not only helped to replace traditional XRD calibration methods, but also opened the door for new applications previously not possible. The use of the Rietveld method to characterize selected materials unique to the aluminum industry (e.g. bauxite, red mud, alumina, electrolytic bath, spent potlining, and dross) became routine at present. As there is too much to cover in one paper the content was divided into two parts. This paper deals with industry raw materials (bauxite, red mud, and alumina). The paper will also present how synchrotron-based diffractograms obtained for bauxite and red mud samples allowed a much better understanding of mineralogical representation, and made it possible to leverage their Rietveld quantification. The second part will appear at a later time and will cover Rietveld characterization of materials such as electrolytic bath, spent potlining, and dross.
II. BAUXITE
Aluminum-bearing minerals constitute a group of raw materials vital to the aluminum industry. Bauxite, a hydrated aluminum material is the primary raw material used in the Bayer process. Other materials of concern, such as clay, red mud, and sand are waste products. Clay is obtained during bauxite washing, whereas red mud and sand appear during the bauxite digestion process.
An accurate estimate of bauxite quality being surveyed, mined, and supplied is important for efficient operation of a mine and a Bayer plant. Traditional methods used to determine bauxite phase composition are based on wet chemistry (WCh). They are relatively slow and require a large supply of chemicals as well as considerable space and manpower. Compared with WCh, XRD offers speed and much lower cost of analysis, but is less accurate. Conventional XRD (equipped with an X-ray tube) is known to be seriously affected by the sample's amorphous content (Figures 1 and 2). In Figure 1 gibbsite (GIBB) is underestimated by approximately 8% and in Figure 2 it is overestimated by the same amount with respect to WCh and mass balance calculations. As a result of low X-ray power, the limit of detection (LOD) of phase constituents is relatively high (Ni and Khalyapina, Reference Ni and Khalyapina1978). Known applications of Rietveld analysis to bauxite are very limited (Bennett et al., Reference Bennett, Walker and Aylmore1999). It was believed that synchrotron patterns with much better signal-to-noise ratios would help provide new information that cannot be obtained with X-ray tube instrumentation (Feret and See, Reference Feret and See2010). It was also expected that the diffractograms would largely overcome the amorphous content drawback, thus seriously plaguing analysis of bauxite and red mud material using conventional XRD.

Figure 1. Example 1 of Rietveld data for bauxite.

Figure 2. Example 2 of Rietveld data for bauxite.
The samples for the synchrotron experiments were ground to −325 mesh and packed into a thin wall glass capillary (Feret and See, Reference Feret and See2010). Diffractograms were recorded at the Japan Synchrotron Radiation Research Institute (JASRI) at wavelengths of 1.002 and 0.202 Å and covered 5–75°2θ and 0–15°2θ ranges, respectively. The effect of the power of synchrotron radiation on bauxite diffractogram can be appreciated in Figure 3 which gives a comparison of diffractograms of BXT-12 (RTA (Rio Tinto Alcan) bauxite standard) from the 1-Å, 0.2-Å synchrotron and 1.54-Å CuKα radiation sources. The synchrotron diffractograms are not only much more intense, but also contributing much less to the background and individual peaks are much better defined than in the case of the 1.54-Å radiation. The 0.2-Å source diffractogram simply dwarfs two other diffractograms by a large margin. The first two peaks from kaolinite and boehmite (BOEH) are very well defined on the 0.2-Å source diffractogram.

Figure 3. Comparison of diffractograms of BXT-12 from three sources.
To characterize all bauxite samples involved in the project, WCh, BQuant (Kimmerle and Feret, Reference Kimmerle, Feret and Feret1997), X-ray Database (XDB) Hungalu (Sajó, Reference Sajó1994), X-ray fluorescence (XRF) (Feret, Reference Feret1993), and TGA determinations were carried out, in addition to Rietveld-X-ray diffraction (XRD) investigations.
Rietveld-XRD quantification results of RTA bauxite reference materials using the 0.2-Å source diffractogram are presented in Figures 4 and 5. In Table II, major phase concentrations obtained for BXT-12 are compared. GIBB is to some extent overestimated and BOEH concentration is underestimated using synchrotron and the X-ray tube diffractogram in connection with the Rietveld method. BOEH concentration is lower from the 0.2-Å source diffractogram than from other sources. By contrast, Al-goethite (GOET at 3.2%) is clearly confirmed in BXT-12 bauxite contrary to conclusions from a conventional X-ray tube-based diffractogram. Anatase (ANAT) in Table II represents the sum of ANAT and rutile.

Figure 4. Rietveld data for BXT-12.

Figure 5. Rietveld data for BXT-02.
Table II. Comparison of phase concentrations for BXT-12.

Figures 5 and 6 illustrate Rietveld-XRD results for BXT-02 and BXT-08 and confirm diaspore and ilmenite, respectively; which are impossible to quantify at low content using an X-ray tube diffractogram.

Figure 6. Rietveld data for BXT-08.
Besides the phases appearing in Figures 4–7, additional phases such as calcite, dolomite, magnetite, magnesite, chamosite, illite, muscovite, hausmanite, manganite, chabazite, and others may also appear in small quantities, depending on the bauxite deposit.

Figure 7. Comparison of GIBB concentrations.
A concentration correlation for GIBB reveals that the X-ray tube – Rietveld concentrations of GIBB are mostly overestimated, sometimes largely, with respect to WCh concentrations (Figure 7). The main reason is most of the time because of underestimated BOEH, kaolinite, and goethite. Since the Rietveld-XRD analysis normalizes all concentrations to 100%, increasing content of the major constituent (GIBB) compensates for whichever part of the matrix is missing. The correlation curve also demonstrates that the synchrotron diffractograms and XDB interpretations help obtain the best correlation with WCh.
Rietveld-XRD determinations employing X-ray tube diffractograms tend to strongly underestimate kaolinite. This is evident from the XRF-WCh mass balance. The underestimation convincingly suggests that a part of kaolinite must be X-ray amorphous. By contrast, the synchrotron data are much less affected by the kaolinite's amorphous content effect. BQuant's k.SiO2 correlation appears good as this determination was modeled on RTA standards and they form a majority in the studied group. The XDB mass balance calculations of %SiO2 in kaolinite (%SiO2 – % quartz) provide the best fit with the WCh data given low SiO2 content.
The synchrotron study helped validate the analytical methods employed for bauxite phase quantification and has changed our understanding of the bauxite matrix. Kaolinite and goethite, in particular, were already believed to be partially amorphous. However, contrary to past beliefs, even GIBB and hematite may appear partially amorphous. The problem of bauxite amorphous content, although anticipated, was shown to have a profound effect on quantification of selected phases using Rietveld and XDB methods and X-ray tube diffractograms. To put it simply, if a part of the bauxite matrix is X-ray amorphous, it does not contribute to a diffractogram. If several mineral contributions are missing on diffractogram simultaneously, they can be quantified as a group, but not individually. The bauxite amorphous content, believed to be at the level of a few percent, appears to be much higher than that.
Despite high expectations, the synchrotron data did not allow obtaining the phase concentrations equivalent to WCh or mass balance calculations for several bauxites. Although powerful, synchrotron radiation does not overcome all of the amorphous content in bauxite. On the other hand, synchrotron data, especially from the 0.2-Å source, results in a more detailed study on bauxite than conventional XRD.
III. QUANTIFICATION OF QUARTZ IN BAUXITE
Quartz is an important phase constituent of any bauxite and may vary from a small fraction to over 60% of the total SiO2 concentration. At present, the most practical method of estimating quartz is by WCh or using conventional XRD methods. Whether employing a direct or Rietveld approach the XRD method is difficult, and not possible for small quartz concentrations because of severe line overlaps.
A new method devised for quantification of quartz in bauxite uses material calcined at 1000 °C (Feret and Roy, Reference Feret and Roy2002). Major bauxite hydrated phases, such as GIBB, BOEH, kaolinite, and goethite are entirely decomposed in the calcination process. The calcination procedure converts kaolinite, the principal SiO2 carrier, into amorphous material. In addition to the amorphous portion, there are only four major crystalline phases present in the calcined material: corundum, quartz, rutile, and hematite (Figure 8). Depending on bauxite origin some secondary phases (e.g. hausmanite) can also occur. Corundum crystallizes from the decomposition products of major Al-bearing hydrates, mostly GIBB and BOEH. Quartz in the calcined bauxite corresponds to the primary quartz occurring in the initial sample. ANAT is readily converted by heat into the more stable rutile at temperatures as low as 400 °C. Rutile in the calcined sample is a product of primary rutile and the portion resulting from ANAT transformation. Rutile is employed as the internal standard. Hematite is a sum of primary hematite and hematite formed after goethite decomposition.

Figure 8. Rietveld quantification of calcined bauxite.
To determine quartz concentration corresponding to the natural basis, the quartz content from Rietveld analysis, Quartz (R), needs to be corrected for various dilution effects in one single step. Employing one simple correction equation the corrected quartz concentrations, % Quartz are:
 $$\% {\rm Quartz}={\rm Quartz}\; \left({\rm R} \right)\displaystyle{{{\rm t}{\rm .TiO}_2 } \over {{\rm Rutile}\lpar R\rpar }}$$
where t.TiO2 is the total TiO2 known from XRF and Rutile (R) is the rutile content from Rietveld estimate. All of the Ti detected by bulk analysis is present as rutile.
Material mass balance applies well to the quartz quantification problem. Accuracy of quartz determination with the new method corresponds to that obtained by the conventional “by difference” approach (Figure 9). This approach is based on total SiO2 determined by XRF and kaolinitic silica (Si150) determined by WCh. The study also proves that SiO2 determined in the low temperature digestion process (Si150) is because of kaolinite and illite and not just because of kaolinite as previously believed. This fact has an important implication for plants processing bauxite that contains illite.

Figure 9. Comparison of quartz (%) from WCh and Rietveld methods.
IV. OCCURRENCE AND CHARACTERIZATION OF Zn AND Mn IN BAUXITE
Zinc is one of the secondary elemental constituents occurring in Caribbean bauxite and the associated non-bauxitic material. It is generally believed that Zn in bauxite could either occur in gahnite or sphalerite, or substitute for Fe in goethite. Manganese represents an appreciable impurity in Caribbean bauxites and is identified on diffractograms as lithiophorite (Li,Al)MnO2(OH)2. As Zn has been observed to increase with the MnO content, the objective of the work was to better understand the mineralogical nature of Zn and Mn compounds. Data representative of 340 bauxite samples of different origin were assembled (Feret and See, Reference Feret and See2006). It was found that Zn in bauxite could not possibly substitute for Fe in goethite or hematite (Figure 10). Strong evidence was obtained that Zn occurs in the same compound as Mn. The application of the Rietveld method to characterization of diffractograms and other data suggest an aggregate, which we may call “zincophorite” Al(ZnxMn1−x)O2(OH)2. Based on the obtained records, the x parameter could vary from 0.02 to 0.24. The concentration data corresponding to the investigated group of samples are given in Figure 11.

Figure 10. Correlation of ZnO versus MnO and Fe2O3 in bauxite.

Figure 11. Concentration graph obtained for Jamaica “zincophorite”.
In Figure 11, concentrations of ZnO are plotted against the concentrations of MnO and zincophorite. The correlation between the ZnO and MnO content is strong. Some points representative of zincophorite are placed much below those of MnO at high ZnO concentrations. This suggests that a portion of lithiophorite might be X-ray amorphous.
V. RED MUD (BAUXITE RESIDUE)
Certain red mud samples were also analyzed with synchrotron experiments (Feret and See, Reference Feret and See2011). A dedicated control file containing all necessary crystallographic parameters was developed for quantification of 45 mineralogical phases in red mud. The maximum number of crystalline phases allowed during Rietveld refinement is limited on most commercial programs. Hence, the refinement was a tedious and time-consuming process beginning with phase confirmation and rejection, followed by Rietveld trials for a selected group of minerals. If a particular mineral was confirmed absent during the trial, it was replaced by another mineral. Given a large number of potential choices most minerals determined with a concentration below 0.5% were rejected as unreliable. Composition (%) of 28 different mineralogical phases in red mud matrix was determined: GIBB, bayerite, BOEH, kaolinite, ANAT, rutile, quartz, hematite, Al-goethite, sodalite, carnegieite, calcite, katoite-Si, brookite, ilmenite, portlandite, nepheline, perovskite, cancrinite-H2O, cancrinite-CO3, cancrinite-NO3, cancrisilite, carbonate-hydroxyl-apatite, zircon, nosean, diaspore, lawsonite, and schaeferite.
The phase identification process followed by Rietveld refinement involved four different Al–Na silicates: sodalite (Na8.08Al6Si6O28.88S0.98), cancrinite (Na7.14Al6Si6O31.6), cancrinite NO3 (Na7.92Al6Si6O31.56N1.74), and nosean (Na8Al6Si6O28S).
The concentrations in Figures 12 and 13 correspond to as obtained basis and are overestimated because of the X-ray amorphous portion of the sample material. To express content of the crystalline phases more realistically, the sample amorphous content needs to be determined first.

Figure 12. Example 1 of Rietveld data for red mud.

Figure 13. Example 2 of Rietveld data for red mud.
Red mud is known to be partially amorphous. Selected phases such as hematite, quartz, rutile, and ANAT are considered to be crystalline in the red mud matrix. However, phases such as sodalite or cancrinite are represented on diffractograms only to some extent. Hence, one of the objectives of the study was to verify whether synchrotron radiation could overcome the amorphous content problem. Initial Rietveld concentrations of the crystalline phases allowed calculation of concentrations for major element oxides: Fe2O3, CaO, and TiO2. Then, estimation of the sample amorphous content was made using concentrations obtained from Rietveld estimated phases and determined by XRF. For some samples, the corresponding mass balances between XRF and Rietveld data suggest the occurrence of important quantity of the amorphous material. Figure 14 illustrates a correlation between XRF and Rietveld data for Fe2O3 constituent. The Fe2O3 concentrations from Rietveld analysis are clearly overestimated.

Figure 14. Correlation between XRF and Rietveld data for Fe2O3.
In red mud samples, the average amount of the amorphous content was 18%, whereas the maximum was 33%. With the sample amorphous content increasing, the mass balance deficit for Na, Al, Si, and H2O also increases. This indicates that a hydrated sodium aluminum silicate (resembling sodalite) makes up most of the amorphous content. Moreover, red mud is very complex in terms of the number and type of residual and/or neo-formed possible crystallographic phases that might occur. The cycles of phase identification, Rietveld phase quantification, and mass balance calculations were carried out for all samples several times. Mass balance calculations provided a feedback triggering the beginning of a new cycle. In Table III, summary of the phase composition range is given.
Table III. Summary of the phase composition.

In spite of the time and effort spent on the evaluation stage, the study clearly indicates that by using high-quality synchrotron diffractograms the sample X-ray amorphous content is not overcome and the true sample composition is not known. Differences among mass balance estimates of the amorphous content for individual samples reflect limited accuracy of the method.
VI. CHARACTERIZATION OF ALUMINA
Similar to red mud, alumina is also produced in the Bayer process, in which crushed bauxite is digested with hot sodium hydroxide solution. One of the products is aluminum hydroxide which is then calcined. Depending on the degree of calcination, metallurgical or ceramic grade aluminas are obtained. They differ with respect to the alpha alumina content, grindability, particle shape and size, impurity content and so on.
The application of XRD for analysis of alumina in the aluminum industry dates back to the 1960s. Special aluminas (non-metallurgical grades) have always presented a major challenge (Feret, Reference Feret2000, Reference Feret2012). Aluminas may have a variety of morphological forms (Figure 15) for which there are marked differences in relative intensities of their major XRD reflections (the preferred orientation effect), Figure 16. Comparing intensities (whether peak height or integrated) of selected reflections from a sample with those of a reference material may cause a serious analytical error. If a reference standard is used in measurement of intensities for a selected reflection followed by quantification, then morphology of this standard must be of the same morphology as the unknowns.

Figure 15. Examples of morphological forms of ceramic alumina.

Figure 16. Superposition of two diffractograms from two ceramic aluminas of different morphology.
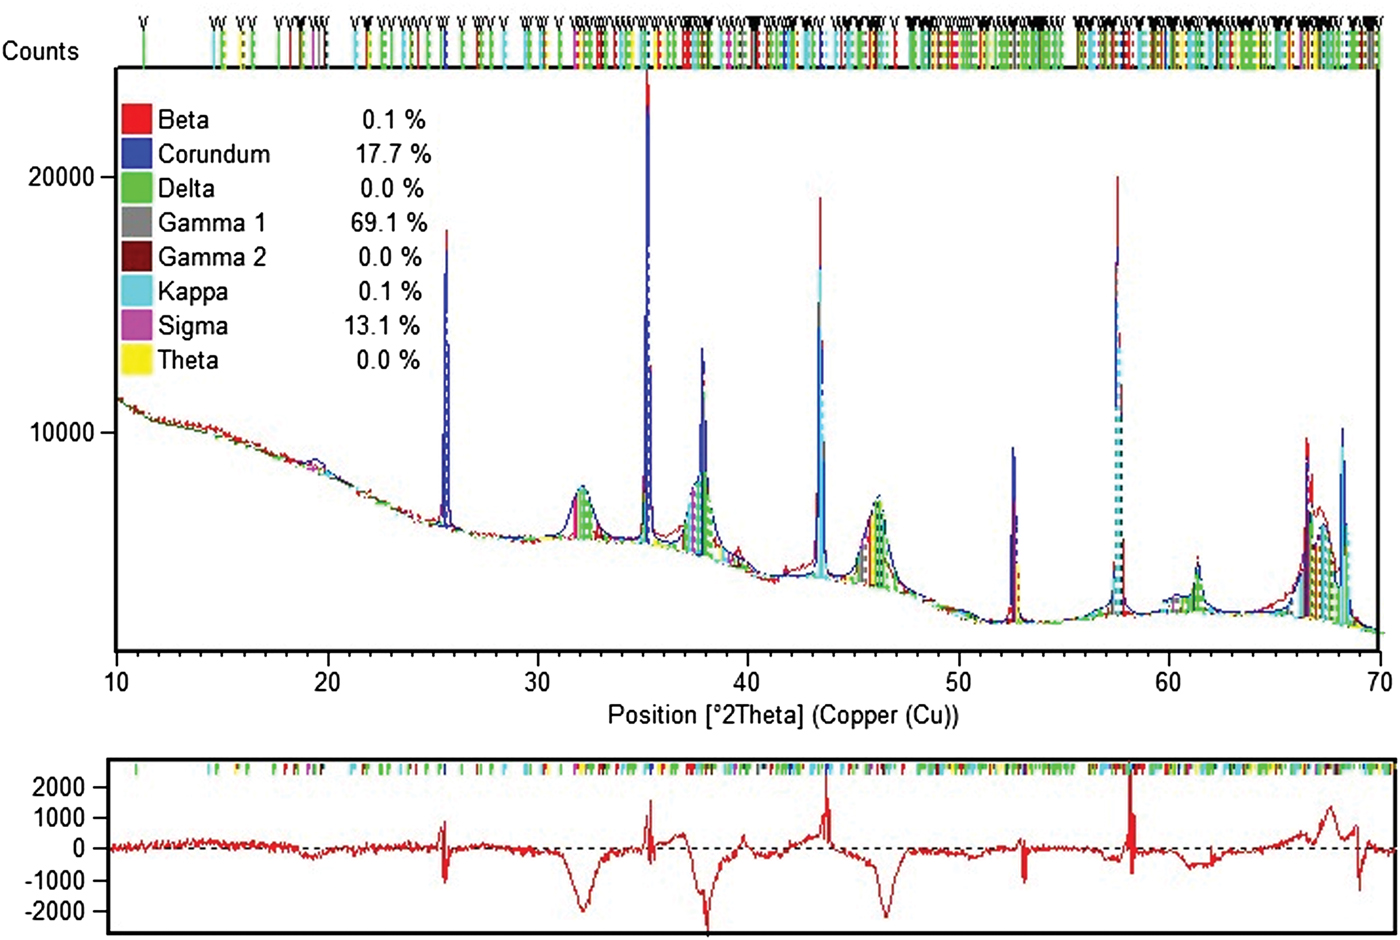
Estimation of occurrence of so-called sub-alphas (sub-alphas are phases other than alpha) is only possible with the Rietveld method. For quantification of metallurgical and special aluminas, a dedicated Rietveld analytical program was built with structure data for eight alumina mineralogical phases: alpha, beta (β-Al2O3 = Na2O•11Al2O3), delta, gamma (2), kappa, sigma, and theta, also GIBB. Figures 17–19 give unique examples of phase quantification in aluminas of various origin and phase composition using the Rietveld method.

Figure 17. Example of Rietveld data for ceramic alumina.

Figure 18. Example 1 of Rietveld data for sub-alpha specimen.

Figure 19. Example 2 of Rietveld data for sub-alpha specimen.
A. Scrubber alumina
Dry scrubber is the most modern and efficient system generally used to prevent all discharge of pollutants from the aluminum plant. Gases from each pot are exhausted into the dry scrubber in which alumina is used to clean fluorine compounds from the pot gas and the dust is collected in filter bags. Up to a total of 99.8% of overall fluorine is removed from the emissions.
Alumina from the dry scrubber, including bound fluorine mixed with dust, is called reacted alumina and is used in the pots as raw material. This recycling of fluorine in the dry scrubber reduces the need to purchase fluorine materials necessary to operate the pots. Although total F is typically analyzed by XRF or a table-top NMR, XRD is called upon periodically to verify unusual content of reacted alumina or a mixture of alumina and AlF3. Figure 20 gives an example of such analysis. Since most of the sample material is X-ray amorphous the Rietveld analysis gives an indication of distribution of AlF3 and crystalline alumina phases.

Figure 20. Rietveld analysis of reacted alumina.
VII. DISCUSSION
As the aluminum industry requirements for better process and quality control become increasingly important, Rietveld-XRD applications have been steadily increasing. From the technological beginning of aluminum manufacture (bauxite) to final manufacturing processes there is and will be a place for Rietveld analysis. Choice of a suitable X-ray instrument will always depend on the price and performance ratio and will be dictated by a particular application. The advantage of XRD as an analytical instrument lies in the variety of characteristic parameters it can measure, simplicity of sample preparation, and the ability to run analysis of a series of samples in an automatic mode. Hence, XRD is capable of responding to today's laboratory demand for even greater flexibility and task multiplicity. Given the fact that future Rietveld applications will be extended to materials such as new ceramics, environmental samples, and composites, it is obvious that XRD will remain universal and a very appealing analytical tool for the aluminum industry.
Accurate determination of Al2O3 distributed among various minerals is critically important for the industry as it affects the material's commercial value and its process performance. It is certainly not realistic to expect Rietveld analysis using an X-ray tube diffractogram to become an accurate tool in the phase quantification of a majority of bauxite. The Rietveld software cannot consistently provide reliable concentrations of GIBB, BOEH, Al-goethite or kaolinite (which are considered strategic) for most bauxite cases studied over the years. Hence, the application of the Rietveld method to bauxite exploration and exploitation is unquestionably limited. The major obstacle in the quantification process is the bauxite amorphous content, which originates not from one but from several sources simultaneously. There are numerous examples of bauxite diffractograms with missing representation of BOEH or kaolinite. Yet occurrence of these phases is confirmed by other methods. The total amorphous content of the bauxite matrix can obviously be quantified using the internal standard method, but assigning its parts to individual mineralogical constituents is impossible employing XRD alone. Synchrotron radiation cannot entirely overcome material's amorphicity either. The best proof of synchrotron radiation sensitivity to amorphous material is the contribution to diffractogram from the glass capillary which is obviously amorphous. Synchrotron diffractograms offer substantial advantages over diffractograms from an X-ray tube. Nevertheless, whether from synchrotron or from an X-ray tube, a diffractogram is seldom a sufficiently complete representation of the mineralogical content of bauxite sample, GIBB, being the most abundant phase and occurring partially amorphously is the major victim of Rietveld-XRD analysis of bauxite. Only very well crystallized bauxite from selected deposits can be successfully analyzed, at least for certain mineralogical constituents. Diasporic bauxite shows a better chance for successful phase quantification (Nong et al., Reference Nong, Yang, Zeng and Liu2007). Already, new non-XRD methods have emerged (mathematical modeling) (Kimmerle et al., Reference Kimmerle, Feret and Feret1997), which certainly erode traditional WCh and some Rietveld applications.