


1. INTRODUCTION
The laser-produced plasma (LPP) in the presence of an external magnetic field (B) has been widely used to study the plume confinement (Harilal et al., Reference Harilal, Tillack, O'Shay, Bindhu and Najmabadi2004; Roy et al., Reference Roy, Harilal, Hassan, Endo, Mocek and Hassanein2015), synthesis of nanoparticles (NPs) (Musaev et al., Reference Musaev, Sutter, Wrobel and Kruger2016), optical emission intensity enhancement (Rai et al., Reference Rai, Rai, Yueh and Singh2003a , Reference Rai, Singh, Yueh and Cook b ; Kumar et al., Reference Kumar, George, Singh, Joshi and Nampoori2011a ), pulsed laser deposition (PLD) (Kobayashi et al., Reference Kobayashi, Akiyoshi and Tachiki2002), micro-machining (Chang et al., Reference Chang, Kuo and Wang2012), and inverse pulsed laser deposition (IPLD) (Pandey & Thareja, Reference Pandey and Thareja2011). The optical emission spectroscopy (OES) can be used to optimize the plasma parameters (Thareja & Sharma, Reference Thareja and Sharma2006; Shukla & Khare, Reference Shukla and Khare2010) such as electron temperature, density, velocity of plasma expansion, which are important for potential applications in PLD (De Giacomo et al., Reference De Giacomo, Shakhatov, Senesi and Orlando2001), IPLD, micromachining, laser-induced breakdown spectroscopy (LIBS) (Pereira et al., Reference Pereira, Delaporte, Sentis, Marine, Thomann and Boulmer-Leborgne2005; Mostako & Khare, Reference Mostako and Khare2012), etc. From spectroscopic study of magnetically confined plasma with air as an ambient, it has been shown that the intensity of optical emission of plasma is enhanced in the presence of B (Rai et al., Reference Rai, Rai, Yueh and Singh2003a , Reference Rai, Singh, Yueh and Cook b ; Shen et al., Reference Shen, Lu, Gebre, Ling and Han2006; Guo et al., Reference Guo, Hu, Zhang, He, Li, Zhou, Cai, Zeng and Lu2011). It is attributed to an increase in the electron density and temperature of the plasma in the presence of B. LPP parameters affect the quality of thin film deposited via PLD (De Giacomo et al., Reference De Giacomo, Shakhatov, Senesi and Orlando2001). The synthesis and characterization of copper oxide NPs thin film using PLD (in air ambient/other gas/vacuum) (Ogale et al., Reference Ogale, Bilurkar, Mate, Kanetkar, Parikh and Patnaik1992; Jawad et al., Reference Jawad, Ismail and Yahea2011) have been studied extensively and reported that the copper oxide NPs of different size have potential applications as catalyst, solar cell, sensors, etc. (Wang et al., Reference Wang, Zhou, Fei, He, Zhang, Zhang, Peng and Xie2010). In IPLD, the backward motion of the ablated mass is utilized to deposit thin films on the target itself or substrate mounted on the target and it solely depends on the condition of the ambient atmosphere (Pereira et al., Reference Pereira, Cros, Delaporte, Georgiou, Manousaki, Marine and Sentis2004). The thin films deposited using IPLD contain less micron-sized particulates and exhibited dense structure compared with that deposited by PLD, especially at high ambient pressure (Szörényi & Geretovszky, Reference Szörényi and Geretovszky2005). Pereira et al. studied the characterization of plasma dynamics and surface nanostructuring of the laser-ablated target in air at atmospheric pressure and showed that the kinetic energy and density of plasma are the two key factors, which control the NP formation on the target (Pereira et al., Reference Pereira, Delaporte, Sentis, Marine, Thomann and Boulmer-Leborgne2005). Pandey and Thareja investigated the formation of nanostructures on the copper target via IPLD in the presence of B and ambient gas. It was observed that the size of NPs generated in the presence of B was larger than that without B (Pandey & Thareja, Reference Pandey and Thareja2011). They also carried out plasma spectroscopic measurements and correlated the characteristic properties of the deposited NPs with the plasma parameters. A recent study on the effect of magnetic field on LPP and surface morphology showed the formation of ridges on the target surface in the absence of magnetic field, which were then reduced in the presence of magnetic field (Iftikhar et al., Reference Iftikhar, Bashir, Dawood, Akram, Hayat, Mahmood, Zaheer, Amin and Murtaza2017). The effect of ambient gases and ambient pressure on the surface morphology of the deposited material have also been studied extensively (Pereira et al., Reference Pereira, Cros, Delaporte, Georgiou, Manousaki, Marine and Sentis2004; Nedyalkov et al., Reference Nedyalkov, Nikolov, Atanasov, Alexandrov, Terakawa and Shimizu2014), but the effect of B on IPLD of copper in atmospheric air is not documented well.
Since the IPLD depends on kinetic energy and plasma density, the understanding of plasma parameters in LPP is essential. Most of the studies in the literature are based on the morphological/optical characterization of the deposited NPs. In the first section of the present work, the spectroscopic study of laser-produced copper plasma in the presence of B in air ambient is reported and discussed the effect of B on plasma by varying the strength of B. The plasma parameters from the LIBS data were determined in the absence and presence of B. The characterization of deposited particles on the copper target with and without B is discussed in Section 3. The deposited NPs on copper target in the presence and absence of B via IPLD has also been studied and observed the formation of a mix-phase of Cu2O and CuO NPs. The transformation from Cu2O to CuO NPs is observed in the presence of B and their properties are connected with the plasma parameters. The surface morphology and the phase of NP formation of the laser-ablated crater were characterized by field-emission scanning electron microscopy (FESEM), X-ray diffraction (XRD), and Raman spectroscopy. The transformation of CuO was also confirmed from photoluminescence (PL) spectrum.
2. EXPERIMENTAL SETUP
The schematic diagram of experimental setup used is shown in Figure 1a. The second harmonic of a Q-switched Nd:YAG laser (Quanta: HYL 101) of 10 ns pulse duration and repetition rate of 10 Hz was focused on the Cu target (99.99 %) using a convex lens (lens 1) of focal length 15 cm. The focal area of the laser spot on the Cu target was about 2.85 × 10⁻³ cm2. This corresponds to a laser fluence of 14 J cm−2 on the Cu target. By considering the reflectance of copper at about 61% (Cabalin & Laserna, Reference Cabalin and Laserna1998), the fluence absorbed in the target is 5.5 J cm−2. The target was mounted on a motorized translation stage in between the poles of the electromagnet. The translation movement of the sample prevented from cratering of the sample and provided the fresh surface for each laser shot. The radiation emitted from the Cu plasma was focused using another convex lens (lens 2) of focal length 10 cm, in 1:1 geometry, on the entrance slit of the monochromator (SPEX 750 M) coupled with photomultiplier tube (PMT) interfaced to computer. The emitted spectrum of LPP of Cu was recorded as a function of B in the range of 0–0.5 T. The B profiles of the electromagnet along the Y- and Z-axes (origin of the co-ordinate system is taken at the center of the gap), were recorded by Hall probe. Figure 1b shows geometrical arrangement of electromagnet with respect to LPP. The gap between the poles of the electromagnet was maintained at 1.5 cm. The B profiles along the Y- and Z-axes are same as reported elsewhere (Singh & Sharma, Reference Singh and Sharma2016a ). The uniformity of B spans up to 4 cm along the Z-axis. The B along the Y-axis is constant. The B was varied by changing the current in the coils. The target was mounted so that the laser-produced Cu plasma can expand in the uniform region of transverse magnetic field and hence due to expansion of the plasma along the Y- and Z-axes the LPP parameters are not affected very significantly. The effect was significant around the stopping radius where plasma decelerated significantly.

Fig. 1. (a) Experimental setup and (b) geometry of magnetic field and the location of the deposited nanoparticles on Cu target surface.
3. RESULTS AND DISCUSSION
Figure 2 shows the energy-level diagram of the Cu atomic transitions studied in the present work. Table 1 lists the atomic transition parameters [NIST data base (National Institute of Standards & Technology)], which are used to estimate the plasma parameters. The g m , g n , E m , and E n are, respectively, statistical weight factors, energy levels of upper and lower states, and A mn is the Einstein coefficient of spontaneous emission for the transition between upper (m) and lower state (n).

Fig. 2. Energy level diagram of Cu I transitions.
Table 1. Atomic Cu transition parameters.

Figure 3 shows the Cu I laser-produced breakdown spectra recorded at B = 0, 0.1, 0.3, and 0.5 T. From these spectra, we determined the electron density and temperature. The electron density of the LPP was calculated using Stark-broadened profile of the isolated Cu I (510.5 nm) spectral line. All the measurements were carried out in air at atmospheric pressure. The main mechanisms of the spectral line broadening are Stark broadening, Doppler broadening, and natural broadening. The estimated Doppler width in the present experiment is 0.005 nm, which is negligibly small compared with experimentally measured Cu I (510.5 nm) line width. The natural broadening of Cu I line is very small (≈ 10−5 nm), which can be safely neglected (Man et al., Reference Man, Dong, Liu, Wei, Zhang, He and Wang2004). Therefore, the main contribution is from the Stark broadening. The electron density of plasma is related to the full-width at half-maximum (FWHM) of the Stark-broadened profile by the relation (Griem, Reference Griem1997)
 $$\Delta { {\rm \lambda}} _{1/2} = 2w\left( {{\textstyle{{n_{\rm e}} \over {10^{16}}}}} \right) + 3.5A\left( {{\textstyle{{n_{\rm e}} \over {10^{16}}}}} \right)^{1/4} \times \left( {1 - 1.2N_{\rm D} ^{ - 1/3}} \right)w\left( {{\textstyle{{n_{\rm e}} \over {10^6}}}} \right),$$
where w is the electron impact parameter, A is the ion-broadening parameter, and n e (cm−3) is the plasma electron density. Both the parameters w and A are weak functions of temperature. N D is the number of particles in the Debye sphere. The above relation is applicable only when the following conditions are satisfied (Hafez et al., Reference Hafez, Khedr, Elaksher and Gamal2003): (i) N D ≥ 1 and (ii) 0.05 ≤ A(N e)1/4 × 10−4 ≤ 0.5. The relation between N D and n e is given by the following equation (Hafez et al., Reference Hafez, Khedr, Elaksher and Gamal2003)
 $$N_{\rm D} = 1.72 \times 10^9 {\textstyle{{[T_{\rm e} \left( {{\rm eV}} \right)]^{3/2}} \over {[n_{\rm e} ({\rm cm}^{ - 3} )]^{1/2}}}}\; {\rm cm}^{ - 3}, $$
where T e is the electron temperature. The electron temperature was estimated using Boltzmann plot as discussed later. The electron temperature and density at B = 0.3 T are found to be (1.3 ± 0.1) eV and (6.2 ± 0.1) × 1016 cm−3, respectively. Using these parameters, N D is found to be 10, which is >1, and A(N e)1/4 × 10−4 = 0.05. Therefore, the validity of Stark width relation to calculate the electron density is justified. Since the contribution of the ions in Stark broadening is usually small, after neglecting the second term in the Stark width relation, the electron density can be determined using the relation Δλ1/2 = 2w (n e/1016). The experimental spectral line is the convolution of Lorentzian profile (Stark broadening) and instrumental broadening (Gaussian profile). The experimental spectral width is corrected with the pre-determined instrumental broadening width using the relation
 $$\Delta { {\rm \lambda}} _{1/2} = \displaystyle{{((w_{\rm g} )^2 + (w_{\rm L} /2))^{1/2} + w_{\rm L}} \over 2},$$
where w g and w L are widths of the Gaussian and Lorentzian functions, respectively (Galmed & Harith, Reference Galmed and Harith2008). The instrumental width is measured using Hg vapor light and found to be 0.06 nm. The corrected Stark width (i.e. Lorentzian profile width) is used to calculate electron density. The w parameter is obtained from the literature (Zmerli et al., Reference Zmerli, Ben Nessib, Dimitrijevic and Sahal-Brechot2010). Figure 4 shows the variation of the electron density as a function of B. The electron density varies from (3.6 ± 0.1) × 1017 to (6.1 ± 0.3) × 1017 cm−3 with the increase in B = 0 to 0.5 T. It was found to be maximum [i.e. (6.2 ± 0.10) × 1017 cm−3] at B = 0.3 T, but reduced slightly at B = 0.5 T. When the laser-produced Cu plasma expands in the presence of the transverse B, due to Lorentz force, the LPP is confined and the electrons and ions are gyrated about B. Since the gyro-radius is inversely proportional to B, it decreases with B, and as a result the confinement of electrons is increased and hence the electron density.

Fig. 3. Cu I emission spectra in wavelength range: (a) 509.0–524.0 nm and (b) 565.0–580.0 nm at magnetic field of 0, 0.1 0.3, and 0.5 T.

Fig. 4. Variation of electron density as a function of magnetic field.
Since, the Lorentz force interacts with charged particles, the atoms in the magnetically confined plasma gets decelerated due to the increase in collisions with other plasma particles (Harilal et al., Reference Harilal, Tillack, O'Shay, Bindhu and Najmabadi2004) and more atoms are backscattered toward the target. As the plasma expands, its thermal pressure decreases and the expansion continues till the plasma pressure is equal to the pressure. The plasma expansion stops when the ratio of plasma thermal pressure (p) to pressure, that is, β = p/(B 2/2μ0) is equal to 1. By assuming the plasma expansion as hemispherical, the stopping radius (R b) was estimated using the relation (Singh & Sharma, Reference Singh and Sharma2016b )
 $$R_{\rm b} = \left( {{\textstyle{{3E_{\rm L}} \over {4{ {\rm \pi}}}}} \;{\textstyle{1 \over {P_{{\rm air}} + B^2 /2{ {\rm \mu}} _0}}}} \right)^{1/3}, $$
where E l is the laser energy absorbed by the target and P air is air pressure. By taking the experimental parameters and results, the plasma thermal pressure is found to be 5.3 × 10⁴ Nm−2 and the magnetic pressure at B = 0.3 T is 3.6 × 10⁴ Nm−2. Therefore, the β-parameter obtained by considering the effect of air pressure is 0.4, which signifies the confinement of plasma in the present work. At laser fluence of 5.5 J cm−2 the calculated stopping radius at B = 0.3 T is 4 mm. Therefore, the electron density is increased with B. It is due to increase in confinement. However, a slight decrease in electron density, that is (6.1 ± 0.1) × 1017 cm−3 at B = 0.5 T is observed. It could be due to an increase in radial expansion along the field at higher B as a result of helical motion of the charged particles. It has been reported earlier that the radial expansion (along B) of LPP in air increases with the increase in B (Qindeel et al., Reference Qindeel, Bidin and Daud2008).
The electron temperature of the plasma was determined using Boltzmann plot, assuming the plasma is in local thermodynamic equilibrium (LTE), given by the relation (Griem, Reference Griem1997)
 $$\ln \left( {{\textstyle{{I_{mn} {\rm \lambda} _{mn}} \over {A_{mn} g_m}}}} \right) = \ln \left( {{\textstyle{{n_n hc} \over Z}}} \right) - \left( {{\textstyle{{E_m} \over {k_{\rm B} T_{\rm e}}}}} \right),$$
where I mn is the intensity of the observed transition line, λ m is the transition wavelength, n n is the number density of the nth state, and Z is the partition function. Figure 5 shows the variation of electron temperature of the plasma as a function of B. The electron temperature increases from (0.92 ± 0.07) eV up to (1.32 ± 0.04) eV with the increase in B from 0 to 0.3 T, respectively, and then decreases to (1.22 ± 0.04) eV at higher value of B = 0.5 T. Two possible factors that increase the electron temperature of the plasma in the presence of B are: (i) Joule's heating and (ii) adiabatic compression (Kumar et al., Reference Kumar, Singh and Joshi2011b ). The induced current in the plasma in the presence of B gives rise to Joule's heating. This energy comes at the expense of magnetic field energy. The Joule's heating is directly proportional to the square of B (Chen, Reference Chen2011). As B increases the Joule's heating also increases, which in turn increases the electron temperature.

Fig. 5. Variation of electron temperature as a function of magnetic field at laser fluence of 14 J cm−2.
The decrease in electron temperature at higher B is due to the increase in radial expansion along the field as well as more energy dissipation as a result of increased collisions due to increase in plasma density (Raju et al., Reference Raju, Singh, Gopinath and Kumar2014). Figure 6 shows the emission spectrum of Cu I lines (510.5, 515.3, 521.8, 570, and 578.2 nm) at B = 0 and 0.3 T. Figure 7a shows the variation of the intensity of Cu I lines at 510.5, 515.3, and 521.8 nm as a function of B and Figure 7b that of Cu I at 570.0 and 578.2 nm with B. When the external B is applied, the electron density and temperature undergo change as depicted in Figures 4 and 5, which in turn affects the intensity of these transition lines. As B increases, the intensity of all the five Cu I lines increases initially up to a B of 0.3 T and then decreases slightly at 0.5 T. The intensity of the spectral lines depends on the density of electrons, atoms, ions and coefficient of electron impact excitation, and radiative recombination.

Fig. 6. Cu I emission spectra in wavelength range 509.0–524.0 nm and 565.0–580.0 nm at B = 0 (smooth line) and 0.3 T (dotted line).

Fig. 7. Intensity variation of (a) Cu I (510.5), Cu I (515.3), and Cu I (521.8); (b) Cu I (570.0) and Cu I (578.2 nm) lines as a function of magnetic field.
The radiative recombination rate depends on the temperature and it is given by Kumar et al. (Reference Kumar, Singh and Joshi2011b
)
 $R_{\rm r} = 2.7 \times 10^{ - 19} $
 $n_{\rm e} n_{\rm i} Z^2 T_{\rm e} ^{ - 3/4} ({\rm m}^{ - 3} {\rm s}^{ - 1} ),$
where n
i and Z are the ion density and charge of the plasma species, respectively. Since the electron temperature is higher in the presence of B, the radiative recombination decreases, whereas the electron impact excitation rate increases. The enhancement in intensity of Cu atomic lines in the presence of B is attributed to the increase in electron impact excitation rate of Cu I due to the increase in effective plasma density and temperature as a result of magnetic confinement of plasma. At higher B the enhancement decreases due to increase in ionization of the atom as a result of increase in temperature. The intensity enhancement factor for the various lines is different, which is attributed to the difference in electron impact excitation rate (Singh & Sharma, Reference Singh and Sharma2016a
). Our previous studies on the temporal and spatial evolution of Cu plasma in air as well as in the presence of B showed the enhancement in optical emission, electron density, and temperature (Singh & Sharma, Reference Singh and Sharma2016a
, Reference Singh and Sharma
b
). The increase in temperature and collisional process leads to increase in ionic line intensity with B.
$n_{\rm e} n_{\rm i} Z^2 T_{\rm e} ^{ - 3/4} ({\rm m}^{ - 3} {\rm s}^{ - 1} ),$
where n
i and Z are the ion density and charge of the plasma species, respectively. Since the electron temperature is higher in the presence of B, the radiative recombination decreases, whereas the electron impact excitation rate increases. The enhancement in intensity of Cu atomic lines in the presence of B is attributed to the increase in electron impact excitation rate of Cu I due to the increase in effective plasma density and temperature as a result of magnetic confinement of plasma. At higher B the enhancement decreases due to increase in ionization of the atom as a result of increase in temperature. The intensity enhancement factor for the various lines is different, which is attributed to the difference in electron impact excitation rate (Singh & Sharma, Reference Singh and Sharma2016a
). Our previous studies on the temporal and spatial evolution of Cu plasma in air as well as in the presence of B showed the enhancement in optical emission, electron density, and temperature (Singh & Sharma, Reference Singh and Sharma2016a
, Reference Singh and Sharma
b
). The increase in temperature and collisional process leads to increase in ionic line intensity with B.
The validity of LTE of plasma is given by McWhirter's criterion (Kunze, Reference Kunze2009) n e ≥ 1.6 × 10¹² T 1/2 (ΔE)3. Here, n e (cm−3) is the electron density, T (K) is the temperature, and ΔE (eV) is the energy difference between the states, which are expected to be in LTE. In the present case, the value of ΔE for Cu I (510.5 nm) is 2.43 eV and temperature is 15,312 K at B = 0.3 T. The lower limit of the plasma density satisfying the LTE condition is 2.84 × 1015 cm−3. The experimentally observed electron density of Cu plasma is of the order of 1017 cm−3, which is greater than the lower limit of the validity condition of LTE. The validity of LTE of copper plasma by considering the temporal and spatial evolution of plasma is reported elsewhere (Singh & Sharma, Reference Singh and Sharma2016a ).
In order to explore the effect of B on NPs formation on Cu target due to IPLD, the laser-ablated Cu target surface was subjected to FESEM, XRD, PL, and laser Raman spectroscopy. The FESEM images of laser-ablated target surface in the absence and presence of B = 0.3 T are shown in Figure 8. The surface consists of two parts: region A (around the crater at a distance of 1.6 mm from the center of the crater) and the crater region B (crater formed due to direct laser exposure). Region A is formed due to the re-deposition of the particles from laser-produced Cu plasma plume. The FESEM images reveal that more NPs are formed in the region A as compared with the crater. When the laser ablation takes place, the plasma plume expands perpendicular to the target surface. Owing to high ambient pressure, a portion of the ablated plume returns back due to the collisions between the target plasma particles and ambient gas (Illgner et al., Reference Illgner, Schaaf, Lieb, Queitsch and Barnikel1998). The backward flux of the ablated mass is deposited on the target in the form of the nanostructure, which is known as IPLD (Szorenyi & Geretovszky, Reference Szorenyi and Geretovszky2004). The role of B in IPLD can be understood as follows. The presence of the external B changes the plasma particle diffusion pattern. The particles diffuse along the B-direction due to their mobility, but in the transverse direction in steps of Larmor gyro-radius (Pandey & Thareja, Reference Pandey and Thareja2011). Due to this confinement more particles undergo backscattering and redeposit on the target. The higher temperature of plasma in the presence of B results in large number of collisions and backscattering and eventually in turn increases inverse deposition. Above all, at a later time of plasma expansion, the plume starts expanding mainly in the radial direction due to high pressure within the plasma compared with the surrounding static pressure. Therefore, the density of species becomes higher in the lateral plume front of the plasma. This high-pressure gradient along the lateral direction and the viscosity effect result in the formation of two vortices at the plume periphery, namely, backscattering of ablated particles with circular motion. This phenomenon is observed only at atmospheric air pressure (Pereira et al., Reference Pereira, Cros, Delaporte, Georgiou, Manousaki, Marine and Sentis2004). In the presence of B, due to pressure gradient in the plasma the diamagnetic drift arises. This drift is given by the relation (Chen, Reference Chen2011)
 $V_{\rm d} = - (\nabla p \times {\bf B}/qn_{\rm e} B^2 )$
where q is charge of the plasma species;
$V_{\rm d} = - (\nabla p \times {\bf B}/qn_{\rm e} B^2 )$
where q is charge of the plasma species;
 $\nabla p$
is the pressure gradient. As the plasma expands, the density gradient arises along the expansion direction. It enhances more plasma species drifting to the lateral direction at a later time of plasma expansion. This overall phenomenon of high air pressure and B may cause the formation of different structures in the vicinity of the ablated crater on Cu target.
$\nabla p$
is the pressure gradient. As the plasma expands, the density gradient arises along the expansion direction. It enhances more plasma species drifting to the lateral direction at a later time of plasma expansion. This overall phenomenon of high air pressure and B may cause the formation of different structures in the vicinity of the ablated crater on Cu target.

Fig. 8. FESEM images of nanostructured surface (a) B = 0 and (b) B = 0.3 T.
The plasma induces shock wave in the target itself as well as in the surrounding ambient medium (Fabbro et al., Reference Fabbro, Fournier, Ballard, Devaux and Virmont1990). The shock pressure is usually higher in the presence of the confining medium (water, air, and transparent glass). The plasma shock pressure generated in air ambient is calculated using Hugoniot relation (Fabbro et al., Reference Fabbro, Fournier, Ballard, Devaux and Virmont1990)
 $$P({\rm kbar}) = 0.1\left[ {{\textstyle{{ {\rm \alpha}} \over {2{ {\rm \alpha}} + 3}}}(ZI_0 )} \right]^{1/2}, $$
where α is the correction factor (1.0 for air confinement), Z (g cm−2 s−1) is the shock-impedance of the target–ambient system, and I 0 (GW cm−2) is the incident laser intensity. The value of α depends on the confining medium and independent of the target material. The shock impedance of the target-ambient system is given by (Fabbro et al., Reference Fabbro, Fournier, Ballard, Devaux and Virmont1990),
 $$\displaystyle{2 \over Z} = \left( {{\textstyle{1 \over {Z_1}}} + {\textstyle{1 \over {Z_2}}}} \right),$$
where Z 1 and Z 2 are the shock impedances of the target and confining medium, respectively. The shock impedance Z of a material is given by ρD, where ρ is the density of the material and D is the shock velocity. The shock impedance for the surrounding and target are: Z air = 40 g cm−2 s−1 and Z Cu = 2.1 × 10⁶ g cm−2 s−1 (Fabbro et al., Reference Fabbro, Fournier, Ballard, Devaux and Virmont1990). The intensity of laser beam incident on the target is 1.4 GW cm−2. The calculated shock pressure exerted in air ambient is 47 Mpa. Thus, because of this high pressure and temperature of the plasma in the presence of B, the molten layer of Cu metal is less viscous. As a result of this, the intense shock wave is generated and eventually impulsive force acts on it (Patel et al., Reference Patel, Singh and Thareja2014). It increases laser ablation from the Cu target, which results in the formation of more dense plasma in the presence of B. The other possibility of increasing the plasma density may be an increase in heat transfer to the target from the plasma as the plasma is confined and is in close proximity to the target (Singh & Sharma, Reference Singh and Sharma2016c ). Consequently, the amount of laser ablation from the Cu target is higher in the presence of B, which increases the density of plasma.
The crystallinity of the deposited region on Cu target is examined using XRD. Figure 9 shows the XRD pattern of the laser-ablated Cu target surface. The diffracted peaks obtained at 2θ = 34.9° and 38.8° correspond to CuO NPs, which are attributed to miller indices (002) and (111) (Rashad et al., Reference Rashad, Rüsing, Berth, Lischka and Pawlis2013), and those peaks at 43.4° and 50.5° correspond to Cu NPs peaks (Pandey & Thareja, Reference Pandey and Thareja2011) corresponding to the miller indices (111) and (200) of unirradiated Cu, respectively. The diffracted peak at 2θ = 30° corresponds to (110) of Cu2O phase. The mean crystallite size (t) was calculated using Debye–Scherrer formula (Cullity, Reference Cullity1956), t = 0.9λ/βcosθ, where λ is the wavelength of X-ray radiation (CuKα), θ is the Bragg's angle, and β is the FWHM of the XRD peak CuO (111). The calculated mean crystallite size in the absence of the B was 20.5 nm. However, in the presence of the B, it was found to be 22.9 nm. The two peaks at 43.4° and 50.6° of ablated target are shifted slightly due to strain produced in the lattice. The strain within a material can be calculated by measuring the d-spacing between the planes using XRD: ε = (d n − d 0)/d 0, where d n and d 0 are measured and strain free d-spacing, respectively. The strains for the plane Cu (111) and Cu (200) of the laser-irradiated Cu surface in the absence of B are, respectively, of the order of 10−3 and 10−2. It shows similar values in the presence of B indicating that the B does not play any significant role in producing strain in re-deposited metal. In the case of B, the XRD peak intensity of CuO at 38.8° and 34.9 is more pronounced as compared with that of without B. This is attributed to more crystallized CuO NPs formation in the plane (111) in the presence of the B.

Fig. 9. XRD pattern of laser-ablated Cu at (a) uniradiated Cu, (b) B = 0, and (c) 0.3 T.
The diffracted peak intensity of Cu2O is lowered in the presence of the B, while the intensity of CuO increased, which shows the transformation of Cu2O to CuO phase. This transformation mechanism is similar to the transformation of Cu2O to CuO when the substrate temperature is increased during PLD (Jawad et al., Reference Jawad, Ismail and Yahea2011). The oxidation of Cu can be seen as follows. 4Cu + O2 = 2Cu2O and 2Cu2O + O2 = 4CuO. When the oxidation of Cu occurs, the major product is Cu2O. The CuO forms at high temperature through the second reaction (Muthe et al., Reference Muthe, Vyas, Narang, Aswal, Gupta, Bhattacharya, Pinto, Kothiyal and Sabharwal1998). In the presence of B, more heat is transferred to the target, which increased the temperature of target and induced a high-temperature environment around the target. As a result of this, the amount of Cu2O decreases, while the CuO is increased. During laser ablation, the temperature of the region where the deposition occurred via IPLD was around 391–755°C (Singh & Sharma, Reference Singh and Sharma2016c ). The increase in substrate temperature of target that caused the transformation of Cu2O to CuO was also confirmed from the PL and Raman spectrum. In the presence of B, the intensity of the Cu NP peak at 43.4° is higher, which means more Cu NPs are formed in the lattice plane (111). It has been reported earlier that in the laser ablation of Cu without B, more CuO NPs are formed in the region A than in the crater region B (Zeng et al., Reference Zeng, Yung and Xie2003). The oxygen from air in the vicinity of high-temperature plasma gets atomized and combines with the Cu atom and subsequently favors the formation of CuO.
Lee et al. have reported the presence of Cu ions and atoms near the ablated Cu surface (Lee et al., Reference Lee, Song, Cha, Lee, Park, Lee and Sneddon1997). Misra et al. reported that the Cu atoms or ions could reach the edge of the crater and easily oxidize leading to the formation of Cu/CuO/Cu2O NPs. The copper oxide so formed gets deposited on the target itself (Misra et al., Reference Misra, Mitra and Thareja1999). In the present work, the formation of the copper oxide around the laser-ablated crater was observed. This is attributed to the combined effect of high atmospheric pressure and magnetic confinement of plasma. More Cu atoms stay near the target surface due to magnetic confinement of plasma. The re-deposited copper oxide nanostructure in the absence of the B is found to be quite identical to the nanostructure obtained via laser ablation of Cu (Zeng et al., Reference Zeng, Yung and Xie2003). Since, the X-ray peak of CuO was noisy, the Raman and PL spectroscopy of the deposited particles were also studied to confirm the formation of copper oxide NPs. The Raman spectra of the target surface in the absence and presence of the B is shown in Figure 10. The Raman spectra were recorded from region A. It depicts three Raman active modes (A g + 2 B g) of CuO and three Raman peaks of Cu2O (Mageshwari & Sathyamoorthy, Reference Mageshwari and Sathyamoorthy2013). The peak at 301.1 cm−1 corresponds to A g mode, while the remaining two peaks at 348.4 and 638.2 cm−1 as B g modes of CuO in the absence of B. However, in the presence of the B, we assigned the peak at 300.0 cm−1 as A g and other two peaks at 348.4 and 647.3 cm−1 as B g modes, respectively. The characteristic peaks of Cu2O were observed at 109.0, 149.5, and 219.8 cm−1, respectively. The first peak of Cu2O corresponds to inactive Raman mode. The second peak is due to Raman scattering from phonons of symmetry Γ− 15. The third strongest peak is attributed to second-order Raman-allowed mode of the Cu2O (Mao et al., Reference Mao, He, Sun, Li, Lu, Gan, Liu, Gong, Chen, Liu and Tong2012). In the presence of the B, the peak intensity (CuO) is higher than that of without B. However, the intensity of peaks (Cu2O) is reduced significantly, which is more likely due to the phase transformation of copper oxide from Cu2O to CuO. The intensity of Raman scattering depends on the number of scattering centers present in the volume of the sample where the laser beam illuminated. The increase in intensity of CuO peak signifies the increase in number of CuO particles. Therefore, by application of external B in LPP the crystallite size on the target can be controlled. It also can be used to transform Cu2O to CuO.

Fig. 10. Raman shift of laser-ablated Cu target surface with (a) B = 0 and (b) B = 0.3 T.
We also analyzed the ablated surface of copper at B = 0 and 0.3 T using PL spectroscopy (PL). The excitation wavelength of laser used for PL studies was 405 nm. Figure 11a and 11b show the PL spectra of the deposited NPs in the presence and absence of B of 0.3 T. In the absence of B, the PL spectrum shows two emission peaks at 459.9 (blue range emission) and 669.9 nm (red range emission), respectively. These two peaks correspond to CuO and Cu2O (Chang et al., Reference Chang, Lee and Park2005). A broad red emission at 669.9 nm of Cu2O in PL spectrum is probably due to transitions between valence band and conduction band in Cu2O nanocrystals (Shanmugan & Mutharasu, Reference Shanmugan and Mutharasu2012). It is more likely due to acceptor-related luminescence. The broad blue range emission centered at 459.9 is to the near-band-edge emission. In the presence of B, in addition to above two peaks, the third peak appeared at 556.9 nm (green range emission), which is attributed to emission of CuO. It arises from singly ionized oxygen vacancy. It is due to the recombination of photo-generated hole and electron in valence band. The intensity of first peak (CuO) is increased, while that of Cu2O decreased considerably in the presence of B, which is in confirmation with both XRD and Raman spectra.
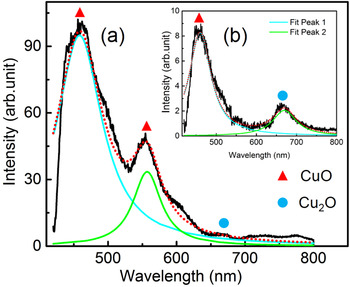
Fig. 11. Photoluminescence spectra at (a) B = 0.3 T and (b) B = 0 (inset).
4. CONCLUSION
The LPP in the presence of variable transverse B using OES is reported. As the B increases from B = 0 to 0.5 T, the intensity of optical emission of Cu I lines initially increases up to B of 0.3 T and then decreases at B = 0.5 T. It is attributed to the magnetic confinement of plasma to a smaller region resulting in higher density of plasma. The electron density increases as the B increases from 0 to 0.3 T and then slightly decreases at higher B of 0.5 T. In this confined plasma, the electron temperature is higher due to adiabatic compression, which leads to increase collisional excitation rate as well as heat transfer to the target which leads to efficient ablation. The enhancement in intensity of Cu I lines is due to the increase in collisional excitation. The surface morphology of the target was studied using FESEM images depicting the change in nanostructuring in the presence of the B. The XRD shows the signature of the Cu, CuO, and Cu2O NPs formation within the vicinity of the laser-ablated crater. In the presence of B, grain size of the NPs formed in the peripheral region is increased. It is due to increase in collision of plasma species and ambient atoms as a result of combined effect of air pressure and B. The XRD, Raman as well as PL spectroscopy confirms the transformation of Cu2O to CuO in the presence of B. Thus, by tuning the strength of B, the nanostructuring on the target surface may be controlled.
ACKNOWLEDGEMENT
We would like to acknowledge the CIF (Central Instrumental facility), IIT Guwahati for providing the FESEM and Raman spectroscopy facilities.


