INTRODUCTION
Human demands for food and fish meal are in many cases in direct competition with forage needs of marine mammals, birds and piscivorous harvested fish. Globally, harvest of forage species such as sardines, anchovy, herring and euphausiids (or krill) total approximately 30 million tonnes and account for >30% of global fisheries landings. These forage species are generally plankton feeders, are highly abundant, form dense aggregations, and are the principal means of transferring production from phytoplankton and zooplankton to predators such as larger fish, birds and mammals (Smith et al. Reference Smith, Brown, Bulman, Fulton, Johnson, Kaplan, Lozano-Montes, Mackinson, Marzloff, Shannon, Shin and Tam2011). Harvest of Peruvian anchoveta (Engraulis ringens) alone exceeded 7 million tonnes in 2006 (Alder et al. Reference Alder, Campbell, Karpouzi, Kaschner and Pauly2008; Tacon & Metian Reference Tacon and Metian2009). Conversely, small pelagic fish such as sardines and anchovies may account for up to 12.5% of seabird diets and up to 20% of the diets of certain marine mammals worldwide (Karpouzi et al. Reference Karpouzi, Watson and Pauly2007; Kaschner et al. Reference Kaschner, Karpouzi, Watson, Pauly, Alder and Pauly2006). In ‘wasp-waist’ systems, such as the Benguela Current off Namibia and South Africa, a limited number of forage species play critical roles in transferring primary and plankton production to higher trophic levels (Shannon Reference Shannon2000). In pelagic food webs, myctophids (lanternfish) can link plankton to harvested species such as squids, tunas, mackerel and salmonids (Nagasawa et al. Reference Nagasawa, Nishimura, Asanuma and Marubayashi1997), and increasingly myctophids may become the targets of commercial fisheries operations (Valinassab et al. Reference Valinassab, Pierce and Johannesson2007).
Fluctuations in dominant forage species such as Peruvian anchoveta have long been shown to have substantial impacts on seabirds and other predators (Murphy Reference Murphy1925) such as Humboldt penguins Spheniscus humboldti (Taylor et al. Reference Taylor, Leonard, Boness and Majluf2002). In fact, the combination of fishery removals and climate variability led to the collapse of the Peruvian anchoveta fishery in the 1970s, contributing to one of the most massive declines in seabirds and other top predators ever observed (Muck Reference Muck, Pauly, Muck, Mendo and Tsukayama1989). In the North Sea, Norwegian Sea and Barents Sea, industrial fisheries target forage fish such as sand lance, capelin and herring, despite evidence that forage fish support mammals and birds in these regions (Anker-Nilssen et al. Reference Anker-Nilssen, Barrett and Krasnov1997; Gjosoeter Reference Gjosoeter1997; Frederiksen et al. Reference Frederiksen, Wanless, Harris, Rothery and Wilson2004). Effects of forage species abundance on seabirds have been demonstrated empirically for a wide range of both species types (Cury et al. Reference Cury, Boyd, Bonhommeau, Anker-Nilssen, Crawford, Furness, Mills, Murphy, Österblom, Paleczny, Piatt, Roux, Shannon and Sydeman2011).
In a recent ecosystem modelling study, Smith et al. (Reference Smith, Brown, Bulman, Fulton, Johnson, Kaplan, Lozano-Montes, Mackinson, Marzloff, Shannon, Shin and Tam2011) found that across five regions, harvest of forage groups had large impacts on many other species. This was particularly true for forage groups that comprised large portions of an ecosystem's biomass, or that were highly connected in the food web (for example, possessing many predator/prey links). Impacts of more than ± 40% were observed throughout the food webs, for mammals, birds and fishery target species, and for a wide variety of other groups. Depleting forage groups to 75% of unfished abundance, rather than the 40% target that is typically applied to non-forage groups, reduced long term fishery yields by 20%, but also reduced impacts throughout the food web.
Smith et al. (Reference Smith, Brown, Bulman, Fulton, Johnson, Kaplan, Lozano-Montes, Mackinson, Marzloff, Shannon, Shin and Tam2011) provided synthesis and summaries of the results, in particular the patterns consistent across the five ecosystems. However, they focused on only the most severe effects (responses of >40%), did not provide specific guidance for regions such as the California Current on the west coast of North America, and did not place depletion levels (for example 40% or 75%) in the context of productivity estimates and reference points for individual species. In the USA and in other countries, reference points based on maximum sustainable yield (MSY) are central to management decisions and goals (US Department of Commerce 2007; European Commission 2010).
Fishery managers in the USA's portion of the California Current have limited the harvests of forage species, for instance with a ban prohibiting development of euphausiid (krill) fisheries in USA waters (Pacific Fishery Management Council 2006). Over three decades ago, the Pacific Fishery Management Council established ‘set-asides’ for anchovy (Engraulis mordax), minimum biomass thresholds below which catch is not removed (Pacific Fishery Management Council 1978). Currently such minimum thresholds are in place for sardines (Sardinops sagax) and Pacific mackerel (Scomber japonicus) (Hill et al. Reference Hill, Dorval, Lo, Macewicz, Show and Felix-Uraga2008; Crone et al. Reference Crone, Hill, McDaniel, Lo and Fisheries2009), buffering for temporal variability in the environment and recruitment, as well as allowing a minimum prey base for other species. These management guidelines were established as a precaution on the evidence that forage species play key roles in the ecosystem, based on observations suggesting a relationship between fish abundance and the breeding success of predators (Anderson et al. Reference Anderson, Gress and Mais1982). However, explicit systematic consideration of ecosystem impacts, such as that by Smith et al. (Reference Smith, Brown, Bulman, Fulton, Johnson, Kaplan, Lozano-Montes, Mackinson, Marzloff, Shannon, Shin and Tam2011), was not undertaken at the time, as the necessary ecosystem models were not yet available.
In the intervening years there has been much attention on the development of trophic and ‘whole of system’ ecosystem models. Here we use two well-developed ecosystem models of the California Current to test the impacts on other parts of the ecosystem of harvesting four forage groups. These multi-species models allow us to capture how the harvest of forage groups affects other species through the food web. The two models make different, but realistic, assumptions about how changes in prey base affect predator diets. We use both model types to test whether results are consistent across differing structural assumptions. Smith et al. (Reference Smith, Brown, Bulman, Fulton, Johnson, Kaplan, Lozano-Montes, Mackinson, Marzloff, Shannon, Shin and Tam2011) found that general conclusions regarding forage fish were consistent across three model types and five ecosystems, but that strong differences in the magnitude of impacts across food webs may occur among models and regions. Our work here presents detailed results specifically for the California Current. The modelling approach allows us to evaluate the food web impacts of harvest strategies, including no fishing, and alternatively depleting forage groups to 40% of unharvested levels, a common fishery management target for non-forage stocks (Clark Reference Clark2002). We also test higher levels of fishing (depletion to 20% of unharvested levels), and reduced levels of fishing (depletion to 75% of unharvested levels), and make explicit comparisons to management reference points derived directly from these ecosystem models and from single species approaches. We identify protected species and commercially harvested species vulnerable to reductions in the forage base. Given the global economic demand for forage species, and the current status of 24 of 28 major worldwide forage fish stocks as fully exploited or overfished (Alder et al. Reference Alder, Campbell, Karpouzi, Kaschner and Pauly2008), the results are highly relevant for setting harvest guidelines and management policies for lower trophic level species.
METHODS
System description
The California Current is a productive upwelling system where the abundance of forage groups influences the population dynamics, growth and behaviour of other groups in the food web. Coupled with wind-driven upwelling, this eastern boundary current drives delivery of nutrients to the surface waters. The oceanography and biological productivity of the system are also highly influenced by multi-annual cycles of El Nino-Southern Oscillation and the patterns of the Pacific Decadal Oscillation (Barber & Chavez Reference Barber and Chavez1983; Checkley & Barth Reference Checkley and Barth2009). Both of these climate drivers influence nutrient availability, primary productivity, and the recruitment and growth of fish, bird and mammal species. Though most lower trophic level or forage species show high variability, sardines and anchovies in particular show strong out-of-phase cycling of population abundance, synchronous with other Pacific stocks (MacCall Reference MacCall1996: Schwartzlose et al. Reference Schwartzlose, Alheit, Bakun, Baumgartner, Cloete, Crawford, Fletcher, Green-Ruiz, Hagen, Kawasaki, Lluch-Belda, Lluch-Cota, MacCall, Matsuura, Nevarez-Martinez, Parrish, Roy, Serra, Shust, Ward and Zuzunaga1999; Chavez et al. Reference Chavez, Ryan, Lluch-Cota and Niquen2003). Koslow et al. (Reference Koslow, Goericke, Lara-Lopez and Watson2011) have demonstrated decadal scale variability in the abundance of mesopelagic fish such as myctophids, driven by the response of midwater oxygen concentrations to climate trends and variation.
Lower trophic level groups differ in their importance as prey for other species in the food web. Euphausiids and forage fish such as sardines and anchovies have high biomasses and production rates and are also key prey species (Pacific Fishery Management Council 2008). In a recent summary of existing predator diet information, Dufault et al. (Reference Dufault, Marshall and Kaplan2009) identified a feeding guild of 17 fish species that have euphausiids (large zooplankton) as their primary diet item. This guild included Pacific hake (Merluccius productus), the target of the largest finfish fishery on the USA's West Coast. Barlow et al. (Reference Barlow, Kahru and Mitchell2008) estimated that euphausiids comprise 40% of the prey biomass consumed by cetaceans in the California Current, totalling c. 800 000 t. Forage fish (small planktivores) are the most common diet item for at least four fish species as well as surface feeding birds (such as glaucous-winged gulls Larus glaucescens) and migrating seabirds (for example sooty shearwaters Puffinus griseus) (Dufault et al. Reference Dufault, Marshall and Kaplan2009). Forage fish comprise >5% of the diets of 13 of the 52 species of groundfish and pelagic fish (Dufault et al. Reference Dufault, Marshall and Kaplan2009). Both euphausiids and forage fish are important diet items of Pacific salmon, Oncorhynchus spp. (Daly et al. Reference Daly, Brodeur and Weitkamp2009), which play a central cultural and economic role in local recreational and commercial fisheries. Interannual variability in abundance of forage species such as euphausiids and anchovies, driven by oceanographic patterns of El Niño-La Niña, has been shown to drive the abundance, condition and behaviour of upper trophic levels, including sea birds (Thayer & Sydeman Reference Thayer and Sydeman2007; Ainley et al. Reference Ainley, Dugger, Ford, Pierce, Reese, Brodeur, Tynan and Barth2009; Hipfner Reference Hipfner2009) and whales (Benson et al. Reference Benson, Croll, Marinovic, Chavez and Harvey2002). Other forage species such as mackerel and mesopelagic fish are important prey species, particularly for pelagic predators, but are a smaller portion of diets for groundfish. Fisheries currently target mackerel, sardine and to a lesser extent anchovy, but do not harvest mesopelagic fish or euphausiids.
Model descriptions
Northern California Current Ecosim model (Ecosim-NCC)
The Ecosim-NCC (Northern California Current) model was developed by Field et al. (Reference Field, Francis and Aydin2006) to investigate the impacts of environmental variability, predation and fishing on the Northern California Current ecosystem. The Ecosim-NCC model covers the area from the USA–Canada border (48° 23ʹ N) to Cape Mendocino (40° 26ʹ N) and out to 1200 m depth. The model region covers approximately 70 000 km2 (Fig. 1), has 63 functional groups (groups of functionally similar species that are aggregated and modelled as a single variable) and is initialized at 1960. The Ecosim code base simulates predator-prey relationships between functional groups, implicit refuges from predation, and time-varying diets, but it is not spatially disaggregated (Walters Reference Walters, Pauly, Christensen and Kitchell2000; Christensen & Walters Reference Christensen and Walters2004). At its core, Ecosim solves a set of differential equations on a monthly time step, based on initial conditions (biomasses) and rate parameters that represent predation and growth rates of biomass pools. The Field et al. (Reference Field, Francis and Aydin2006) implementation of Ecosim did not include age structure of populations, nor did it track size-at-age or gape relationships (namely prey size relative to predator mouth size).

Figure 1 Spatial extent of the Central California Atlantis model (CCAM) and the Northern California Current Ecosim model (Ecosim-NCC). The Atlantis-CCAM model domain is displayed here as irregular polygons. The Ecosim-NCC model is not spatially explicit, but represents the area shoreward of the 1200 m isobath (bold rectangle).
The Ecosim model is driven by two indices related to environmental conditions. The first is an index of ocean production (Logerwell et al. Reference Logerwell, Mantua, Lawson, Francis and Agostini2003) that represents local ocean conditions and lower trophic level productivity, and that here is used to force phytoplankton production for the period 1960 to 2003. The other, the Pacific Decadal Oscillation (Mantua et al. Reference Mantua, Hare, Zhang, Wallace and Francis1997), is a broad-scale index of the ocean's physical environment, including temperature. The Pacific Decadal Oscillation index is used to force consumption by key predators for the period 1960 to 2003, by increasing vulnerability of prey to predators as temperatures increase. This forcing represents changes in the physical environment that affect the species composition of the California Current, leading to higher abundances of predators such as hake, sardine and mackerel during warm (positive) phases of the Pacific Decadal Oscillation. Field et al. (Reference Field, Francis and Aydin2006) demonstrated that both forcing indices improve the ability of the model to represent changes in the biomass of key species over the period 1960 to 2003. A complete description of the Ecosim-NCC model, including climate forcing, can be found in Field et al. (Reference Field, Francis and Aydin2006).
In Ecosim-NCC, we ran five sets of simulations that each tested the impact of depleting one of the following five functional groups (note that each functional group is composed of several species, with the exception of California sardine, which is modelled as a single-species functional group):
• Euphausiids: principally Euphasia pacifica, Thysanoessa spinifera and Nyctiphanes simplex,
• Forage fish: northern anchovy (Engraulis mordax), Pacific herring (Clupea pallasi), sand lance (Ammodytes hexapterus), eulachon (Thaleichthys pacificus), American shad (Alosa sapidissima), surf smelt (Hypomesus pretiosus), whitebait smelt (Allosmerus elongates) and other clupeids,
• California sardine:Sardinops sagax,
• Mesopelagic fish: deep vertically-migrating fish species including myctophids,
• Mackerel: jack and Pacific mackerel (Trachurus symetricus and Scomber japonicus).
Central California Atlantis Model (Atlantis-CCAM)
The California Current Atlantis model (Atlantis-CCAM) extends along the USA's West Coast from the Canadian border to Point Conception (34° 27ʹ N), and out to 1200 m depth (Fig. 1). The model domain is divided into 82 spatial cells and up to five vertical depth layers per cell. The full model is detailed in Horne et al. (Reference Horne, Kaplan, Marshall, Levin, Harvey, Hermann and Fulton2010). An earlier implementation of the model has been applied to test the effects of ocean acidification (Kaplan et al. Reference Kaplan, Levin, Burden and Fulton2010), and the latest version has been used to test harvest strategies (Kaplan & Leonard Reference Kaplan and Leonard2012; Kaplan et al. Reference Kaplan, Horne and Levin2012). This new version contains updated estimates of abundance from stock assessments and surveys, as well as added spatial resolution in Central California. The model covers 94 000 km2, and includes 60 functional groups, ranging from phytoplankton to marine mammals, birds and harvested fish groups. The model has particular emphasis on groundfish species, modelling some species such as Dover sole (Microstomus pacificus) and canary rockfish (Sebastes pinniger) as single species with multiple life history stages, rather than aggregated functional groups. Water temperature and the flux of nutrients and plankton are forced with a repeating loop of output for years 1958–2005 from a ROMS (Regional Ocean Modelling System) hydrodynamic model. The Atlantis model has been calibrated against historical estimates of abundance for 1950–2007, from stock assessments and survey data, as detailed in Horne et al. (Reference Horne, Kaplan, Marshall, Levin, Harvey, Hermann and Fulton2010). One of the key inputs, the diet matrix that initializes the predator-prey relationship, has been published by Dufault et al. (Reference Dufault, Marshall and Kaplan2009). Minor modifications to Atlantis-CCAM and minor changes in model behaviour since Smith et al. (Reference Smith, Brown, Bulman, Fulton, Johnson, Kaplan, Lozano-Montes, Mackinson, Marzloff, Shannon, Shin and Tam2011) are detailed in Appendix 1 (see supplementary material at Journals.cambridge.org/ENC).
Like Ecosim, Atlantis is a code base that solves a set of differential equations to simulate food web and fishery dynamics. Atlantis operates on a 12-hour time step, and includes migrations and foraging movement, age structure and dynamic size-at-age for vertebrates, and simpler biomass pools for invertebrates and primary producers (Fulton Reference Fulton2004; Fulton et al. Reference Fulton, Smith and Punt2005). Predator-prey models explicitly calculate spatial overlap between species, and predator gape. Fulton et al. (Reference Fulton, Link, Kaplan, Savina-Rolland, Johnson, Ainsworth, Horne, Gorton, Gamble, Smith and Smith2011) compared the California Current model to other Atlantis models, and summarized lessons learned from this and other applications of Atlantis. Plagányi (Reference Plagányi2007) offered a comprehensive comparison of Atlantis, Ecosim, and other ecosystem models and their applications.
For this analysis of lower trophic level species, we tested four sets of fishing simulations, each of which simulated depletion of one of the following four functional groups in the Atlantis-CCAM (here and throughout, we use functional group names consistent with Ecosim-NCC where possible; where the functional group names differ in Atlantis-CCAM, we list them in parentheses):
• Euphausiids (large zooplankton): primarily euphausiids, but also chaetognaths, pelagic polychaetes and pelagic shrimp,
• Forage fish (small planktivores): Pacific sardine Sardinops sagax, northern anchovy Engraulis mordax, Pacific herring Clupea pallasii and smelt (Osmeridae),
• Mesopelagic fish (deep vertically- migrating fish): Myctophidae, longfin dragonfish Tacostoma macropus and Pacific viperfish Chauliodus macouni,
• Mackerel (large planktivores): jack mackerel Trachurus symmetricus and Pacific mackerel Scomber japonicus.
Harvest scenarios: depletion of individual forage groups
Following the methods in Smith et al. (Reference Smith, Brown, Bulman, Fulton, Johnson, Kaplan, Lozano-Montes, Mackinson, Marzloff, Shannon, Shin and Tam2011), we projected the models from current biomass levels (2007–2008 abundances) forward for 50 years with specified constant levels of fishing mortality (% yr−1) (for example, Appendix 1, Fig. S1.1, see supplementary material at Journals.cambridge.org/ENC). For Atlantis-CCAM, this is straightforward since the base model's initial conditions and fishing mortality rates represent 2007–2008 abundances; oceanographic conditions were repeated into the future by repeating the available 47 year loop of ROMS output. Ecosim-NCC's initial conditions represent 1960, and we therefore simulated 1960 through 2006, and then continued the simulations for 50 additional years. In this case, from 1960–2006 we applied historical environmental forcing, fishing effort and fishing mortality time-series in order to bring the biomasses to 2007 levels, and we then kept fishing mortality rates and climate forcing at constant (2006) levels for the remaining years of the simulations (2007–2056). For both models, the status quo scenario imposed fishing mortality from existing fleets and gears onto all relevant functional groups. Atlantis-CCAM includes spatial closures to certain fishing gears; Ecosim-NCC is not spatially explicit.
For each simulation other than status quo, we chose one forage group of interest and applied a range of experimental fishing mortality rates (F) varying from 0 to an upper limit that resulted in extirpation of the group. Within a single simulation, fishing mortality rates (% yr−1) were kept constant over 50 years. We report these fishing mortality rates as realized fishing mortality rates, equivalent to catch/biomass for a reference year. All other forage groups and other harvested species were fished with status quo harvest rates.
Since the groups of interest had reached quasi-equilibrium by the end of the simulation, we assumed that the average biomass and catch in the final years were a proxy for equilibrium biomass and yield. In Atlantis-CCAM, for all groups except euphausiids, biomass and yield were averaged over the final five years (years 46–50) to smooth over seasonal and interannual variations driven by the oceanographic model (ROMS). The euphausiid group exhibited highly variable biomass dynamics due to its high productivity and rapid turnover rate. Therefore, biomass and yield for euphausiids were averaged over the last 20 years of the simulation (years 31–50). In Ecosim-NCC, which has no seasonal variation, the biomass and yield were taken from the final year of the simulations; neither euphausiids nor other forage groups demonstrate strong seasonality or interannual variability in Ecosim-NCC.
We took the biomass from the final year(s) of the F = 0 simulation as our estimate of unfished biomass (B100). We plotted equilibrium biomass versus F and equilibrium yield versus F from all simulations (Appendix 2, Figs S2.1–S2.18, see supplementary material at Journals.cambridge.org/ENC). From these plots we estimated reference points including F at MSY (FMSY), F0 (which drives the stock to extinction), F20 (which drives the stock to B20, 20% of B100), F40 (which drives the stock to B40, 40% of B100) and F75 (which drives the stock to B75, 75% of B100).
Harvest scenarios: simultaneous depletion of four forage groups
The final set of simulations involved simultaneous depletion of four forage groups in each model. Using a set of fishing mortality rates (either F0, F20, F40 or F75) determined above, we simulated 50 years of joint harvest of forage fish, euphausiids, mesopelagic fish and mackerel. Note that interactions between species imply that a fishing mortality rate (such as F20) that caused a specific level of depletion (for example 20% of unfished abundance) in the single-species tests might lead to different depletion levels under joint exploitation of all forage species.
Quantifying proportion of groups with >20% response
Impacts on groups other than the focal forage group were identified by calculating a response ratio, equal to the equilibrium biomass of each group, relative to its equilibrium biomass in the scenario with no fishing on the focal group and status quo fishing on all others (for example Appendix 3, Fig. S3.7, see supplementary material at Journals.cambridge.org/ENC). For instance, we ran one fifty-year simulation with heavy fishing on forage fish, and a second with no fishing on forage fish, and found that in the former simulation a rockfish group (yelloweye and cowcod) had 45% lower final abundance than in the latter. We therefore recorded a –0.45 response ratio of this rockfish group to forage fish depletion. We also calculated the percentage of groups that changed in biomass (positive or negative) by more than 20% over the 50-year simulation. We chose 20% as the cut-off, rather than the 40% threshold used in the global analysis of Smith et al. (Reference Smith, Brown, Bulman, Fulton, Johnson, Kaplan, Lozano-Montes, Mackinson, Marzloff, Shannon, Shin and Tam2011), since for this region specifically we observed many groups with responses of between 20–40%. Note that this portion of the analysis retains the original taxonomic resolution of the individual models (namely species or functional groups).
Comparing standardized output between models
Since Atlantis-CCAM and Ecosim-NCC have slightly different taxonomic resolution of functional groups, we aggregated output into standardized functional groups that were consistent between models (Appendix 4, Table S4.1, see supplementary material at Journals.cambridge.org/ENC). This allows direct comparison of the two models’ predictions. We plotted the response ratios of each standardized functional group, averaging responses of component groups (for example the standardized group ‘slope rockfish’ had an Atlantis response ratio that was the average of the response ratios of Atlantis groups ‘deep small rockfish’ and ‘deep large rockfish’). In order to quantify differences in the diet compositions of the two models, we also used this aggregated approach, calculating average diet compositions for each model after aggregating predators and prey into standardized groups (Appendix 4, Table S4.2, see supplementary material at Journals.cambridge.org/ENC).
To provide context for our results, we summarize previous studies estimating optimal fishing rates for forage groups from a single species perspective, and previous multi-species modelling focused on sardines in Appendix 1 (see supplementary material at Journals.cambridge.org/ENC).
RESULTS
Mackerel
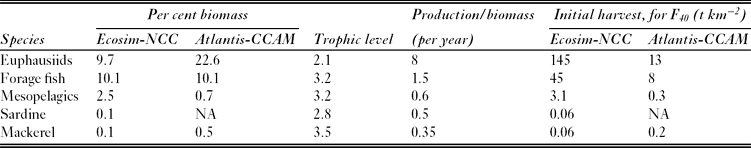
In Ecosim-NCC, mackerel have a low relative biomass and production (Table 1), as this model was initialized to represent a period when mackerel biomass was at record low levels. Hence, fishing this group had very little effect on the ecosystem (Fig. 2; Appendix 2, Figs S2.1 and S2.2; Appendix 3, Figs S3.1 and S3.2, see supplementary material at Journals.cambridge.org/ENC). Simulated harvests were very low, for instance 0.06 t km−2 in the F40 case for 2008 and all subsequent years (Table 1). Several prey species showed slight increases and one predator (albacore Thunnus alalunga) showed a slight decrease in response to mackerel fishing. However, these responses were all <10%. Biomass yielding MSY was equal to 41% of unfished biomass, and harvesting the stock to this level similarly did not lead to responses in the food web of >10%.
Table 1 Biomass as a percentage of the total ecosystem biomass in the Ecosim-NCC and Atlantis-CCAM models, and production rate per year of forage species in the Ecosim-NCC model. The Atlantis model does not have a production rate input. Depletion experiments were run for all groups listed here. Trophic level is estimated within the Ecosim model. ‘Initial harvest for F40’ allows comparison of the scale of biomass removal for each species, representing the catch during the first year of a simulation in which fishing mortality is set such that equilibirum biomass reaches 40% of unfished levels.
Figure 2 Per cent of species or functional groups in Ecosim-NCC (solid lines) and Atlantis-CCAM (dashed lines) that exhibit changes in biomass of >±20% when forage groups are depleted below unfished levels. A value of 1.0 on the x-axis represents abundance of the forage group when it is not fished, while a value of 0.4 represents depletion of a focal forage group to 40% of unfished abundance. Focal forage groups are as follows: euphausiids = triangles; forage fish = diamonds; mesopelagic fish = crosses; mackerel = squares; sardines in Ecosim-NCC = circles. Crosses represent simultaneous depletion of forage fish, euphausiids, mesopelagic fish, and mackerel. Vertical lines of the same colours represent abundance of each forage group that leads to maximum sustainable yield in the two models (only position on the x-axis is relevant, y-position is for graphical clarity only).
In Atlantis-CCAM, depletion of mackerel (large planktivores) also had minor impacts on the food web (Fig 2; Appendix 2, Figs 2.3 and 2.4; Appendix 3, Figs S3.1 and S3.3. see supplementary material at Journals.cambridge.org/ENC). Compared to total system biomass, mackerel harvests were low, for instance less than 0.2 t km−2 in the F40 case (Table 1). Two prey items of mackerel, shrimp and euphausiids (large zooplankton), increased by >20% as mackerel were depleted. The model also predicted subsequent reciprocal decreases in copepods (mesozooplankton). Coastal sharks were the only predator that declined substantially (>20%) due to depletion of mackerel. Mackerel maximum yield could be achieved at 25% of unfished levels, and harvesting the stock to this level impacted only euphausiids and coastal sharks by >20%. Differences in species compositions and diets between the models explain the strong shark decline in Atlantis-CCAM and the absence of this decline in Ecosim-NCC. The pelagic shark group in Atlantis (one of two functional groups in the standardized ‘coastal shark group’) has a diet composition initialized to be 9% mackerel, and declines strongly, for instance falling 56% in the case with mackerel fished down to B40. The loss of the mackerel caused a decline in pelagic shark adult condition (weight-at-age) of >50%, with a consequent drop in fecundity and recruitment. In Ecosim-NCC, this shark group has initial diets of only 3% mackerel (Appendix 4, Table 4.2, see supplementary material at Journals.cambridge.org/ENC), reflecting heavier weighting of diet information for species such as soupfin shark (Galeorhinus galeus).
Forage fish
Fishing the forage fish group (which excludes sardine) in Ecosim-NCC affected nearly every other group in the ecosystem (Figs 2 and 3; Appendix 2, Figs S2.5 and S2.6; Appendix 3, Fig. S3.4, see supplementary material at Journals.cambridge.org/ENC). The simulations suggested that MSY was achieved at c. B40, but depletion to B40 or lower resulted in changes of >±20% for nearly half of all functional groups (Fig. 2). Protected groups declined, including pinnipeds, sooty shearwaters and other seabirds (Fig. 3). Commercial fishery targets such as piscivorous flatfish (halibut Hippoglossus stenolepis and arrowtooth flounder Atheresthes stomias) also declined, while rockfish (Sebastes spp.) showed strong responses in both positive and negative directions. Forage fish depletion to B40 or lower involved very high initial (2008) harvests, for instance 45 t km−2 in the F40 case (Table 1). Depletion of forage fish released euphausiids and copepods from predation pressure, resulting in increased abundance of those groups. This in turn provided more prey for higher trophic levels, many of which (including mesopelagics) increased in abundance. The groups that increased in biomass included some predators of forage fish such as midwater and canary rockfish. This redirection of available biomass through the euphausiid pathway did not benefit all the predators of forage fish, however. Some predators, including large piscivores (salmon, sharks, sablefish Anoplopoma fimbria), seabirds and marine mammals declined in response to the depletion of their main prey items.
Figure 3 Impact of alternative fishing mortality levels for forage fish (small planktivores) on other components of the ecosystem. A value of 0 on the x-axis represents no difference from a base case equilibrium biomass (no fishing on this forage group); +0.2 indicates values 20% higher than the base case, and –0.2 indicates values 20% lower than the base case. For each group or species, the top bar in the stack of eight horizontal bars represents predictions from Atlantis-CCAM at a fishing mortality rate of F0 (extirpation of forage group), followed by predictions from Ecosim-NCC at F0, then a similar pair for F20, F40, and F75. (In the online version, purple bars are predictions from Atlantis-CCAM, and grey bars are predictions from Ecosim-NCC). Increases of >1.0 for the F40 case are noted to the right of the figure. Model results are presented in terms of standardized functional groups that are consistent across models; carnivorous zooplankton and sardine are reported only for Ecosim-NCC because these were aggregated with other forage species in Atlantis-CCAM (Appendix 3 includes similar figures at the original taxonomic resolution of each model, see supplementary material at Journals.cambridge.org/ENC).
Sardines in Ecosim-NCC have a low relative biomass and production, as the model was initialized during a period of low abundance (Table 1) and was not able to adequately replicate the observed recovery in the 1980s and 1990s (Field et al. Reference Field, Francis and Aydin2006). Understanding drivers of such regime shifts for small pelagic fish, and representing these drivers in models, is critical but challenging (Checkley et al. Reference Checkley, Alheit, Oozeki and Roy2009). Models of other systems that do qualitatively represent such regime shifts include time-varying availability of plankton to individual fish species, for instance mimicking specific feeding requirements of sardine versus anchovy (Shannon et al. Reference Shannon, Field and Moloney2004); however, no model is currently available for the California Current that captures these dynamics. Hence, due to the low biomass of sardine in 2007 in Ecosim-NCC, fishing this species affected no other group by >20% even when sardines were depleted well below 41% of unfished abundance, the level predicted to achieve maximum yields (Fig. 2; Appendix 2, Figs S2.7 and S2.8; Appendix 3, Figs S3.5 and S3.6, see supplementary material at Journals.cambridge.org/ENC).
Atlantis-CCAM simulations suggested that the sustainable yield of forage fish (including sardines) was at a maximum when the population was at 53% of unfished abundance. However, depletion below B75 led to strong impacts on the rest of the food web. Harvest to B40 or lower abundances led to changes of >±20% on one-fifth of all functional groups (Figs 2 and 3; Appendix 2, Figs S2.9 and S2.10; Appendix 3, Fig. S3.7, see supplementary material at Journals.cambridge.org/ENC). Depleting abundant forage fish to these levels involved high initial harvests, for instance 8 t km−2 for F40 (Table 1). Considering the original Atlantis-CCAM taxonomy, rather than the standardized functional groups, reveals declines of >20% for the piscivorous group yelloweye rockfish (Sebastes ruberrimus) and cowcod (S. levis), which was initialized to have a diet of 33% forage fish. Both yelloweye rockfish and cowcod are species of conservation concern and are currently classified as overfished. However, standardized groups (Fig. 3) did not decline by >10%. Harvest of forage fish in the model had positive effects on several prey and competitors of forage fish (Fig. 3). These included euphausiids (large zooplankton), microzooplankton and cephalopods. A euphausiid predator, mackerel, more than doubled, as did mackerel's predator, coastal sharks. Copepods (mesozooplankton) declined as predation by euphausiids increased. Atlantis-CCAM did not predict strong declines in marine mammals or birds due to forage fish depletion.
Though Atlantis-CCAM responded strongly to forage fish depletion, compared to Ecosim-NCC the impacts were less severe and there were fewer cascading effects. The higher levels of productivity, and therefore catch, simulated in Ecosim-NCC rather than in Atlantis-CCAM (for example MSY of 23 t km−2 versus 3.1 t km−2) partially account for the stronger food web response in the former model. Several of the groups that responded strongly in Atlantis-CCAM also did so in Ecosim-NCC (and in the same direction). These included other forage groups such as euphausiids (large zooplankton), mackerel and cephalopods. Differences in diet compositions (Appendix 4, Table S4.2, see supplementary material at Journal.cambridge.org/ENC) between models explain contrasting responses of coastal sharks, copepods and salmon. Both sharks and salmon are assumed 50–100% more dependent on forage fish in Ecosim-NCC than Atlantis-CCAM; the former model therefore predicts declines in these predators as forage fish are depleted. Additionally, forage fish in Ecosim-NCC have diets initialized to be twice as dependent as Atlantis-NCC on copepods, and Ecosim therefore predicts increases in copepods as forage fish are depleted.
Mesopelagic fish
In Ecosim-NCC, the simulated fishery for mesopelagic fish had an effect on many groups, but most changes were small. Less than 5% of functional groups were affected by >20%, even when mesopelagics were completely depleted (Fig. 2). Harvests of mesopelagics were relatively low, for instance <3.1 t km−2 for F40 (Table 1). As mesopelagics were depleted, several fish predators of mesopelagics declined, including commercially targeted groups such as longspine thornyhead (Sebastolobus altivelis), shelf rockfish and albacore (Appendix 3, Figs S3.8 and S3.9, see supplementary material at Journals.cambridge.org/ENC), although only albacore declined by more than 20%. Carnivorous zooplankton and large jellyfish showed moderate increases under high levels of fishing on mesopelagics (depletion to B20 or lower). This, combined with the decline in some of the predatory fish, supported the small increases seen in some of the fish groups, such as mackerel and hake. MSY was achieved at 37% of unfished abundance (Appendix 2, Figs S2.11 and S2.12, see supplementary material at Journals.cambridge.org/ENC); fishing the population down to this level did not cause changes of >20% in any other group.
The trophic impacts of a harvest of mesopelagic fish (deep vertical migrators) in Atlantis-CCAM were minor, with most impacts <20% (Fig. 2; Appendix 2, Figs. S2.13 and S2.14; Appendix 3, Figs 3.8 and 3.10, see supplementary material at Journals.cambridge.org/ENC). This was true at biomass levels leading to maximum yield (58% of unfished levels) as well as more severe depletion. Simulated harvests of mesopelagics were relatively low in terms of total tonnes, <0.3 t km−2 for F40 (Table 1). Salmon declined 33% when mesopelagic fish were extirpated, but no other group responded to this simulation by >20%. Slight increases in coastal sharks were due to minor increases in mackerel abundance, consistent with the strong linkage in Atlantis-CCAM between these groups described above. The decline in albacore predicted by Ecosim-NCC was not predicted by Atlantis-CCAM: in contrast to Ecosim-NCC, in Atlantis-CCAM albacore have broader diets, are less reliant on mesopelagic fish (Appendix 4, Table S4.2, see supplementary material at Journals.cambridge.org/ENC), and switch to alternative prey without declining in abundance. Overall, the relatively low biomass of mesopelagics in the models, and the focus of both models on groundfish species, contributed to the minor impacts seen here.
Euphausiids
Ecosim-NCC predicted that MSYs of euphausiids could be achieved at B40, but with the consequence that 30% of other groups were impacted by >±20% (Figs 2 and 4; Appendix 2, Figs S2.15 and S2.16; Appendix 3, Fig. S3.11, see supplementary material at Journals.cambridge.org/ENC). Associated levels of euphausiid harvest were very high, for instance 145 t km−2 in 2008 in the F40 case (Table 1). Many predators of euphausiids declined by >20% when euphausiids were depleted to the B40 level, including target species for other fisheries such as midwater rockfish, mackerel and hake. Other harvested species such as dogfish also declined, but by <20%, as did baleen whales and mesopelagic fish.
Figure 4 Impact of alternative fishing mortality levels for euphausiids on other components of the ecosystem (see Fig. 3 for a detailed explanation of symbols).
As euphausiids were depleted in Ecosim-NCC, their prey, copepods and microzooplankton, increased in abundance (Fig. 4; Appendix 3, Fig. S3.11, see supplementary material at Journals.cambridge.org/ENC). More than twice as much production goes from copepods to the third trophic level than from euphausiids. Therefore increases in copepods provide more food for the key mid-trophic level groups (such as forage fish). The increase in forage fish in turn provides food either directly or indirectly for many other species, including those that prey upon euphausiids. Thus some predators of euphausiids increased in abundance, including several flatfish and bird groups, salmon and shelf rockfish. Other groups, including sablefish, carnivorous zooplankton and sardine, decreased under moderate depletion of euphausiids, but increased under high levels of depletion when the increase in copepods was greatest. This switching of responses is caused by increases in the energy pathway supporting forage fish.
Euphausiids in Atlantis-CCAM yielded maximum sustainable harvest when depleted to B24, but depletion to this level caused moderate declines in many mid-trophic level groups, primarily predators on euphausiids. Overall, c. 13% of functional groups were impacted by >±20% when euphausiids were depleted to B40, and 20% of groups were impacted by >±20% when euphausiids were completely depleted (Figs 2 and 4; Appendix 2, Figs 2.17 and 2.18; Appendix 3, Fig. S3.12, see supplementary material at Journals.cambridge.org/ENC). Harvest levels in 2008 associated with F40 were relatively high, at 13 t km−2 (Table 1). Euphausiid depletion led to declines of 20–90% for salmon, mackerel, forage fish, coastal sharks, cephalopds, mesopelagics and microzooplankton. Euphausiid depletion also led to declines of 10% or less for three protected groups (baleen whales, toothed whales and seabirds), as well as dogfish and midwater rockfish (Fig. 4). Jellyfish (gelatinous zooplankton) did not increase in the B40 case, but did increase by 23× when euphausiids, and therefore all associated competition and predation, were eliminated. Copepods (mesozooplankton) increased by 9% and 20% for euphausiid depletion to B40 and full depletion, respectively. The increases in copepods in Atlantis-CCAM were consistent with predictions from Ecosim-NCC, though the latter model predicted higher magnitudes of increase. In Atlantis-CCAM this was not accompanied by increases in predators of these plankton groups.
Both models include high biomass and productivity of euphausiids, but the stock was more productive in Ecosim-NCC than Atlantis-CCAM, with the former model having five times more unfished biomass and 200 times greater MSY. Nevertheless, in response to euphausiid depletion, predators declined in abundance in both models; both representations of euphausiids suggested they are a key forage group in the food web. Some predators such as mackerel, mesopelagic fish, and cephalopods, declined in both models. Disparities between the responses in salmon and forage fish are not due to differences in diets (Appendix 4, Table S4.2, see supplementary material at Journals.cambridge.org/ENC) but to the more moderate increases in copepods in Atlantis-CCAM, which fuelled increase in these predators in Ecosim-NCC. The decline in mackerel was consistent across both models as euphausiids were depleted, but Atlantis-CCAM has heavier reliance of coastal sharks on mackerel than does Ecosim-NCC (Appendix 4, Table 4.2, see supplementary material at Journals.cambridge.org/ENC), and therefore only in Atlantis-CCAM do coastal sharks decline when euphausiids are depleted. The broad effect that euphausiid depletion had on the food web was expected (Pacific Fishery Management Council 2008), in part because they comprise 10–25% of the total consumer biomass in the system.
Simultaneous depletion of all forage groups
Simultaneous depletion of four forage groups impacted 75% of groups in Ecosim-NCC and 25% of groups in Atlantis-CCAM by more than ±20% (Figs 2 and 5). This was approximately equal to the number of groups impacted by depleting forage fish in Atlantis-CCAM, and greater than the impacts of depleting any single forage group in Ecosim-NCC. Overall, Atlantis-CCAM predicted that groups would respond to simultaneous depletion in a manner similar to their response to depletion of forage fish only. For instance, fishing mortality rates (F75, F40, F20) that would have led to declines in euphausiids and mackerel if implemented for these groups individually instead led to increases in euphausiids and mackerel, as for the forage fish depletion simulations above. In Ecosim-NCC, forage fish, euphausiids, mesopelagic fish and mackerel all declined in these simulations, but to levels that were c. 10% higher than when depleted individually. Overall, Ecosim-NCC predicted that joint depletion of these four groups would lead to food web responses that mirrored those from the forage fish depletion, with the addition of the most dramatic impacts of euphausiid depletion (strong declines in hake and midwater and canary rockfish, and strong increases in copepods).
Figure 5 Impact of alternative fishing mortality levels applied simultaneously to mackerel, forage fish, mesopelagic fish and euphausiids (see Fig. 3 for a detailed explanation of symbols). Fishing mortality rates (F75, F40, F20, F0) are those estimated from simulations testing depletion of each forage group individually.
DISCUSSION
Given the growing interest in ecosystem-based fisheries management (US Commission on Ocean Policy 2004; McLeod & Leslie Reference McLeod and Leslie2009), a broader perspective may be justified that seeks to evaluate ecosystem-wide impacts of fishing on forage groups. In the California Current, precautionary harvest rules are used for anchovies, sardines and mackerel to account for consumption needs of these species’ predators. The current sardine harvest control rule is intended to keep average stock size at B64, substantially above BMSY = B46. The B64 target was set to minimize impacts to dependent predators, based on defining a point on a yield curve where a one tonne increase in sardine catch was associated with an average decline in standing sardine biomass of >10 t. Maintaining biomass above B64 would therefore avoid disproportionate impacts on the ecosystem based on predator needs and a simplistic (but reasonable) assumption of trophic transfer efficiencies on the order of 10% (Parrish Reference Parrish2008). The sardine control rule is also intended to buffer against poor environmental conditions, when sardine production is too low to support fisheries, and allow for higher exploitation rates during more productive periods (Jacobson & MacCall Reference Jacobson and MacCall1995). Thus, current management practices are ecosystem-based, but are not based on explicit predictions regarding which predators will be impacted and to what magnitude. Our modelling is one step forward, providing these predictions and indicating ecosystem impacts beyond just predators of forage species. The models provide an ecosystem context and identify key species in the food web, but are not intended to provide precise tactical guidance.
We found that depleting forage groups can have both positive and negative impacts on other groups in the California Current. The most common impacts were on predators of forage groups, some of which showed declines of >20% under the scenarios that involved depletion of forage groups to 40% of their unfished biomass. There were still substantial effects on some groups at the B75 level, although the magnitudes of change were smaller. Depletion of euphausiids (currently unexploited) and forage fish such as sardines (currently exploited) had the largest impact on other species. These forage groups each comprise >10% of system biomass. Building on the analysis of Smith et al. (Reference Smith, Brown, Bulman, Fulton, Johnson, Kaplan, Lozano-Montes, Mackinson, Marzloff, Shannon, Shin and Tam2011), we found that the Ecosim-NCC model predicted that B40 was a reasonable proxy for biomass at MSY, whereas Atlantis-CCAM predicted that MSY occurred over a broader range of stock sizes, from between 24% and 53% of unfished biomass. However, regardless of whether the forage fish and euphausiids were depleted to these precise reference points or simply to B40 as a proxy, the pattern of impacts on the food web was similar, and predators often declined. In addition, both models predicted increases in copepods under euphausiid depletion scenarios.
Impacts on bird and mammal groups were limited, though this may be due to the fact that we were simulating coast-wide (or in the case of Ecosim, non-spatial) fishing mortality. In nature, local depletion of forage stocks could have stronger impacts on these species, particularly for central-place foragers and especially for critical life stages such as fledgelings (Ainley et al. Reference Ainley, Dugger, Ford, Pierce, Reese, Brodeur, Tynan and Barth2009; Hipfner Reference Hipfner2009). In Atlantis-CCAM, depletion of euphausiids or forage fish to 40% of unfished levels did not reduce any bird or mammal groups by >20%. In Ecosim, depleting forage fish to 40% of unfished levels led to >60% declines in seabirds and pinnipeds.
Contrasts between models: geography, data and functional forms
The two models both cover the northern extent of the California Current, though Atlantis-CCAM extends much further south (Fig. 1). Ecosim-NCC has slightly more trophic resolution at a species level, but the models are quite similar in detail and level of system definition. The greatest difference is the use of age structure in Atlantis-CCAM for all vertebrates, whereas Ecosim-NCC has no age structured groups. Moreover the Atlantis-CCAM focuses on demersal species, while Ecosim-NCC has been used more extensively for modelling pelagic species. Nevertheless, the two models provide comparable representations for much of the ecosystem. Though there are differences between models in terms of forage fish and euphausiid biomass and productivity, our results related to the importance of forage fish and euphausiids are generally robust to model differences, and are valuable in evaluating the trade-offs that could come from substantive fisheries for forage groups. The differences between the two models with respect to forage groups’ abundance, productivity and potential catches underscore true uncertainty about these quantities in the California Current (for example Pacific Fishery Management Council 2008, section 3.1.3.4).
As noted above, forage group depletion generally impacted more groups in Ecosim-NCC than in Atlantis-CCAM, and these impacts were larger. Third-order responses (for example where depletion of a group led to increased abundance of its prey and thus increased abundance of the prey's predators) were moderately common in Ecosim-NCC, but were less common in Atlantis-CCAM. Predators directly impacted in Atlantis-CCAM by the loss of euphausiids or forage fish were generally similarly impacted in Ecosim-NCC, though there were additional predators impacted in the latter model. Atlantis-CCAM differs from Ecosim-NCC in at least three key aspects that might reduce the magnitude of response to fishing: (1) full age structure delays the reproductive response of the population, since individuals younger than age-at-maturity cannot breed, and no individual can breed prior to the annual spawning season; (2) predator access to prey is limited by gape restrictions and the need for spatial overlap between predator and prey; and (3) a different predator-prey functional response formulation increases diet switching. Better understanding of predator-prey interactions and the scales of predator-prey overlap will improve ecosytem models in the future, but these issues also illustrate the choices and assumptions inherent to ecosystem modelling, and the need for exploration involving multiple models. Here we began to address model uncertainty by applying two different model structures, Atlantis and Ecosim; future work is needed to explore model representations of climate variability and the importance of full size and age structure (for example Atlantis-CCAM) versus biomass pools (for example Ecosim-NCC), particularly for mammals and birds.
CONCLUSION
Our work emphasizes trade-offs between harvest of forage species and the ability of the California Current ecosystem to sustain populations at other trophic levels. The results are consistent with recent global research on forage species, and with the needs of local fishery managers. As mentioned above, Smith et al. (Reference Smith, Brown, Bulman, Fulton, Johnson, Kaplan, Lozano-Montes, Mackinson, Marzloff, Shannon, Shin and Tam2011) found that our results from the California Current are consistent with predictions from three different types of ecosystem models applied to the Humboldt Current, Benguela Current, North Sea and south-east Australia continental shelf. Multi-species (Ecosim) modelling by Walters et al. (Reference Walters, Christensen, Martell and Kitchell2005) found that for 11 ecosystems, simultaneous harvest of all groups (including forage) at rates estimated based on single-species MSY led to an erosion of ecosystem structure, and declines in top predator biomass and catch. Recently, Pikitch et al. (Reference Pikitch, Rountos, Essington, Santora, Pauly, Watson, Sumaila, Boersma, Boyd, Conover, Cury, Heppell, Houde, Mangel, Plagányi, Sainsbury, Steneck, Geers, Gownaris and Munch2013) analysed 72 food web (Ecopath) models and landings data and found that the global economic value of forage fish as prey for higher-trophic level species is approximately twice the landed value of forage fish themselves; they also found that 75% of these food webs had at least one predator that relied on forage fish for the majority of its diet. Simulation tests by Pikitch et al. (Reference Pikitch, Boersma, Boyd, Conover, Cury, Essington, Heppell, Houde, Mangel, Pauly, Plaganyi, Stanisbury and Steneck2012) led to their recommendations that fishery managers set aside 30% of the stock as unfished, limit fishing mortality rates to less than three-quarters of the single species optimum, and further reduce harvests when assessments and data are lacking. Their modelling suggests that typically this will necessitate harvest of forage fish to no lower than 80% of unfished abundance, comparable to the B75 reference point we have tested here for the California Current.
On the USA's West Coast, the Pacific Fishery Management Council (2011) has begun drafting a Fishery Ecosystem Plan that describes the local role of forage species and mechanisms involved in their management. Our results illustrate that, in particular, euphausiids and forage fish (such as sardines, anchovy and herring) play a key role in the California Current. Although higher trophic level species such as groundfish are often managed on the basis of reference points that can reduce biomass to below half unfished levels (Clark Reference Clark2002), this level of removal of these two forage groups is likely to result in significant changes in abundance of other target species, protected species and structure of the ecosystem. A reference point of B75 reduces these impacts on the California Current food web, but would also reduce fishery yields. In the context of ongoing policy decisions and monitoring (Bjorkstedt Reference Bjorkstedt2010; Zwolinski et al. Reference Zwolinski, Byers, Cutter, Renfree, Sessions, Macewicz and Demer2011), our results also identify a set of predators likely to respond strongly to depletion of forage fish and euphausiids (such as salmon, seabirds, pinnipeds, mackerel and hake). Monitoring of these species may reveal impacts of harvesting; importantly, such monitoring may also reveal abundance trends in the majority of forage species that are unharvested and unassessed.
ACKNOWLEDGEMENTS
Isaac Kaplan and Elizabeth Fulton acknowledge support from NOAA, CSIRO, the Gordon and Betty Moore Foundation, and the David and Lucile Packard Foundation. CSIRO co-authors were partly funded by the Marine Stewardship Council (MSC) to investigate ‘Developing best practice management for low trophic level fisheries: evaluation of harvest strategies’. Yvonne deReynier, Tessa Francis, Melissa Haltuch, Chris Harvey, Josh Lindsay and Phil Levin provided feedback on early drafts.