INTRODUCTION
Sub-Saharan Africa's population is growing rapidly, and it is getting wealthier and increasingly urbanized. Recently, it has been pointed out that while deficiencies of dietary energy and protein currently affect more than 800 million people in food insecure regions, micronutrient malnutrition may now afflict more than 2 billion people (Welch and Graham, Reference Welch and Graham2002). Particular for Africans, the common bean (Phaseolus vulgaris L.) is important as it provides the majority of the protein in their diet.
Despite its importance, beans are however seldom cultivated on fertile land and it is further often intercropped with maize or other crops. The majority of the beans are produced by smallholders for home consumption and only 20% reach a market (Hillocks et al., Reference Hillocks, Madata, Chirwa, Minja and Msolla2006). There is a lack of knowledge of how different genotypes of bean respond under farmers’ cropping conditions and the effect on the crop qualities, although studies under controlled conditions highlight nutrient interactions (e.g. Hacisalihoglu et al., Reference Hacisalihoglu, Ozturk, Cakmak, Welch and Kochian2004).
Average bean yields are low because of poor seed quality and local landraces being susceptible to pest and diseases as well as poor management and low soil fertility. Therefore, CIAT has, in a breeding programme in eastern and southern Africa, been developing new genotypes (Blair et al., Reference Blair, Gonzáles, Kimani and Butare2010; Hillocks et al., Reference Hillocks, Madata, Chirwa, Minja and Msolla2006) suitable for rainfed conditions and with a higher degree of disease resistance. This programme has focussed on achieving higher yields. But lately the nutritional quality of the grain has attracted more interest due to the recognition that more than 2 billion people increasingly consume diets that leads to deficiencies of especially Fe and Zn.
Significant international effects focus on exploiting the genetic variability in crops content of micronutrients like Fe and Zn in a so-called ‘biofortification’ approach (Blair et al., Reference Blair, Astudillo, Grusak, Graham and Beebe2009; Welch and Graham, Reference Welch and Graham2002). The genetic variability in Fe and Zn content in beans has, however, to our knowledge, never been tested under wide-ranged low-input environments that represent farmers’ conditions and management. Such testing should include a description of the multiple element composition because Fe and Zn uptake may interact with the availability of other nutrients like for example P. Further, it should be taken into account that we lack data on the element composition of bean under the biophysical conditions that are offered by resource-poor farmers.
The objectives of this study were: (1) to characterize the genotypic variability in the content of nutrients in bean, (2) to identify any interrelation between the nutrient contents in the grain, and (3) to investigate stability of the bean genotype × environment relation under farmers’ conditions in eastern and southern Africa.
MATERIALS AND METHODS
Experimental areas
Over two growing seasons, a variety of bean genotypes were tested at two sites in Tanzania and two sites in Malawi. The locations in Tanzania are considered as having a bimodal rainfall pattern with onset in the period of November–December for short rains and February–March/April for long rains. For the locations in Malawi, the rainfall pattern is uni-modal with onset in November–December.
In Tanzania, the sites were the districts of Kisanga (7°20′26 S, 36°44′13 E; approx. 800 m asl) and Gairo (6°08′21 S, 36°52′15 E; approx. 1200 m asl), and in Malawi it was in Dedza District around Bembeke Extension Planning Area (14°22′43 S, 34°19′59 E; approx. 1600 m asl) during the main rainy season (January–April) and in Salima District, it was planted in Kamuona Extension Planning Area (13°46′50 S, 34°27′31 E; approx. 500 m asl) during off rainy season in winter (May–August). Per season, 17 farmers participated in each country.
The seasons followed normal practices in the areas by planting at the onset of the rainy season in December and January for Tanzania and Malawi, respectively, termed the ‘wet season’. Similarly, planting at the end of the rainy season in April/May utilizing the residual soil moisture is termed the ‘dry season’.
Soil characteristics
The soils in Salima and Dedza are characterized as Ferallitic Latosols with medium textured sandy soil and sandy clay loamy overlaying sandy clay, respectively, and are generally considered rich in plant available P. The soils in Kisanga and Gairo sandy soils have low contents of plant available P.
Plant material
In Malawi, two partly different genotypic batches of improved varieties were trialled: Cal96, NH215664F2, NH21566F2CM6W, NH215667F2M7W, NH215668F2 and NH215661F2 during one season and Cal96, Napilira, NUA4, NUA30, NUA35, NUA43 and NUA59 during the following season. In Tanzania, the following varieties were trialled both seasons: Jesca, Lyamungo85, Lyamungo90Selian94, Selian97, Uyole84, Uyole96 and Wanja.
Crop management
The experimental plots were primarily managed by farmers but the extension agents or technicians influenced the planting and planting patterns. All data were collected by research technicians and processed at the research station.
Planting was done on 8–9 December and 5–10 June in Malawi, with parallel timing of planting in Tanzania. Only pure stands of beans were planted in Tanzania. In Malawi, however, the pure stands of beans were duplicated in a mixed cropping system under maize (Zea mays L.). The maize received inorganic fertilizers equal to 69 kg N ha−1, 21 kg P ha−1 and 21 kg S ha−1 whereas the pure stands of beans did not receive any fertilizers.
Each farmer planted 6–8 bean varieties (see above). The block of 6–8 plots in every farmer's field was not replicated but each farmer was considered as a single replicate. The individual plot was 5 m long with 5 ridges/rows spaced at 0.9 m apart. On each ridge/row all bean seeds were sown at a standard planting space of 10 cm between bean planting stations.
Sampling and analysis
Sampling took place at maturity, i.e. after leaf fall. Yields were estimated on basis of the two central rows of each plot. Bean plants for analysis were sampled from 1 m of the second row/ridge of each plot, processed and weighted. Sub-samples were divided into grains, pods, stems and roots. The roots were not used for further analysis. All samples were dried to constant weight at 60 °C and stored.
After grinding in a titanium-coated mill (SuperMill 1500, Newport Scientific Europe Ltd., Macclesfield, UK), sub-samples of the plant materials were digested in an open vessel system using 70-mL HD polyethylene vials (Capitol Vial, Fulton Ville, NY, USA) and a graphite-heating block (Mod Block, CPI International, Amsterdam, Holland) as described in details by Husted et al. (Reference Husted, Mikkelsen, Jensen and Nielsen2004). In brief, the plant material was first digested for 15 min in 35% HNO3 at 95 °C. After cooling, additional 70% HNO3 was added together with H2O2. During digestion, the vials were covered with HD-PE watch glasses. Samples were cooled overnight and diluted to 50 mL with ultra-pure water. After appropriate dilution, the samples were analysed by ICP-MS (Agilent 7500c, Agilent Technologies, Manchester, UK) for the following fifteen elements: B, Ca, Co, Cr, Cu, Fe, K, Mg, Mn, Mo, Na, Ni, P, S and Zn. Total N content of the plant material was analysed using an elemental analyser (ThermoQuest S.p.A., Milano, Italy).
Statistics and calculations
The element of Na, B, Ni, Cr, Mo and Co measured in grain was excluded from the subsequent analysis due to too low and unreliable values, leaving 10 elements measured in grain for the analysis.
Due to the potential risk of iron contamination during sampling and subsequent handling, two tests were conducted for each element and season to identify outliers. The identification of outliers was based on normality and outlier tests, subsequently, through the use of the ‘qqplot’ and ‘outliertest’ functions (R Core Team, 2012). If observations were judged ‘outliers’, they were cautiously excluded from further analysis.
Correlation, linear regression and t-tests were carried out using R (R Core Team, 2012). Robustness to environmental variation was tested via an adaptability analysis (Hildebrand and Russell, Reference Hildebrand and Russell1996) where the performance of the individual crop variety is plotted against the mean performance of the tested varieties across a wide range of environments.
RESULTS
Yield properties
The grain yields from the two countries differed (p < 0.001) as did the yields from the two cropping seasons (p < 0.001). The mean grain yields from Malawi were 912 kg dry matter per hectare and only 637 in Tanzania. Across all sites, the grain yields from the wet season reached only 363 versus 1160 kg dry matter per hectare in the dry season.
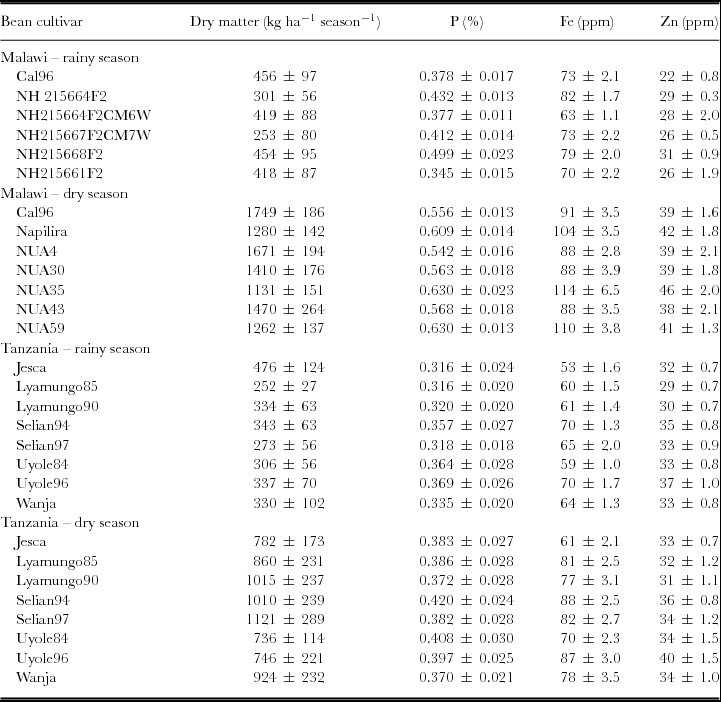
When calculating the grain yield as simple means across season and sites, it is seen from Table 1 that the grain yield in Malawi out-yielded those of Tanzania. The proportion of N (p = 0.24) and Zn (p = 0.79) did not differ in grains from the two countries in contrast to the proportions of P and Fe (p < 0.001).
Table 1. Seasonal dry matter grain yields per area unit and average proportions of phosphorus (P), iron (Fe) and zinc (Zn) in the grain dry matter of bean cultivars (Phaseolus vulgaris L.). The means are calculated as simple means across environments and across two cropping seasons, one relying on the early rain and one relying on residual moisture at the end of the rain season. Mean ± SE (n range from 5–8).

In Tanzania, the proportion of P in the grain at maturity could in a linear regression model explain the yield differences (p = 0.02) in the dry season where the crop relied on residual soil moisture. However, in the wet season where the crop were rainfed there were no relation between the proportion of P in the grain and grain yield (p = 0.20). The proportion of P could not explain the variation in grain yield when taking the two seasons together (p = 0.19).
In Malawi, the proportion of P in the grain at maturity could in a linear regression model explain the yield differences (p < 0.01) in both seasons, i.e. one relying on the early rain and one relying on residual moisture after the rainy season.
The varieties used in the two countries differed as those used in Malawi were heavier (p < 0.001) than those used in Tanzania; grain weight per 100 seeds were 45 g in Malawi versus 34 in Tanzania.
Cropping systems
In Malawi, the crop responses to sole cropping versus intercropping with maize were tested. The accumulations of dry matter did not differ (p > 0.05) in neither of the two seasons (data not shown). The proportions of P, Fe and Zn did not differ either.
Variable relations
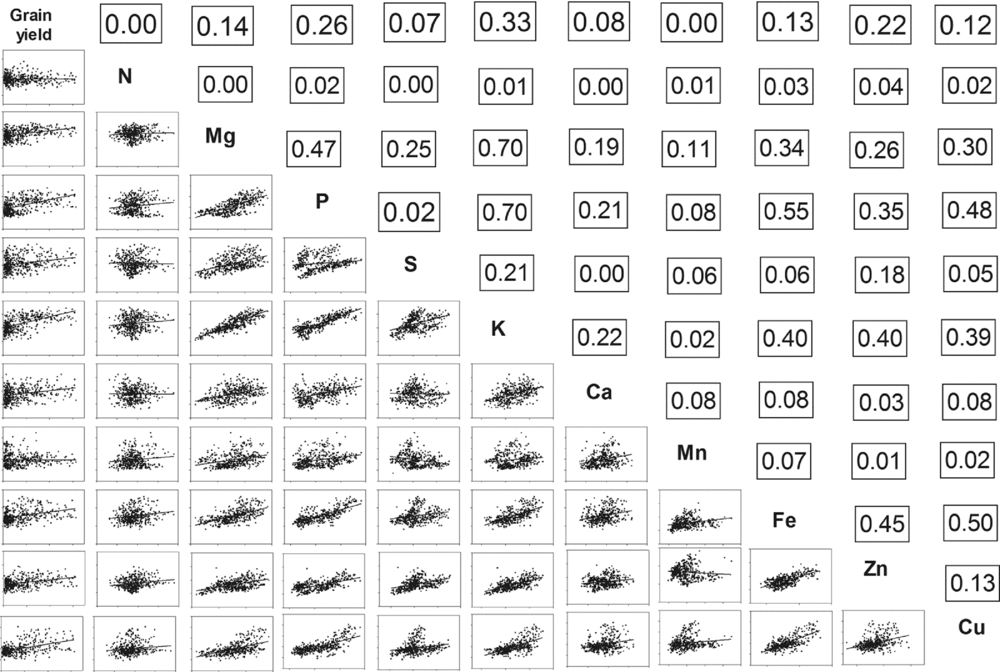
A correlation matrix (Figure 1) was used to identify those variables that are strongly related to each other. The grain dry matter yield correlated strongly (r 2 = 0.97) with total biomass accumulation (data not shown), taken for the whole dataset encompassing both cropping seasons and all sites. The formula is grain yield (kg ha−1) = −35.64 + 0.6317 × total dry matter, which means that approximately 60% of the total crop dry matter is located in the grain at maturity. It is also notable that P is strongly correlated to Mg (r 2 = 0.47) and K (r 2 = 0.70) and, further, that P is also related (r 2 = 0.55) to Fe and to some degree to Zn (r 2 = 0.35), while Fe is related to Zn (r 2 = 0.45) and Cu (r 2 = 0.50). It is further notable that the individual grain weight is not related (r 2 < 0.2) to the proportions of elements in the bean grain (data not shown). Due to too low and unreliable values of Na, B, Ni, Cr, Mo and Co, the potential interactions with other elements could not be investigated further.

Figure 1. A correlation matrix for all samples showing the variables for all sites, seasons and bean cultivars, including grain and total yield, weight of grains and proportions of elements in the grain dry matter. The correlation value (r 2) is shown above and that data is plotted below the diagonal; n = 430.
Adaptability to environmental variation
Potential differences among varieties in their response to environmental variations were tested via an adaptability analysis (Hildebrand and Russell, Reference Hildebrand and Russell1996) where the performance of the individual crop variety is plotted against the mean performance of the tested varieties across a wide range of environments.
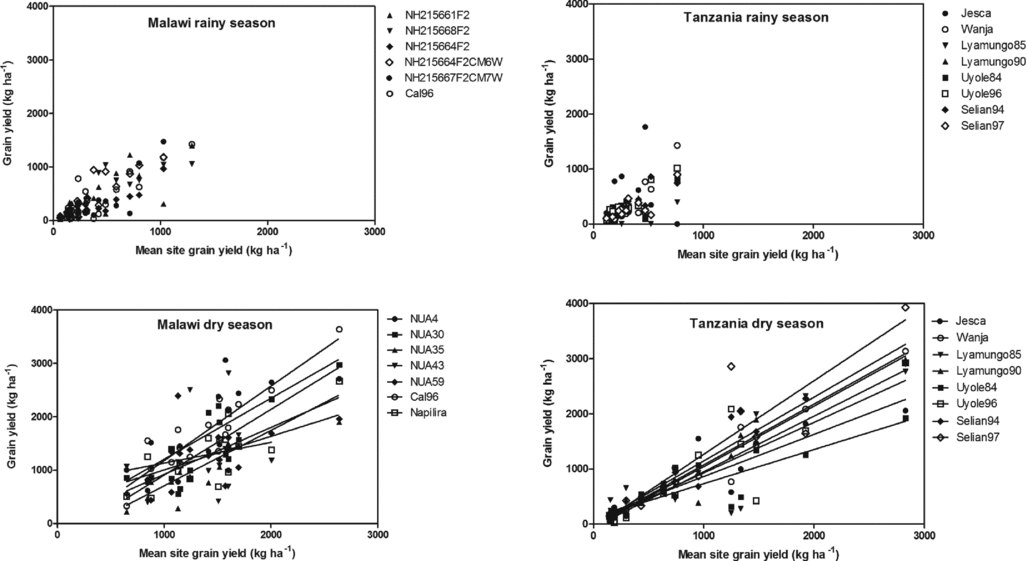
During the rainy season, no differences were detectable (Figure 2) in the accumulation of grain dry matter whereas differences emerged during the dry season. This may well be due to the differences in yield levels as the analysis basically depicts the performance of the individual genotype across a wide range of environments versus the mean performance of the tested varieties, which can indicate if some varieties perform better or worse.

Figure 2. Robustness in individual bean varieties’ performances in maintaining grain dry matter yield across environments for the individual bean varieties, plotted against the mean site yield.
During the dry season, there were no significant differences between the lines fitted to the observations in Malawi whereas the lines differed significantly (p < 0.05) in Tanzania. In Tanzania, the slopes of the lines (Figure 2, right) were in the following decreasing order: Selian97 > Selian94 > Lyamungo90 > Wanja > Lyamungo85 > Uyole96 > Jesca > Uyole84.
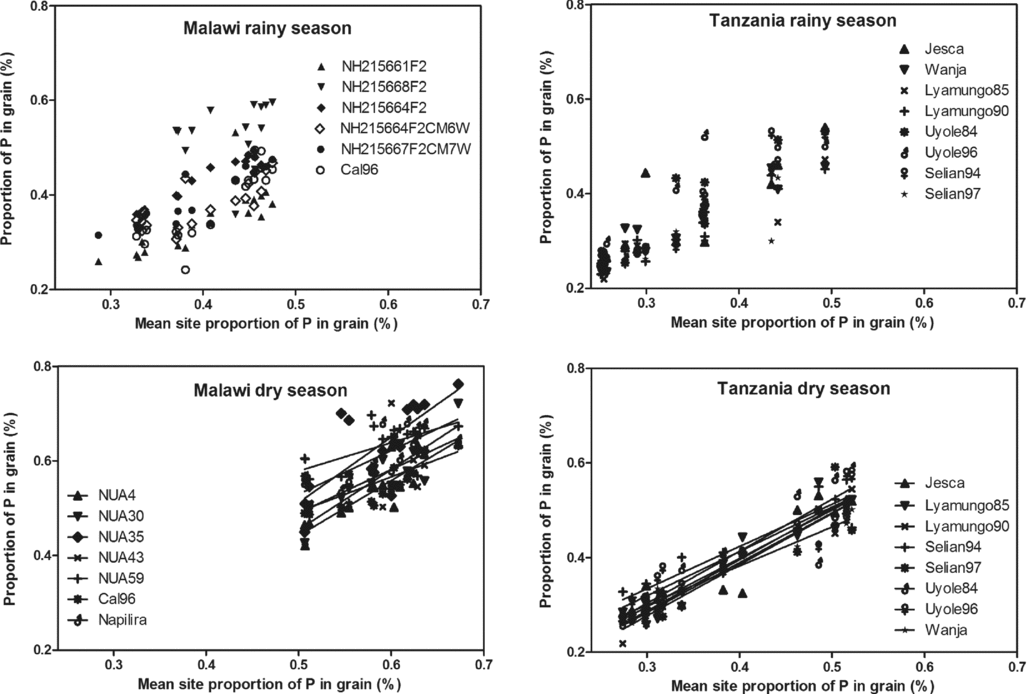
The proportion of P in the grain follows pretty much a 1:1 ratio – so there is no effect of environment here as the slopes of the fitted regression lines did not differ (p > 0.05) (Figure 3). This is surprising as the environment generally is considered P-scarce and as the proportions of P in the grain differed between countries (see Table 1). The two environments clearly gave different proportions (Figure 3) and most observations from Malawi indicate that P in no way could be viewed as a limiting factor for beans at the current site with a mean site P proportion of 0.5% in the grain. Further, there seems no reason to believe that the individual genotypes could maintain a higher proportion of P in the grain across a P limiting environments as it appears to be the case in Tanzania.

Figure 3. Robustness in individual bean varieties’ performances in maintaining the proportion of phosphorus (P) in the grain dry matter across environments for the individual bean varieties plotted against the mean site grain P content.
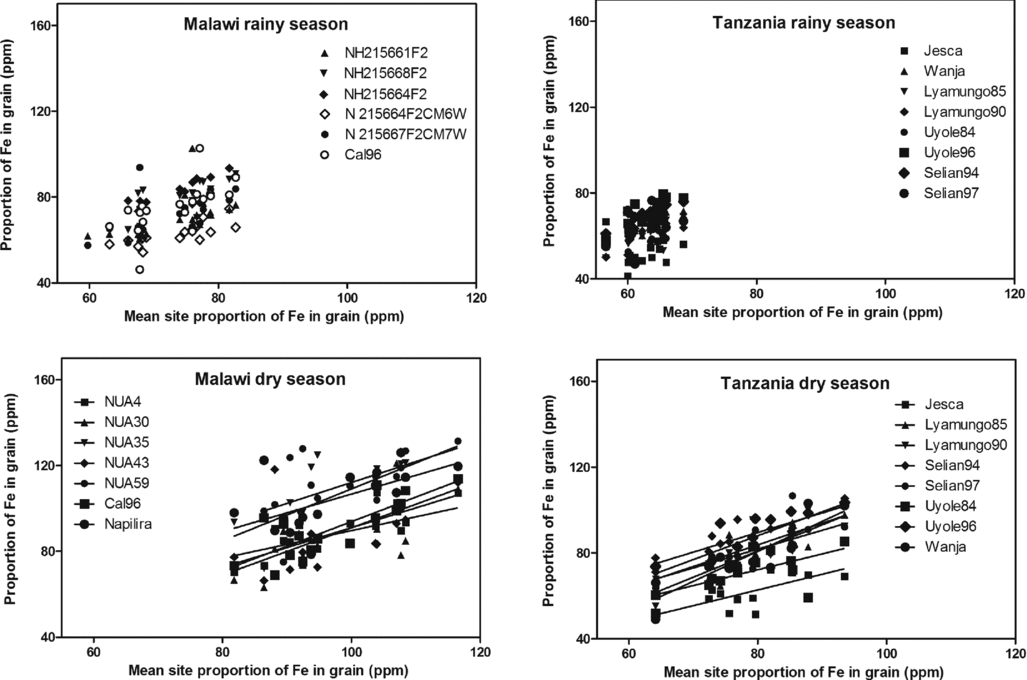
A similar picture emerges when plotting the proportions of Fe in the grain (Figure 4). Obviously the two sites gave a different proportion of Fe in the grain and some genotypes tended to be richer in Fe than others. During the dry cropping season, the 3 varieties with the highest proportion of grain Fe in Malawi were NUA35, NUA59 and Napilira, while they in Tanzania were Selian94, Uyole96 and Selian97. In the Tanzanian case, the varieties richest in Fe thus seem to be the highest yielding across environments.

Figure 4. Robustness in individual bean varieties’ performances in maintaining the proportion of iron (Fe) in the grain dry matter across environments for the individual bean varieties plotted against the mean site grain Fe content.
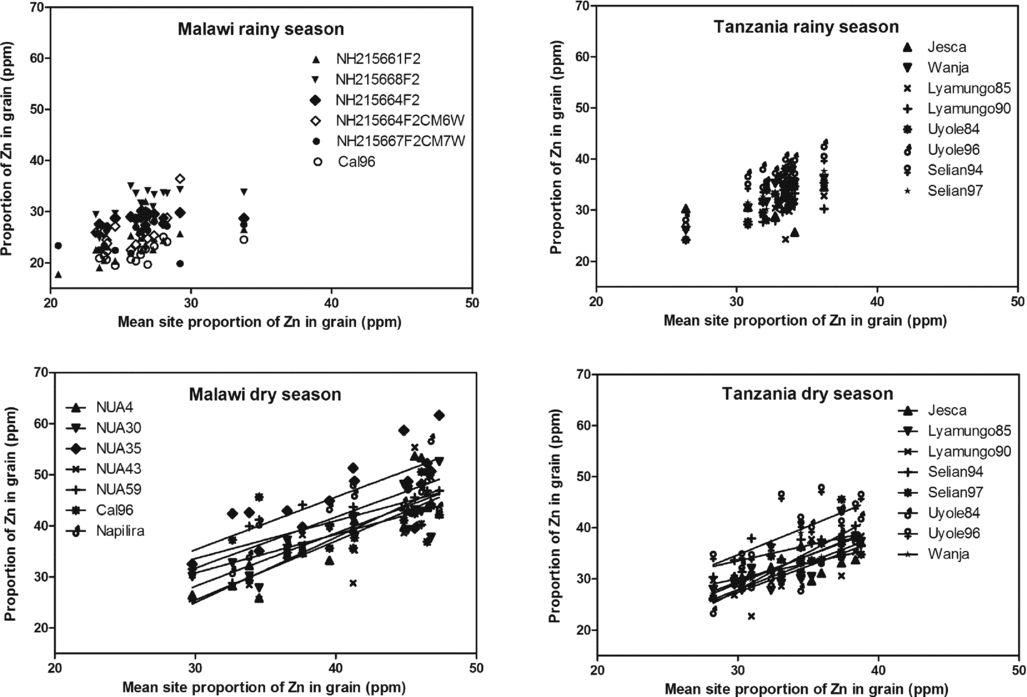
An almost identical picture emerged regarding the proportion of Zn in the grain (Figure 5). During the dry cropping season, the three varieties with the highest proportion of grain Zn content in Malawi were NUA35, NUA59 and Napilira, while the two varieties with the richest Zn content in Tanzania were Selian94 and Uyole96.

Figure 5. Robustness in individual bean varieties’ performances in maintaining the proportion of zinc (Zn) in the grain dry matter across environments for the individual bean varieties plotted against the mean site grain Zn content.
Further, a favourable season could enhance the proportion of Fe in the grains of the tested population by up to 20% whereas Zn did not respond significantly (Table 1, Figures 4 and 5) when comparing the same genotypes, i.e. Tanzania. In Malawi, the proportions of both Fe and Zn varied between seasons but this variation was confounded with genotypes.
Adaptability to environmental variation
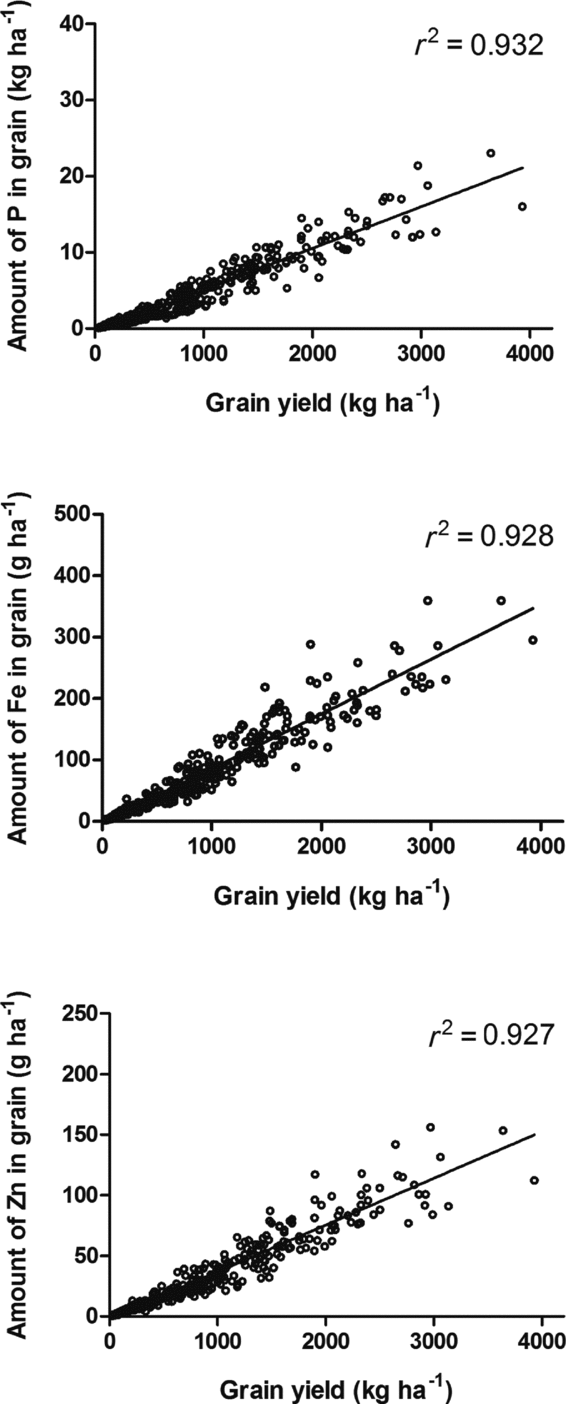
Total accumulation of P, Fe and Zn followed a linear relation with the grain yield per area unit (Figure 6). The potential varietal differences in proportions of the elements per grain weight unit were consequently equalized as demonstrated by correlation coefficients of approximately 0.93.

Figure 6. Dry matter grain yield per area unit versus the accumulation of phosphorus (P), iron (Fe) and zinc (Zn), respectively; n = 430.
DISCUSSION
A response is needed to the expected future of the region of Sub-Saharan Africa where an enhanced production is needed under diminishing resource availability with a substantial larger population, where the majority of the population will be urban and much wealthier.
Yield potentials of common bean are often reported to be around 2 tonnes grain per hectare under well-managed conditions (e.g. Chirwa et al., Reference Chirwa, Aggarwal, Phiri and Mwenda2007). Here we report yields that occasionally reached this level under farmers’ conditions – but only in the season that utilize the residual moisture at the end of the rainy season (Figure 2; Table 1).
The essential question for the improvement of any trait through plant breeding is the degree to which the trait is stable across environments (Beebe et al., Reference Beebe, Gonzales and Rengifo2000). Thus, we report on-farm trials under conditions that directly reflect the different environments in which resource-poor farmers grow a range of bean genotypes. The reporting includes yield and element fractions in the grain that are important for human health.
Proportion of elements and crop productivity
The current data (Figures 1–6) demonstrate that efforts to find the genetic material that tend to accumulate elements important for human well being in higher concentrations in the grains are justified as the best genotypes have a 20% higher proportion of Fe and Zn across environments (Figures 4 and 5) under the most favourable conditions. The stability of the enrichment traits that Welch and Graham (Reference Welch and Graham2002) looked for seems to be there.
An initial goal in the biofortification of bean was to enhance the concentration of Fe by 80% and Zn by 40%. Two aspects must however be taken into considerations. First, the tested 20 genotypes were selected among the most promising lines, so large differences between genotypes may not be expected. The current 20% may consequently indicate that the goal has been partly reached.
Secondly, it is also demonstrated that in most cases, such potential differences in concentrations may not be significant as the grain yield explains 93% of the variation in the content of P, Fe and Zn expressed under farmers’ conditions (Figure 6). Differences in enrichment of Fe and Zn under farmers’ conditions were only manifested in the dry season, as indicated by the linearity across environments in the Fe and Zn proportions (Figures 4 and 5). As genetic diversity is large in African bean populations (Blair et al., Reference Blair, Gonzáles, Kimani and Butare2010), the data presented in this paper consequently suggest that biofortification breeding efforts should be combined with the search for high-yielding traits under the conditions that farmers are offering the crop
The very consistent proportion (≈60%) of grain versus total crop biomass has also been found under very different conditions (Araújo and Teixeira, Reference Araújo and Teixeira2003). The variability seen in Fe and Zn concentrations corresponds to those reported by Blair et al. (Reference Blair, Astudillo, Grusak, Graham and Beebe2009) on basis of a more limited environmental range.
The ‘capacity’ of a particular site was measured here with the mean grain yield per genotype as a surrogate for an environmental index (Hildebrand and Russell, Reference Hildebrand and Russell1996). This index integrates climate, soil fertility, pests and weed pressures. Hildebrand and Russell (Reference Hildebrand and Russell1996) also concluded that the most suitable technology should result in a combination of larger yields and small SE, i.e. stability of yields of the current technology. This means that building on farmers’ capability and knowledge of their own environments may be the best way to enhance bean yields. That requires innovative approaches at farm level to test and select the best-suited genetic material (Figures 2–5) to that particular environment (Graham et al., Reference Graham, Rosas, Estevez de Jensen, Peralta, Tlusty, Acosta-Gallegos and Pereira2003).
Element interactions
Interesting, however, is the fact that grain size did not appear to explain the differences between the element concentrations although Malawi tended to have varieties that had individually larger grains (Table 1; Figure 1) and the grains with the highest proportion of P, Fe and Zn in the grain dry matter. That eliminates a theory of element dilution at the end of the grain-filling period that is often observed in bread wheat but not always in other crops (Cakmak et al., Reference Cakmak, Pfeiffer and McClafferty2010; Fan et al., Reference Fan, Zhao, Feirweather-Tait, Poulton, Dumham and McGrath2008). In other words, bean appears to continue to fill elements into the grain together with carbon while maturing. This is also observed in other gain legumes (Høgh-Jensen et al., Reference Høgh-Jensen, Myaka, Kamalongo, Rasmussen and Ngwira2006).
It is well know that too much P can induce Zn deficiency and too little P may hamper the bean growth significantly. In the current environments, P is positively correlated with Zn in the grain (Figure 1), indicating that the environmental range investigated may in most cases allow the bean crop to satisfy its P requirements if the growth conditions favoured the crops’ growth (Table 1; Figure 3). The apparent robustness in the proportion of Zn in the grain supports this conclusion (Figure 5). The positive relation between P and Zn is supported by other studies (Tryphone and Ncimbi-Msolla, Reference Tryphone and Nchimbi-Msolla2010). It may be noticed that the general positive correlations between the proportions of P and Fe/Zn in the grain (Figure 1) may lead to a reduced bioavailability of Fe and Zn with higher proportions of P. This P will mainly be in the form of phytic acids, which has a chelating capacity to microminerals such as Fe and Zn.
Several of the microelements, including B and Mo, were found in the grain in very small concentrations, just at the detection limits. It is thus likely that these elements could have limited the crop performance as Zn, B and Mo are known to interact on poorer soils. However, their potential effects or interactions were not quantifiable in the current study.
CONCLUSIONS
To meet further demand for food in the future, the current arable land must be utilized in a better way and more efficiently. Until recently, nutrient output of farming systems has not been a goal of either agriculture or of public policy (Khoshgoftarmanesh et al., Reference Khoshgoftarmanesh, Schulin, Chaney, Daneshbakhsh and Afyuni2010) but this must change under future conditions (e.g. Genc et al., Reference Genc, Humphries, Lyons and Graham2005; Welch and Graham, Reference Welch and Graham2002). The current findings underline that some genetic variability exists among the tested 20 genotypes with a potential for being used in plant breeding; the best varieties have a 20% higher concentration of Fe and Zn under favourable conditions. This potential quality improvement was, however, overshadowed by the environmental variability that the crops faced under resource-poor farmers’ conditions in eastern and southern Africa. A sufficient supply of Fe and Zn in the diet may thus best be secured by selecting for high-yielding cultivars as the amounts of P, Fe and Zn in the grains correlated strongly (r 2 > 0.93) to the dry matter grain yield.
Acknowledgements
The research was conducted with support from DANIDA and IFPRI/CIAT via the HarvestPlus Biofortification Challenge Programme. Collaboration with the farmers participating in the trials and the assistance from the contributing field technicians are gratefully acknowledged.


