


INTRODUCTION
There is unequivocal evidence that the world is warming rapidly and very high confidence that the warming is due to human forcing from greenhouse gas (GHG) emissions, land use changes and factors linked to economic development and population growth (Bindoff et al., Reference Bindoff, Willebrand, Artale, Cazenave, Gregory, Gulev, Hanawa, Le Quéré, Levitus, Nojin, Shum, Talley, Unnikrishnan, Solomon, Qin, Manning, Chen, Marquis, Averyt, Tignor and Miller2007; Hansen et al., Reference Hansen, Ruedy and Sato2010). Because water can take up more than 4000 times as much heat as the same volume of air, the oceans covering more than 71% of the surface of the Earth are the major heat reservoir of our planet and play a crucial role in damping down the impact of global warming. Recently the oceans have shown a rapid and accelerating increase in temperature (Belkin, Reference Belkin2009; Levitus et al., Reference Levitus, Antonov, Boyer, Locarnini, Garcia and Mishonov2009a; Sherman et al., Reference Sherman, Belkin, Friedland, O'Reilly and Hyde2009; Purkey & Johnson, Reference Purkey and Johnson2010). Resulting changes in heat structure are profoundly affecting regional climate variability, the cryosphere, sea level and the hydrodynamics, biogeochemistry, ecosystems and living marine resources of the oceans and through feedback mechanisms exacerbate/ameliorate the effects of climate change (Brander, Reference Brander2007; Beaugrand, Reference Beaugrand2009; Reid et al., Reference Reid, Fischer, Lewis-Brown, Meredith, Sparrow, Andersson, Antia, Bathmann, Beaugrand, Brix, Dye, Edwards, Furevik, Gangstø, Hátún, Hopcroft, Kendall, Kasten, Keeling, Le Quéré, Mackenzie, Malin, Mauritzen, Ólafsson, Paull, Rignot, Shimada, Vogt, Wallace, Wang and Washington2009). Biological and biogeochemical processes, including the development, reproduction, occurrence, behaviour and phenology of marine organisms, at cellular to ecosystem scales, are strongly governed by temperature (Beaugrand, Reference Beaugrand2009). Our study was prompted by the observation of a coincidence between the timing of biogeographical/phenological shifts and abrupt changes in plankton, fish and other marine organisms from different regions of the world (Perry et al., Reference Perry, Batchelder, Mackas, Chiba, Durbin, Greve and Verheye2004; Alheit & Bakun, Reference Alheit and Bakun2010) and increasing sea surface temperatures (SST). To investigate this apparent world-wide synchrony we analysed SST variability for January 1960 to December 2008 from the Extended Reconstructed Sea Surface Temperature, version 3 (ERSST_V3) dataset, both globally and for the shelf/slope waters of 10 regions. We selected the shelf/slope for its importance to global fisheries, as the location of many observed changes to date and because it is likely to be strongly impacted in the future.
MATERIALS AND METHODS
Data
Sea surface temperature data were obtained from the Extended Reconstructed Sea Surface Temperature, version 3 (ERSST_V3) dataset. The data were provided by the NOAA/OAR/ESRL PSD, Boulder, Colorado, USA (http://www.esrl.noaa.gov/psd/). The ERSST_V3 dataset is derived from a reanalysis on a 2° × 2° spatial grid that is based on the most recently available International Comprehensive Ocean–Atmosphere Data Set (ICOADS) SST data and has used improved statistical methods to produce a stable monthly reconstruction based on sparse data (Smith et al., Reference Smith, Reynolds, Peterson and Lawrimore2008). Bathymetry data were obtained from the global ocean bathymetry chart (0.1° longitude × 0.1° latitude) (Smith & Sandwell, Reference Smith and Sandwell1997). This dataset is one of the most complete high-resolution compilations of sea floor topography currently available.
Data analyses
First we addressed the spatial and temporal variability of global SST by applying a principal component analysis (PCA) (Beaugrand et al., Reference Beaugrand, Reid, Ibañez, Lindley and Edwards2002) to the ERSST dataset (Analysis 1; Figure 1). Prior to the analysis, data were transformed as monthly anomalies by subtracting the long-term average of the corresponding month for each geographical cell of 2° latitude × 2° longitude. Eigenvectors were normalised so that they represented the spatial correlation with the corresponding principal components.

Fig. 1. Principal component analysis of global sea surface temperature (January 1960–December 2008): (A) first normalised eigenvector (left) and associated principal component (right); (B) second normalised eigenvector (left) and associated principal component (right); (C) third normalised eigenvector (left) and associated principal component (right); (D) fourth normalised eigenvector (left) and associated principal component (right); normalised eigenvectors reveal the correlation of sea surface temperature with the corresponding principal component for each geographical cell.
For ‘Analysis 2’ data from ERSST_V3 SST were interpolated on a spatial grid of 0.1° longitude × 0.1° latitude to correspond to the bathymetric grid. We then divided the marine hydrosphere into 10 regions shallower than 3500 m or 2000 m. The outer depth boundary depended on the topographic features of the areas, with the aim to concentrate mainly on continental shelves and the adjacent shelf-edge (non-oceanic area). Maps of the regions (Figure 2) are contoured to show a division into shelf and deeper slope waters. After this data preparation SST anomalies were calculated for each latitudinal band of 0.1° of latitude. Results are presented as contour diagrams showing the latitudinal changes in SST as a function of year for the period 1960–2008.

Fig. 2. Maps of the 10 geographical areas for which long-term changes in latitudinal sea surface temperature anomalies were calculated, showing the bathymetry of the shelf and slope to ~3000 m.
Third (Analysis 3), to summarise the long-term changes derived from Analysis 2, we latitudinally averaged the data for the 10 shelf/slope regions. We then performed a second PCA to examine the relationships between the components and large-scale hydro-climatological indices (see text below). Probability was corrected to account for temporal autocorrelation.
Hydro-climatological indices
Fourteen large-scale climatological indices, in addition to the 4 PCAs of Analysis 1 (Table 1) were used to examine potential relationships between sea surface temperature changes and climatological processes:
Table 1. Correlations between the first three principal components calculated from a principal component analysis performed on latitudinal sea surface temperature changes over the continental shelf and shelf-edge of 10 geographical regions of the world (Figures 1 & 3) and a selection of large-scale hydro-climatological indices (1960–2008) (see Figure 4). Bold numbers indicate significant correlations at P < 0.10 (*), P < 0.01(**) and P < 0.001(***). Probabilities were corrected for temporal autocorrelation. PC1–PC3, first to third principal components; HadSST2, Hadley sea surface temperature; CRUTEM3, Hadley land surface temperature anomalies; HadCRUT3, Hadley land and sea combined temperature anomalies; PC1 to PC4 SST GLO, first to fourth principal components from an analysis of global sea surface temperature (see Figure 2); SOI Darwin, Southern Oscillation Index based on sea level pressure in Darwin; SOI Tahiti, Southern Oscillation Index based on sea level pressure in Tahiti; MEI, multivariate ENSO Index; PDO, Pacific Decadal Oscillation; NPGO, North Pacific Gyre Oscillation; SASMI, South Asian Summer Monsoon Index; NAO, winter (December to March) North Atlantic Oscillation Index; AO, Arctic Oscillation Index; AGI, Atlantic Gyre Index; AMO, Atlantic Multidecadal Oscillation; AAO, Antarctic Oscillation Index (1979–2008).

1–3. Global sea (HadSST2: Hadley sea surface temperature), land (CRUTEM3: Hadley land surface temperature anomalies), land and sea combined (HadCRUT3: Hadley land and sea combined temperature anomalies) surface temperatures were used. These data were obtained from the Hadley Centre (www.cru.uea.ac.uk).
4–6. Two indices of the Southern Oscillation were used (SOI Darwin and SOI Tahiti) respectively calculated from sea level pressure measured at Darwin and Tahiti. We also utilised the Multivariate ENSO Index (MEI). MEI is calculated from six variables measured by the programme: International Comprehensive Ocean–Atmosphere Data Set (ICOADS). The six variables are sea-level pressure, zonal and meridional components of the surface wind, sea surface temperature, surface air temperature and the total cloudiness fraction of the sky (Wolter & Timlin, Reference Wolter and Timlin1998).
7. The Pacific Decadal Oscillation (PDO) Index is considered to be “a long-lived El Niño-like pattern of Pacific climate variability”. The index is defined as the first principal component of North Pacific monthly SST variability north of 20°N for the period 1900–1993. Abrupt ecosystem shifts in the north-east Pacific have been related to the PDO Index (Hare & Mantua, Reference Hare and Mantua2000).
8. The North Pacific Gyre Oscillation (NPGO) is a climatic pattern represented by the second principal component of a PCA of sea surface height in the north-east Pacific Ocean (Di Lorenzo et al., Reference Di Lorenzo, Schneider, Cobb, Franks, Chhak, Miller, McWilliams, Bograd, Arango, Curchitser, Powell and Rivière2008) and has been correlated with temporal changes in salinity, nutrients and chlorophyll as far apart as the California Current and the Gulf of Alaska.
9. The South Asian Summer Monsoon Index (SASMI) (Li & Zeng, Reference Li and Zeng2005) is defined as the intensity of the normalised seasonality of the wind field (dynamical normalised seasonality (DNS)) at the pressure level 850 hPa averaged seasonally (June to September) in the spatial domain corresponding to South Asia (5°–22.5°N 35°–97.5°E). The index reflects both seasonal and year-to-year variability in monsoon systems for the whole world and is available from: http://www.lasg.ac.cn/staff/ljp/data-monsoon/SASMI.htm.
10. The North Atlantic Oscillation (NAO) is a basin scale alternation of atmospheric mass over the North Atlantic between high pressure centred on the subtropical Atlantic and low pressure around Iceland. This phenomenon, detected in all months of the year, is particularly strong in winter and explains about 37% of the variability in monthly sea level pressure (SLP) from December to February (Marshall et al., Reference Marshall, Kushnir, Battisti, Chang, Czaja, Dickson, Hurrell, McCartney, Saravanan and Visbeck2001). The winter NAO Index used in this study is based on a PCA of SLP over the North Atlantic sector for months from December to March (Hurrell et al., Reference Hurrell, Yochanan and Visbeck2001); http://www.cgd.ucar.edu/cas/jhurrell/.
11–12. Both the Arctic Oscillation (AO) and the Antarctic Oscillation (AAO; 1979–2008) indices were downloaded from the Climate Prediction Center (http://www.cpc.noaa.gov/). These indices are constructed by projecting the daily 1000 mb height anomalies poleward of 20°N (AO) or southward of 20°S (AAO) onto the leading pattern of the AO and AAO.
13. We used the North Atlantic Subarctic Gyre Index to evaluate whether changes in SST are related to the strength of the subarctic gyre circulation. The index is the first principal component of a PCA performed on sea surface height in the North Atlantic Ocean (Häkkinen & Rhines, Reference Häkkinen and Rhines2004; Hátún et al., Reference Hátún, Sandø, Drange, Hansen and Valdimarsson2005).
14. The Atlantic Multidecadal Oscillation (AMO) is an index of long-term (50 to 80 years) ocean/atmosphere variability in the range of 0.4°C in many oceanic regions (Enfield et al., Reference Enfield, Mestas-Nunez and Trimble2001). A simple index can be constructed by calculating a running mean of Atlantic (detrended) sea surface temperature anomalies north of the equator. We used an index constructed from the Extended Reconstruction SST (ERSST) data averaged for the area 25–60°N and 7–75°W, minus a regression of global mean temperature (NCDC). This index was downloaded from the website http://climexp.knmi.nl/. The AMO has a large influence on sea surface temperature changes in the Atlantic as well as globally (Enfield et al., Reference Enfield, Mestas-Nunez and Trimble2001; Keenlyside et al., Reference Keenlyside, Latif, Jungclaus, Kornblueh and Roeckner2008).
RESULTS
Analysis of global and shelf/slope patterns of SST
Mapping of the first normalised eigenvector (EV1) of global SST from the first PCA (Analysis 1) revealed areas where long-term changes were most prominent (Figure 1A). High positive values were concentrated in the tropics and especially the Indian Ocean with extratropical extensions to north and south in all oceans. The main regions with negative EVs are located in the North and South Pacific. Increasing values of the first component reflect rising temperature, that is not continuous, but increases in steps ~1977, 1987 and 1997 with the super El Niño of 1997/1998 standing out, followed by an even stronger peak in 2006/2007 at the time of an El Niño Modoki (Yeh et al., Reference Yeh, Kug, Dewitte, Kwon, Kirtman and Jin2009). The second normalised EV reflected a pattern of SST with positive correlations to the second PC over much of the central equatorial Pacific, in many cases reflecting El Niño years, and a V shaped area of negative correlations in the western Pacific (Figure 1B). The corresponding PC identified three periods: (1) lower positive anomalies in the beginning; (2) an increase that follows an abrupt change in 1976 (Guilderson & Schrag, Reference Guilderson and Schrag1998; Hare & Mantua, Reference Hare and Mantua2000); and (3) another sharp change after the especially strong El Niño in 1997/1998 (Takayabu et al., Reference Takayabu, Iguchi, Kachi, Shibata and Kanzawa1999) to negative anomalies, reflecting a cooler eastern Pacific. El Niño years are evident in this last period, but with a changed sign to weak negative anomalies. For EV3 (Figure 1C) three small positive areas are evident, two in the Atlantic reflecting the pattern of the North Atlantic Oscillation (NAO) tripole (Marshall et al., Reference Marshall, Kushnir, Battisti, Chang, Czaja, Dickson, Hurrell, McCartney, Saravanan and Visbeck2001) and the North Atlantic Gyre Index (Hátún et al., Reference Hátún, Payne, Beaugrand, Reid, Sandø, Drange, Hansen, Jacobsen and Bloch2009) and one in the western tropical Pacific, with an extensive area of negative EVs in the Southern Ocean. The corresponding PC shows a change after the 1970s to negative values with an outlier of positive values throughout 2006. Both EV3 and EV4 reflect polar influences with, in the latter case, positive values in the Arctic (Figure 1D). The changes seen in the corresponding PC4 are dominated by positive anomalies in 2006 that are possibly a precursor to the record reduction of Arctic sea-ice in the following year, 2007. In 2006 an exceptional SST anomaly from the North Atlantic resulted in the warmest year ever recorded in the Barents Sea with a mean SST that was 3.71 standard deviations above the mean in the West Spitzbergen Current and Fram Strait (Hughes et al., Reference Hughes, Holliday and Beszczynska-Möller2010). In terms of seasonal evolution many of the anomalies start to develop in the late summer, increase in intensity from about August into the following year to decline around June.
As the second step in our analysis latitude-by-year anomaly plots of SST were produced for 10 shelf/slope regions (Figure 2). Annual mean SST anomalies were calculated and contoured by time and latitude from the equator (Figure 3). The diagrams show clear alternating periods of warm and cold finger-like anomalies extending from the tropics with for most a remarkably constant timing and persistence until ~30°N and 30°S from where some anomalies show a progressive delay in their poleward extent. In a temporal context the anomalies form and extend over distances of 100s of km relatively rapidly at monthly scales.

Fig. 3. Long-term changes in latitudinal sea surface temperature anomalies for the period 1960–2008 over continental oceanic areas shallower than ~3000 m: (A) north-west Pacific; (B) north-east Pacific; (C) Australia; (D) south-east Pacific; (E) north-west Atlantic; (F) north-east Atlantic; (G) south-west Atlantic; (H) south-east Atlantic; (I) west Indian Ocean; (J) north Indian Ocean.
There is a general global synchrony in the patterns, with a progression from cooler anomalies at the start of the period to strongly positive anomalies over the last decade, except for the eastern Pacific regions. On the eastern margins of oceans the anomalies are semi-continuous all the way from the equator towards the poles, whereas on the other side of ocean basins they are less continuous and show a different timing in the anomaly patterns between the equator and poles that reflects the proximity of adjacent warm and cold western boundary currents.
The influence of El Niño years is evident in Figure 3 and especially in the south-east Pacific, which is used as a reference for other regions. In this region, following a cold period in the early 1970s, fingers of warm anomalies extending from the equator coincide with El Niño years, with an especially pronounced and southerly persistent anomaly in 1997/1998. In the south-east and north-east Pacific and north and west Indian Oceans positive anomalies are ~centred on 1997/1998. In the north-west, south-west and south-east Atlantic and Australia the timing of the late 1990s positive anomaly is later, indicating that there is a lag in the effects of El Niño or a delay in the transport of the heat.
To further investigate mechanisms behind the changes in SST anomalies for shelf/slope seas, we averaged by latitude temporal changes in SST and performed a PCA on a table of 49 years × 10 shelf-slope regions (Analysis 3). The first three components were correlated with a number of large-scale hydro-climatological indices (Table 1; Figure 4). The patterns of change reflected in the first PC are significantly correlated with global measures of sea, air and combined land and SST (Figure 4) showing that the changes in coastal/shelf slope waters are representative of the whole globe and reflect warming from the ocean and the adjacent land. Only the Atlantic Multidecadal Oscillation (AMO) is significantly correlated with the first PC, supporting the proposal that the Atlantic Ocean is an important driver of multidecadal variability on a global scale (Sutton & Hodson, Reference Sutton and Hodson2007). The second PC reflects a Pacific influence acting through El Niño as seen in the significant correlation with the multivariate ENSO Index (Figure 4), reinforced by correlations with the Southern Oscillation Index, the Pacific Decadal Oscillation and the North Pacific Gyre Oscillation (Table 1). The third PC is significantly correlated with the Atlantic Gyre Index (Figure 4) that explains recent ecosystem changes in the North Atlantic due to warming from the subtropics (Hátún et al., Reference Hátún, Payne, Beaugrand, Reid, Sandø, Drange, Hansen, Jacobsen and Bloch2009). Part of the variability is also correlated negatively with the monsoon index and AMO (Table 1), the latter, with respect to sea-ice reduction in the Arctic, reinforced by an observed correlation (Levitus et al., Reference Levitus, Matishov, Seidov and Smolyar2009b) between SST and the AMO in the Barents Sea.
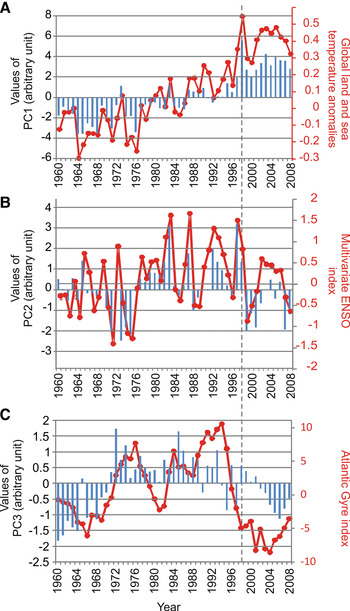
Fig. 4. Principal component analysis of long-term changes in latitudinal sea surface temperature anomalies over continental oceanic areas shallower than ~3000 m (1960–2008): (A) long-term changes in the first principal component (in blue; 57.2% of the total variance) with respect to global land and sea temperature anomalies (in red); (B) long-term changes in the second principal component (in blue; 15.7% of the total variance) against the multivariate ENSO Index (in red); (C) long-term changes in the third principal component (in blue; 7.4% of the total variance) in relation to the Atlantic Gyre Index (in red). The explanatory variables were selected on the basis of the correlation analyses (see Table 1).
Commentary on the latitude by year anomaly plots of SST
The finger shaped anomalies in the regional plots (Figure 3) show evidence at times for discontinuities where the extension of the anomalies becomes blurred and less clear. Differences in the width of the shelf/slope, its orientation, geography or the proportion of slope to shelf within a region contribute. There is also considerable variation in these properties between regions. Averaging by latitude for example may have contributed to some of the variability and contrasts between the results for the north-west Pacific, which is bounded by a chain of islands with two enclosed shelf seas, and the narrow shelf/slope of the north-east Pacific. The wide shelves in the northern north-east Atlantic and to the north of Australia and regions of upwelling explain some discontinuities in the patterns. Adjacent regions to either side of the equator, e.g. the north-east and south-east Pacific (Figure 3B, D) show mirror image patterns of anomalies in the tropics.
In the north-west Pacific (Figure 3A) there is a meridional discontinuity at ~45°N with a different pattern of change below and above; to the south the pattern more closely reflects that for Australia (Figure 3C) while to the north a different pattern likely reflects localised conditions in the Sea of Okhotsk. Meridional discontinuities in the north-east Pacific (Figure 3B) are evident at ~15°–20°N (Gulf of California) and 47°N. The Gulf of California acts as a barrier to the movement of coastally trapped waves that propagate temperature signals (Strub & James, Reference Strub and James2002a). Around Australia (Figure 3C) there is a meridional discontinuity at ~33 to 35°S with different SST anomaly patterns to north and south. To the south the pattern becomes more diffuse with an indication that some of the pulses are delayed towards the pole. The north-west Atlantic (Figure 3E) can be divided into three intervals marked by meridional discontinuities; a tropical region approximately south of Cuba and to the north and south of Cape Hatteras. The pattern of anomalies in the central area to the south of Cape Hatteras appears in general to be out of phase with the areas to north and south. A meridional discontinuity is evident in the north-east Atlantic at ~50°N coinciding with the entrance to the Norwegian Sea (Figure 3F). In the tropics the pattern of anomalies in the south-west Atlantic (Figure 3G) is largely a mirror image of that seen for all the other Atlantic areas; a meridional discontinuity is evident at ~23°S. Until the last decade the finger-like polewards directed SST anomalies are less persistent than for other areas. In the south-east Atlantic (Figure 3H) the southern part closely coincides with the pattern in the west Indian Ocean (Figure 3I) at a similar latitude, while further north, reflecting the pattern seen in other adjacent Atlantic areas. Meridional discontinuities are evident in the plot for the west Indian Ocean at ~18°S and 35°S (Figure 3I) and in the north Indian Ocean at ~25°N (Figure 3J).
DISCUSSION
Global changes in SST
The results of Analysis 1 confirm that warming is propagating in the oceans from the tropics/subtropics and that El Niño is actively implicated, although the extent to which the latter is influenced by global warming is debated at present (Trenberth & Hoar, Reference Trenberth and Hoar1997; Yeh et al., Reference Yeh, Kug, Dewitte, Kwon, Kirtman and Jin2009; Power & Kociuba, Reference Power and Kociuba2011; Wolter & Timlin, Reference Wolter and Timlin2011). One consequence is that the tropics and the subtropical gyres are expanding with important impacts on biology (Polovina et al., Reference Polovina, Howell and Abecassis2008; Seidel et al., Reference Seidel, Qiang, Randel and Reichler2008).
Our findings on global SST changes for the period 1960 to 2008 are consistent with earlier global and ocean scale studies (e.g. Mann et al., Reference Mann, Bradley and Hughes1998; Trenberth et al., Reference Trenberth, Jones, Ambenje, Bojariu, Easterling, Klein Tank, Parker, Rahimzadeh, Renwick, Rusticucci, Soden, Zhai, Solomon, Qin, Manning, Chen, Marquis, Averyt, Tignor and Miller2007), although the patterns we have discovered are clearer because of access to a larger and much improved global dataset. The first eigenvector of our study closely corresponds with the pattern of the first empirical orthogonal function (EOF) seen in an earlier 1998 analysis (Mann et al., Reference Mann, Bradley and Hughes1998). This latter study however, used a much more limited SST dataset with large sampling gaps in many ocean areas. There is some similarity also in the pattern of their EOF2, but little for subsequent EOFs, which is likely because of the limited data coverage. The V shaped pattern of Eigenvector 2 (EV2) for the Pacific in our study (Figure 1) was shown for a shorter period in a comparative chlorophyll to temperature study, which was also correlated with the PDO (Martinez et al., Reference Martinez, Antoine, D'Ortenzio and Gentili2009), and is most similar to the SST anomaly pattern for the central Pacific (Modoki) El Niño (Yeh et al., Reference Yeh, Kug, Dewitte, Kwon, Kirtman and Jin2009) that is also reflected in patterns of sea level change (Behera & Yamagata, Reference Behera and Yamagata2010). This pattern (EV2) is also similar to the first EOF of Deser et al. (Reference Deser, Alexander, Xie and Phillips2010), a study that is based on SST changes from 1900 To 2008. It is possible that their EOF1 evolved as the main EOF pattern over this long period as it was not dominated by the rapid global warming of the last few decades.
Changes in SST along continental margins
The processes behind the SST anomaly patterns shown by Analysis 2 and the extent to which they are caused by oceanic advection, changes in the circulation of ocean gyres, atmospheric forcing or different combinations of these factors is still unclear. The boundary flows of the oceans have different characteristics on the eastern (poleward slope currents, boundary waves and upwelling) and western (major ocean currents) margins of ocean basins.
On the eastern margins of oceans strong candidates for the production of the anomalies in Figure 3 are poleward flowing eastern boundary shelf/slope currents (Neshyba et al., Reference Neshyba, Mooers, Smith and Barber1989). Strong advective pulses of warm sea water along the shelf/slope at intraseasonal to interannual intervals are well documented from all the oceans. These largely baroclinic density driven currents follow the topography of the shelf edge and are typically ~50 to 100 km wide with a subsurface maximal flow at 50 to 400 m depth. Substantial volumes of water may be carried by these currents with for example poleward transport as high as 5.3 Sv in a section off Oregon with average current speeds of 23 cm s−1 and northerly movement of sea level height anomalies of 300 miles in 1 month (Kosro, Reference Kosro2002). Over large sections of coast the currents flow counter to equatorwards directed winds. It is clear however, that in some cases oceanic advection of pulsed warm anomalies are the product of distant atmospheric wind forcing, especially in equatorial regions with propagation by Kelvin waves that move poleward as coastally trapped waves after reaching the shelf edge. Local atmospheric and topographic factors may reinforce or block/delay propagation of warm pulses and the pulses may acquire additional heat from adjacent ocean gyres and the atmosphere as they progress poleward (Pingree & Le Cann, Reference Pingree and Le Cann1989; Kessler, Reference Kessler2006). It is assumed that negative anomalies reflect cooler conditions in the tropics, but this is not clear. In the north-east Pacific there is some evidence that negative anomalies may be associated with a reversal of the normal pattern with the propagation of cold subarctic water to the south (Kosro, Reference Kosro2003) and the current may also reverse off north-west Europe (Pingree, Reference Pingree2002).
The main distribution of heat around the world by the oceans takes place in the wind driven gyre circulations with the subtropical gyres playing a key role. The western boundary currents of these gyres are warm, deep and fast flowing, in part along the shelf slope. While the circulation of the adjacent shelves is primarily driven by regional winds, tides and thermohaline forcing these boundary currents have a strong influence on their hydrography and thus SST through a wide variety of processes (Brink, Reference Brink, Brink and Robinson1998). Transport of heat by the wind driven western boundary currents contributes to the production of warm/cold anomalies on the shelf/slopes of adjacent continents as is confirmed by the close approximation between the SST patterns of offshore warm and cold gyre currents and that of adjacent shelves in satellite imagery. There is a considerable between ocean, and along shore variability in deep-sea forcing of western boundary shelves depending on topography, shelf width, obstructions, variable meandering etc, with strong advection onto the narrow shelves of the tropics by the zonal equatorial currents that feed the western boundary currents (Loder et al., Reference Loder, Boicourt, Simpson, Robinson and Brink1998; Lohrenz & Castro, Reference Lohrenz, Castro, Robinson and Brink2004). Some regional examples of poleward flowing currents at the eastern and western margins of oceans basins that may have contributed to the SST anomalies in Figure 3 are summarised in the next section.
Reorganisation of basin-wide SST patterns due to the expansion or contraction of gyre circulations are a further contributory factor to the anomaly patterns. In the North Atlantic, for example, these alternating modes have been related to the changing states of the NAO (Pingree, Reference Pingree2002). When the NAO is in a high positive state, westerly winds, ocean scale wind stress curl and the Atlantic circulation are stronger and in the subtropical gyre warmer water is pulled into the centre of the gyre from the sides at the surface so that the waters closer to the continental shelves at both sides of the Atlantic become colder and the altimetry of both the shelf and the adjacent ocean are depressed. In the reverse situation of a low negative NAO, the centre of the gyre becomes shallower and colder as the wind curl reduces, surface waters flow from the centre outwards and contribute to a warming of the western and eastern edges of the basin with a noticeable rise in altimetry (Leterme & Pingree, Reference Leterme and Pingree2007). In the eastern North Atlantic this water presses against the slope and leads in NAO negative years to an enhanced flow in the shelf/slope current (Pingree, Reference Pingree2002), with on the other side of the basin a more southerly penetration of Labrador Subarctic Slope Water (Greene & Pershing, Reference Greene and Pershing2003). Subsequent to the extremely low winter NAO of 1995/1996 the subpolar gyre in the North Atlantic contracted and allowed a northerly penetration of subtropical water and species that has further reinforced the signal propagated by the shelf/slope current in the north-east Atlantic (Figure 3F) (Hátún et al., Reference Hátún, Sandø, Drange, Hansen and Valdimarsson2005, Reference Hátún, Payne, Beaugrand, Reid, Sandø, Drange, Hansen, Jacobsen and Bloch2009).
Changes in the heat transfer between oceans, e.g. between the Pacific and Indian Oceans via the Indonesian Throughflow and between the Indian and Atlantic Oceans may also have contributed to the anomaly patterns. For example, the presence of a lag in the timing of SST anomalies between the Indian and south-east Atlantic Oceans supports an enhanced transport of warm water around the Cape of Good Hope in positive anomaly years and is reinforced by observations of a substantial increase in the leakage of warm water from the Indian to the Atlantic Oceans via the Agulhas Current (Rouault et al., Reference Rouault, Penven and Pohl2009; Beal et al., Reference Beal, De Ruijter, Biastoch and Zahn2011).
Poleward flowing boundary currents
In the north-east Atlantic there have been a number of descriptions of pulsed northerly movement in the largely barotropic shelf/slope current, ranging from off Iberia (Garcia-Soto et al., Reference Garcia-Soto, Pingree and Valdés2002; Peliz et al., Reference Peliz, Dubert, Santos, Oliveira and Le Cann2005), to the edge of the Celtic Sea (Pingree et al., Reference Pingree, Sinha and Griffiths1999), to the Rockall Trough (Reid et al., Reference Reid, Holliday and Smyth2001b; Holliday, Reference Holliday2003; Holliday et al., Reference Holliday, Hughes, Bacon, Beszczynska-Möller, Hansen, Lavin, Loeng, Mork, Østerhus, Sherwin and Walczowski2008) and the Norwegian Sea (Holliday et al., Reference Holliday, Hughes, Bacon, Beszczynska-Möller, Hansen, Lavin, Loeng, Mork, Østerhus, Sherwin and Walczowski2008). Eddy formation, especially ‘slope water oceanic eddies’ (swoddies) at abrupt changes in topography, are associated with the currents (Garcia-Soto et al., Reference Garcia-Soto, Pingree and Valdés2002). Pulses of warm water off Iberia were associated with intense poleward flows in 1996 to 1998 and 2001 to 2002 (Peliz et al., Reference Peliz, Dubert, Santos, Oliveira and Le Cann2005) and the same was the case in the Rockall Trough in 1998 (Holliday, Reference Holliday2003). The warm currents may be seasonally reinforced. Off Iberia for example, where the current is strongest near Christmas and New Year and termed ‘Navidad’, it may contribute the equivalent of an extra month of summer heating to the slope region to the north (Garcia-Soto et al., Reference Garcia-Soto, Pingree and Valdés2002).
El Niño events start in the western Pacific with westerly wind anomalies generating downwelling Kelvin waves that deepen the eastern thermocline and pump warm equatorial water to the east by zonal advection, which then spreads polewards to north and south when reaching the shelf in a narrow band along the coast of the Americas (Kessler, 2006). The warming is independent of local winds off the coast and is an example of remote forcing of warming by distant winds. The eastward advection spans the equator with a strengthening of the North Equatorial Counter Current as the upward bulge of the westward flowing South Equatorial Current is depressed by a flattened and deepening thermocline. In the east cool upwelling is cut off and local surface heat fluxes reinforce the warming. The poleward flows have been observed as pulses at seasonal to annual scales that can extend all the way to Oregon (Kosro, Reference Kosro2002), Alaska (Strub & James, Reference Strub and James2002b; Stabeno et al., Reference Stabeno, Ladd and Reed2009) and Chile (Hormazabal et al., Reference Hormazabal, Shaffer and Pizarro2002) and can carry tropical water as far as the Gulf of California (Kessler, Reference Kessler2006). Opposing regional winds may reverse or delay the propagations and coastal topography influences the relative speed of transport of the propagating signal to north and south of the equator (Strub & James, Reference Strub and James2002a). Off Vancouver Island, boreal and southerly plankton have been shown to alternate between warm temperature conditions and poleward transport anomalies and the reverse conditions (Mackas et al., Reference Mackas, Thomson and Galbraith2001) that are associated with the shelf slope (Mackas et al., Reference Mackas, Batten and Trudel2007). Further south off Oregon, enhanced northward advection, an associated depressed pycnocline and higher than normal steric height, and subsurface temperatures at ~100 m are more pronounced in El Nino years than the effects associated with the opposite southerly transport in La Niña years (Smith et al., Reference Smith, Huyer and Fleischbein2001). The contrast between the stronger El Niño and weaker La Niña impacts off Oregon in the 1980/1990s compared to the 1960/1970s was attributed to modulation by large scale interdecadal variability in the North Pacific.
In the equatorial Atlantic a similar sequence of events to the Pacific is believed to contribute to the formation of Benguela El Niños, which have a different timing to their Pacific counterparts (Gammelsrød et al., Reference Gammelsrød, Bartholomae, Boyer, Filipe and O'Toole1998; Florenchie et al., Reference Florenchie, Lutjeharms, Reason, Masson and Rouault2003). When trade winds that have piled up water at the western side of the basin relax a Kelvin wave is thought to be generated and propagates eastwards advecting warm water towards Africa, which splits at the shelf and moves poleward as coastally trapped waves towards the poles. In the northern hemisphere this current only penetrates to ~5°N where it is deflected offshore back toward South America because of the sharp change in direction of the African coastline. Other processes involved with the subtropical gyre and atmospheric forcing maintain northerly flow of warm anomalies at the eastern margin to the north of this latitude.
Both observations and modelling demonstrate that the western boundary Agulhas Current has shown a substantial increase in transport south of Madagascar and in the leakage of warm and salty water from the Indian Ocean to the Atlantic Ocean since the 1980s (Rouault et al., Reference Rouault, Penven and Pohl2009). The change is a response to enhanced warming in the Indian Ocean that is likely linked to a reduction in the shallow overturning circulation (Lee, Reference Lee2004) and especially an increase in the wind stress curl in the east associated with a poleward shift in the westerly winds of the southern hemisphere (Rouault et al., Reference Rouault, Penven and Pohl2009).
In the Indian Ocean eastern boundary currents have been described from the Bay of Bengal (Suryanarayana et al., Reference Suryanarayana, Murty and Rao1993) and as the Leeuwin Current on the western margin of Australia (see below).
Uniquely for a continent, warm boundary currents flow polewards on either side of Australia as the Leeuwin and East Australian Currents. Changes in the strength of the Leeuwin Current are linked to El Niño with evidence from seabirds for a southward penetration of warmer water (Poloczanska et al., Reference Poloczanska, Babcock, Butler, Hobday, Hoegh-Guldberg, Kunz, Matear, Milton, Okey and Richardson2007). In contrast the East Australian Current has shown a marked southerly extension of ~350 km since 1944 and warming over the past few decades with an augmented pulse of warm subtropical waters in the summer (Ridgway, Reference Ridgway2007).
A recent study of the western boundary Brazil Current (Matano et al., Reference Matano, Palma and Piola2010) has shown that the offshore characteristics of this current dominate the also southward flowing circulation of the shelf via bottom boundary layer interaction between the two systems, reinforced by intermittent cross shelf transport of eddies and meanders. The same applies to the cold Malvinas Current to the south and may explain the out-of-phase relationship of the SST anomalies for the south-west Atlantic at ~40°S (Figure 3G). Reflecting adjacent subtropical and subpolar gyres, all eastern compared to western continental shelves, other than for the tropical/subtropical west Indian Ocean region (Figure 3I), show a reduced extension of positive SST anomalies from the tropics towards the poles.
Ecosystem synchrony
Synchronous decadal changes in marine populations and ecosystems, within and between regions, and at an ocean basin scale are well documented (Perry et al., Reference Perry, Batchelder, Mackas, Chiba, Durbin, Greve and Verheye2004; Alheit & Bakun, Reference Alheit and Bakun2010). There is a growing literature on such events, including step changes (called regime shifts or abrupt ecosystem shifts) that are a response to hydroclimatic events that simultaneously affect many biological, physical and chemical processes (deYoung et al., Reference deYoung, Barange, Beaugrand, Harris, Perry, Scheffer and Werner2008). A wide range of other responses to hydroclimatic variability over the past few decades have also been described including, biogeographical range shifts (Beaugrand et al., Reference Beaugrand, Reid, Ibañez, Lindley and Edwards2002), changes in timing (phenology) (Edwards & Richardson, Reference Edwards and Richardson2004), harmful algal blooms (Hallegraeff, Reference Hallegraeff2010), ciguatera fish poisoning (Tester et al., Reference Tester, Feldman, Nau, Kibler and Litaker2010), disease (Vezzulli et al., Reference Vezzulli, Brettar, Pezzati, Reid, Colwell, Höfle and Pruzzo2011), species invasions (Occhipinti-Ambrogi, Reference Occhipinti-Ambrogi2007) and changing spatial distributions observed by satellite remote sensing in, e.g. coccolithophores (Smyth et al., Reference Smyth, Tyrrell and Tarrant2004). The underlying mechanisms behind the increasing evidence for temporal and geographical synchrony and teleconnections in biological populations and ecosystems are, however, still poorly understood. These patterns are considered to represent strong forcing by regional and global atmospheric climate variability (Alheit & Bakun, Reference Alheit and Bakun2010), with evidence for ocean atmosphere feedbacks from SST as well as remote forcing from the SST of the tropical oceans (Overland et al., Reference Overland, Alheit, Bakun, Hurrell, Mackas and Miller2010). Widespread changes (regime shifts/step changes/tipping points) occurred in ~1976/1977, ~1988/1989, ~1997/1998 and in the 2000s and coincide well with the progressive steps and marked changes in SST seen in the components of Figure 1 and annual regional changes in Figure 3.
Step changes in ecosystems (regime shifts) (deYoung et al., Reference deYoung, Harris, Alheit, Beaugrand, Mantua and Shannon2004; Alheit, Reference Alheit2009) that in many cases coincide with the major temporal changes seen in the temperature anomalies of Figures 1 and 3, have been described from the North Pacific (1976/1977 and 1989) (Hare & Mantua, Reference Hare and Mantua2000; Polovina, Reference Polovina2005; Field et al., Reference Field, Baumgartner, Charles, Ferreira-Bartrina and Ohman2006), north-east Pacific (1976/1977) (McGowan et al., Reference McGowan, Bograd, Lynn and Miller2003; Miller et al., Reference Miller, Chai, Chiba, Moisan and Neilson2004) (1998/1999) (Peterson & Schwing, Reference Peterson and Schwing2003; Lavaniegos & Ohman, Reference Lavaniegos and Ohman2007), north-west Pacific (1976/1977, 1988/1989 and 1998) (Kasai & Ono, Reference Kasai and Ono2007; Sakurai, Reference Sakurai2007; Chiba et al., Reference Chiba, Sugisaki, Nonaka and Saino2009) the Humboldt Current (1968/1970 and 1984/1986) (Alheit & Niquen, Reference Alheit and Niquen2004; Alheit, Reference Alheit2009), possibly the Benguela Current (between 1967 and 1987) (Verheye et al., Reference Verheye, Richardson, Hutchings, Marska and Gianakouras1989) and the north-west Atlantic (1989/1990) (Frank et al., Reference Frank, Petrie, Choi and Leggett2005; Pershing et al., Reference Pershing, Greene, Jossi, O'Brien, Brodziak and Bailey2005; Greene & Pershing, Reference Greene and Pershing2007) (SST 1987) (Friedland & Hare, Reference Friedland and Hare2007). In San Francisco Bay (Cloern et al., Reference Cloern, Hieb, Jacobsen, Sansó, Di Lorenzo, Stacey, Largier, Meiring, Peterson, Powell and Winder2010), clear concomitant changes have been observed after 1999 in phytoplankton, crabs, shrimps and demersal fish related to several hydro-climatological indices (e.g. North Pacific Gyre Index, Pacific Decadal Oscillation and Multivariate ENSO Index). Similar shifts were observed in the North Sea (Reid et al., Reference Reid, Borges and Svendsen2001a; Weijerman et al., Reference Weijerman, Lindeboom and Zuur2005), Baltic (Alheit et al., Reference Alheit, Möllman, Dutz, Kornilovs, Loewe, Mohrholz and Wasmund2005) and north-west European shelf seas (~1987/1990) (Beaugrand, Reference Beaugrand2004; Heath & Beare, Reference Heath and Beare2008) and as synchronous changes in the Mediterranean, Adriatic and Black Sea (~1987) (Conversi et al., Reference Conversi, Fonda Umani, Peluso, Molinero, Santojanni and Edwards2010). Recent evidence indicates that an abrupt ecosystem shift might have happened in the mid- to late-1990s in the Celtic Sea and the North Sea (Beaugrand & Edwards, unpublished material) that coincides approximately with ecosystem changes in the eastern North Atlantic that have been linked to changes in the subpolar gyre (Hátún et al., Reference Hátún, Payne, Beaugrand, Reid, Sandø, Drange, Hansen, Jacobsen and Bloch2009).
Range shifts in the marine environment averaging 19.0 km year−1 were found to be an order of magnitude faster than equivalent terrestrial examples and even faster for introduced species in a recent review (Sorte et al., Reference Sorte, Williams and Carlton2010). In the north-east Atlantic range expansions by zooplankton from the mid-1980s were of the order of 1000 km in only 40 years (Beaugrand et al., Reference Beaugrand, Reid, Ibañez, Lindley and Edwards2002, Reference Beaugrand, Luczak and Edwards2009). Fish have also shown a northerly range expansion and changes in depth distribution in the same region (Brander et al., Reference Brander, Blom, Borges, Erzini, Henderson, MacKenzie, Mendes, Ribeiro, Santos and Toresen2003; Perry et al., Reference Perry, Low, Ellis and Reynolds2005), with in 1988 the appearance and from then an increase in records of warm water cetaceans (MacLeod et al., Reference MacLeod, Bannon, Pierce, Schweder, Learmonth, Herman and Reid2005) and plankton. Subtropical species have also been recorded off the coast of Portugal, but retreated south again in colder years (Henriques et al., Reference Henriques, Gonçalves and Almada2007). Some species of the rocky shore benthos have expanded northwards (Hawkins et al., Reference Hawkins, Moore, Burrows, Poloczanska, Mieszkowska, Herbert, Jenkins, Thompson, Genner and Southward2008) and in 2004 mussels were found growing in Svalbard for the first time in over 1000 years (Berge et al., Reference Berge, Johnsen, Nilsen, Gulliksen and Slagstad2005). Northward range expansion of fish from 1968 to 2007 (Nye et al., Reference Nye, Link, Hare and Overholtz2009) and reef corals (Precht & Aronson, Reference Precht and Aronson2004) have been described from the north-west Atlantic. Benguela El Niños have been associated with mortality of fish and with a southward displacement of sardine stocks (Gammelsrød et al., Reference Gammelsrød, Bartholomae, Boyer, Filipe and O'Toole1998). In eastern Australian/Tasmanian waters similar pronounced shifts in distribution have been described (Poloczanska et al., Reference Poloczanska, Babcock, Butler, Hobday, Hoegh-Guldberg, Kunz, Matear, Milton, Okey and Richardson2007; Figueira & Booth, Reference Figueira and Booth2010; Last et al., Reference Last, White, Gledhill, Hobday, Brown, Edgar and Pecl2011), including a >1000 km range expansion of a tropical reef fish (Hobbs, Reference Hobbs2010) all associated with a poleward advance of the East Australian Current. And a northerly movement of warmer water species has been noted in the transition zone of the Kuroshio-Oyashio Currents (Chiba et al., Reference Chiba, Sugisaki, Nonaka and Saino2009). In the Gulf of California a long (1400 years) and well dated record of foraminifera in a sediment core closely reflects global patterns of warming sea temperature, especially after the mid-1970s regime shift in the North Pacific and also shows evidence for a northerly penetration of tropical and sub-tropical species (Field et al., Reference Field, Baumgartner, Charles, Ferreira-Bartrina and Ohman2006). It is clear that in the late 20th Century this region experienced unusual tropical forcing from the ocean complemented by an increase in the atmosphere-driven heat flux to the ocean. In the Bering Sea coccolithophores were recorded for the first time in 1998 (Napp & Hunt, Reference Napp and Hunt2001) and in the Barents Sea from 1989 (Smyth et al., Reference Smyth, Tyrrell and Tarrant2004). Tropical coccolithophores were recorded along the coast of southern Australia following an intrusion of offshore water in the summer of 1992/1993 (Blackburn & Cresswell, Reference Blackburn and Cresswell1993) and a similar event was observed in Japan in 1996 (Kai et al., Reference Kai, Hara, Aoyama and Kuroda1999). A southerly range expansion of the coccolithophore Emiliania huxleyi was observed in the Southern Ocean in the early 2000s (Cubillos et al., Reference Cubillos, Wright, Nash, de Solas, Griffiths, Tillbrook, Poisson and Hallegraeff2007). Of especial note is the trans-Arctic migration of a Pacific diatom (Neodenticula seminae) to the north-west Atlantic in 1998/1999 for the first time in 800,000 years (Reid et al., Reference Reid, Johns, Edwards, Starr, Poulin and Snoeijs2007). Since 1980, on the western shelf of the Antarctic Peninsula levels of chlorophyll-a have declined to the north of 63°S and increased to the south of that latitude; these changes coincide with changes in krill and penguins and have been linked to reducing sea-ice (Montes-Hugo et al., Reference Montes-Hugo, Doney, Ducklow, Fraser, Martinson, Stammerjohn and Schofield2009).
Extensive coral bleaching events have been widely documented in almost all regions of the world where coral reefs form since the 1970s (Wilkinson, Reference Wilkinson2008; WMO, 2010). Most evidence indicates that the bleaching is caused by high sea temperatures that exceed the thermal limits of the corals and their endosymbiont dinoflagellates (Hoegh-Guldberg et al., Reference Hoegh-Guldberg, Mumby, Hooen, Steneck, Greenfield, Gomez, Harvell, Sale, Edwards, Caldeira, Knowlton, Eakin, Iglesias-Prieto, Muthiga, Bradbury, Dubi and Hatziolos2007). Mass bleaching events have extended over many 1000 to 100,000 km2 areas and have been responsible for a large loss of live coral throughout the tropical oceans, with at times a slow and poor prognosis for recovery. Coral bleaching episodes occurred in 1982/1983 (Glynn, Reference Glynn1984), 1987/1988, 1994/1995, 2000/2004, 2010 and were especially pronounced globally in 1997/1998 (Hoegh-Guldberg, Reference Hoegh-Guldberg1999) and in 2005/2006 (Wilkinson & Souter, Reference Wilkinson and Souter2008) in the Caribbean. In some regions these phenomena are known to be associated with El Niño/La Niña events and in many cases coincide with the temperature anomalies shown in Figure 3. The differences in the timing of the SST anomalies in different ocean regions helps explain to some extent the geographical variability in the occurrence and intensity of bleaching events. For example the timing of the exceptional bleaching events of 1997/1998 started in the Caribbean and Galapagos and moved progressively around the world and back to the Caribbean and were especially pronounced in the Indian Ocean in March/April 1998 with a relatively minor impact on the Great Barrier Reef (Hoegh-Guldberg, Reference Hoegh-Guldberg1999) (see Figure 3C).
Impacts of warm SST anomalies on the Arctic/Antarctic
The timing of reductions of sea-ice in polar seas coincides with the changing patterns of the propagating warm SST anomalies. There is however, a difference between the patterns of melting sea-ice at the two poles with widespread melting in the Arctic contrasting with a general increase in the extent of sea-ice around Antarctica other than to the west of the western Antarctic Peninsula.
In the Arctic an increased inflow of warm Atlantic water (Spielhagen et al., Reference Spielhagen, Werner, Sørensen, Zamelczyk, Kandiano, Budeus, Husum, Marchitto and Hald2011), in large part from an extension of the Slope Current, as pulses centred on 1990 and ~2004 has led to exceptional warming of the Barents Sea (Zhang et al., Reference Zhang, Rothrock and Steele1998). Arctic Intermediate Water, beneath the halocline (Polyakov et al., Reference Polyakov, Timokhov, Dmitrenko, Ivanov, Simmons, Beszcynska-Moeller, Dickson, Fahrbach, Fortier, Gascard, Hoeleman, Holliday, Hansen, Mauritzen, Piechura, Pickart, Schauer, Steele and Walczowski2007, Reference Polyakov, Timokhov, Alexeev, Bacon, Dmitrenko, Fortier, Frolov, Gascard, Hansen, Ivanov, Laxon, Mauritesen, Perovich, Shimada, Simmons, Sokolov, Steele and Toolen2010), has extended along the shelf slope to the Laptev Sea (Dmitrenko et al., Reference Dmitrenko, Polyakov, Kirrilov, Timokhov, Frolov, Solokov, Simmons, Ivanov and Walsh2008). The anomalous intrusions are seen as lagged extensions of warm temperature anomalies along the shelf slope from the Bay of Biscay to Spitzbergen (Polyakov et al., Reference Polyakov, Timokhov, Dmitrenko, Ivanov, Simmons, Beszcynska-Moeller, Dickson, Fahrbach, Fortier, Gascard, Hoeleman, Holliday, Hansen, Mauritzen, Piechura, Pickart, Schauer, Steele and Walczowski2007). There has been a marked shallowing (shoaling) of the upper surface of the inflowing Atlantic water and it is concluded that the warming has contributed through preconditioning to the large reduction of sea-ice seen in recent years (Polyakov et al., Reference Polyakov, Timokhov, Alexeev, Bacon, Dmitrenko, Fortier, Frolov, Gascard, Hansen, Ivanov, Laxon, Mauritesen, Perovich, Shimada, Simmons, Sokolov, Steele and Toolen2010). Intrusion of the warm Atlantic water from a boundary current at the shelf edge onto the bottom of the Laptev Sea shelf has implications for the future stability of offshore submarine permafrost (Dmitrenko et al., Reference Dmitrenko, Kirrilov, Tremblay, Bauch, Hölemann, Krumpen, Kassens, Wegner, Heinemann and Schröder2010). From the Pacific, a similar intrusion of warm Pacific Summer Water into the Bering Sea is correlated with the reduction of sea-ice that began in 1997/1998 (Shimada et al., Reference Shimada, Kamoshida, Itoh, Nishino, Carmack, McLaughlin, Zimmerman and Proshutinsky2006).
Ocean warming to the west of Greenland since the late 1990s, due to a northward penetration of warm water in the subpolar gyre (Hughes et al., Reference Hughes, Holliday and Beszczynska-Möller2010), may be behind the recent rapid and accelerating melting (Rignot et al., Reference Rignot, Velicogna, van den Broeke, Monaghan and Lenaerts2011) of the Greenland ice sheet. The warming is strongly correlated with the acceleration and retreat of outlet glaciers in southern Greenland, although a statistical analysis of temperature changes does not support an important role for warming SST (Hanna et al., Reference Hanna, Cappelen, Fettweis, Huybrechts, Luckman and Ribergaard2009).
The Southern Ocean has shown one of the most rapid increases in SST in the world and has been largely linked to an intensification and southerly shift in the overlying westerly winds and a latitudinal shift in the Antarctic Circumpolar Current (ACC) although the processes behind the increase remain poorly understood (Reid et al., Reference Reid, Fischer, Lewis-Brown, Meredith, Sparrow, Andersson, Antia, Bathmann, Beaugrand, Brix, Dye, Edwards, Furevik, Gangstø, Hátún, Hopcroft, Kendall, Kasten, Keeling, Le Quéré, Mackenzie, Malin, Mauritzen, Ólafsson, Paull, Rignot, Shimada, Vogt, Wallace, Wang and Washington2009, Schofield et al., Reference Schofield, Ducklow, Martinson, Meredith, Moline and Fraser2010). A rapid increase in austral summer SST to the west of the Western Antarctic Peninsula (WAP) in the south-east Pacific (Meredith & King, Reference Meredith and King2005) and an increased delivery and southerly penetration of heat to this region has had a pronounced impact on adjacent ecosystems (Ducklow et al., Reference Ducklow, Baker, Martinson, Quetin, Ross, Smith, Stammerjohn, Vernet and Fraser2007). Heat fluxes to the peninsula, especially in winter, derive from Upper Circumpolar Deep Water (UCDW) that penetrates onto the WAP shelf from beneath the ACC due to a north to south upward tilt of the isopycnals (Martinson, Reference Martinson2012) and are reinforced by higher summer temperature at the surface. Work by Meredith et al. (Reference Meredith, Murphy, Hawker, King and Wallace2008) shows that the region close to the Antarctic Peninsula is especially susceptible to ENSO forcing via anomalous meridional winds and that warming further east in the South Atlantic off South Georgia is associated with El Niño and the Southern Annular Mode (SAM).
Over most of the Southern Ocean sea-ice extent has shown an upward trend despite rising ocean and atmospheric temperature (Liu & Curry, Reference Liu and Curry2010; Oza, et al., Reference Oza, Singh, Srivastava, Dash, Das and Vyas2011) that is still not well understood, but has markedly reduced in the Bellinghausen/Amundsen Seas to the west of the WAP (Cavalieri & Parkinson, Reference Cavalieri and Parkinson2008). The reduction occurred in steps with an increasing heat flux since the 1990s and a step change “regime shift” circa 1998 that was linked to El Niño by Martinson et al. (Reference Martinson, Stammerjohn, Iannuzzi, Smith and Vernet2008). The pattern of sea-ice reduction is closely correlated with regional SST (Schneider et al., Reference Schneider, Deser and Okumura2012) and it has been suggested coincides with a greater penetration at depth (~300m) of UCDW and upwelling of warmer water onto the shelf from the ACC (Martinson et al., Reference Martinson, Stammerjohn, Iannuzzi, Smith and Vernet2008). An alternative explanation is that a westward counterflowing shelf slope undercurrent beneath the ACC, causing uplift of the pycnocline as described for the Weddell Sea by Chavanne et al. (Reference Chavanne, Heywood, Nicholls and Fer2010), is allowing warmer water with UCDW characteristics to penetrate as intrusions onto the shelf in a similar way to other shelf slope currents. Intrusion of UCDW onto the shelf may also be driven by the presence of ice shelves and overturning eddy circulation at the Antarctic Shelf Front (Nøst et al., Reference Nøst, Biuw, Tverberg, Lydersen, Hattermann, Zhou, Smedsrud and Kovacs2011) and/or by local wind forcing at the shelf edge modulated by larger scale atmospheric forcing (Steig et al., Reference Steig, Ding, Battisti and Jenkins2012; Thoma et al., Reference Thoma, Jenkins, Holland and Jacobs2008). Observations by Moffat et al. (Reference Moffat, Owens and Beardsley2009) indicate that the warm intrusions are frequent events and may be in the form of eddies shed off the shelf edge. There are few observations of shelf slope currents around Antarctica, but modelling studies e.g. Smedsrud et al. (Reference Smedsrud, Jenkins, Holland and Nøst2006) have implicated them as an important contributor to rapid melting of basal ice shelves with the warmer water pulled in under the ice by an estuarine type of circulation caused by the outflowing meltwater near the surface. Warmer UCDW flows along deep bathymetric troughs to access the sub-ice shelf cavity. Pritchard et al. (Reference Pritchard, Ligtenberg, Fricker, Vaughan, van den Broeke and Padman2012) show from ICESat altimetry measurements that basal melting of ice shelves from oceanic warming is occurring in ~ 40% of the ice sheets of Antarctica with the most rapid changes in Western Antarctica. Modelling also suggests that the Antarctic shelf slope current is a regular feature around the whole of Antarctica (Mathiot et al., Reference Mathiot, Goosse, Fichefet, Barnier and Gallée2011). The ‘Southern Boundary’ of the ACC, is a region of considerable ecological importance that supports highly productive marine ecosystems (Tynan, Reference Tynan1998), and coincides with the location of the shelf slope current.
Warming sea temperature, earthquakes and other geological hazards
An enhanced sea level height above strong shelf/slope currents during warm anomalies with an increased contrast between shelf and deep offshore oceanic water and their effects on bottom pressure on the sea floor (Landerer et al., Reference Landerer, Jungclaus and Marotzke2007) might contribute to subsea earthquake and tsunami activity. The Boxing Day earthquake off Sumatra coincided with high SST anomalies at this time (Chakravarty, Reference Chakravarty2009) (see also Figure 3J). An accelerating contribution of land ice to sea level rise and regional variability in distribution patterns (Cazenave & Llovel, Reference Cazenave and Llovel2010) may also contribute to changes in bottom pressure. A wide range of geological hazards (e.g. enhanced volcanism and generation of tsunamis by submarine mass failures) that may increase with warming sea temperatures and associated melting of glaciers and ice sheets have recently been reviewed in the Philosophical Transactions of the Royal Society (see McGuire, Reference McGuire2010; Tappin, Reference Tappin2010; Tuffen, Reference Tuffen2010).
Concluding remarks
In a longer-term context global mean sea and land surface temperatures have risen substantially since 1850 (Trenberth et al., Reference Trenberth, Jones, Ambenje, Bojariu, Easterling, Klein Tank, Parker, Rahimzadeh, Renwick, Rusticucci, Soden, Zhai, Solomon, Qin, Manning, Chen, Marquis, Averyt, Tignor and Miller2007). In the past 50 years the rate of temperature increase has accelerated and especially so after the late 1970s with 9 of the warmest years on record in the HadCRUT3 dataset (UK Met Office) occurring post-2000; a pattern that compares well with our results. On a regional ocean scale over the past century there was considerable variability in SST with all basins clearly showing a long-term warming trend (Trenberth et al., Reference Trenberth, Jones, Ambenje, Bojariu, Easterling, Klein Tank, Parker, Rahimzadeh, Renwick, Rusticucci, Soden, Zhai, Solomon, Qin, Manning, Chen, Marquis, Averyt, Tignor and Miller2007). All oceans showed a more intense warm period at almost all latitudes in the past two decades, a broader scale pattern that in general agrees with our observations. For the Atlantic at least, this recent warming pattern contrasts with the warming in the 1920s to 1940s, which was largely restricted to above 30°N in the northern hemisphere (Johannessen et al., Reference Johannessen, Bengtsson, Miles, Kuzmina, Semenov, Alekseev, Nagurnyi, Zakharov, Bobylev, Pettersson, Hasselmann and Cattle2004).
Our analysis shows that SST has developed in three progressive steps with an intensification of the warming after the 1976/1977, 1986/1987 and 1997/1998 El Niños. If this pattern continues, as seems likely from the growth of GHGs, a future intense El Niño may be followed, after a short ~one-year cool period related to La Niña, by a step growth to even higher SST and further penetration into polar waters with likely positive feedbacks from the Arctic to climate change.
We have described for the first time a globally synchronous pattern of pulsed short period (~1 year long) emanations of warm SST anomalies along the shelf slope and shelf from tropical seas towards the poles. The processes behind the anomalies and their propagation are still unclear, but poleward flowing boundary currents are strong candidates. A number of regional examples of poleward flows of warm sea temperature anomalies in boundary currents have been reported, but to our knowledge a globally synchronous pattern to their occurrence has not been previously reported or the extent of their poleward propagation widely recognised. The discovery of a new mechanism by which heat from tropical seas is being moved in a pulsating manner towards the poles along the shelf/slope margin of the oceans has major and wide ranging implications for mankind, influencing, e.g. energy consumption, weather, extreme events, the cryosphere, forest fires, heat waves, droughts and ecosystem services. Synchronous polar directed temperature anomalies propagating along the shelf/slope from the tropics/subtropics, with reinforcing en route from atmospheric, ocean gyre and other sources, provides a mechanism that explains the timing and teleconnection of a wide range of observed hydrographic, ecosystem and cryospheric events. Warm tropical waters appear to be acting like a heart, accumulating heat and then pumping it in bursts that progressively move towards the poles, especially in eastern margin currents (Reid et al., Reference Reid, Holliday and Smyth2001b), a process that seems to be accelerating.
ACKNOWLEDGEMENTS
We dedicate this paper to Michael ColebrookFootnote * and Robin Pingree for their considerable contributions, respectively, to the understanding of plankton ecology and shelf/slope hydrography and are grateful to Robin Pingree, Tom Rossby and the anonymous refereees for suggestions that helped improve the manuscript. Funding for the colour illustrations was shared between SAHFOS, MIPU, MBA and the BIODIMAR programme.


