


INTRODUCTION
“How old is it?” is the question most frequently asked about rock art, but it is also the question that may be the most complicated to answer. Many techniques have been tested in order to try to provide answers, from historical records, oral testimonies, and stylistic characteristics to physical and chemical techniques such as radiocarbon and uranium-series dating (e.g. Nelson et al. Reference Nelson, Chaloupka, Chippindale, Alderson and Southon1995; Hellstrom Reference Hellstrom2012; Lemaitre Reference Lemaitre2013; Aubert et al. Reference Aubert, Brumm, Ramli, Sutikna, Saptomo, Hakim, Morwood, van den Bergh, Kinsley and Dosseto2014).
One of the most (if not the most) currently used technique to date rock art is 14C dating. Because of the sacred nature (both religious and scientific) of rock art, it was extremely difficult to collect enough samples to provide a date before the 1980s and the development of accelerator mass spectrometry (AMS), which can provide dates from samples weighing only a few milligrams. The first 14C date obtained on rock art with 14C AMS was at the Oxford Radiocarbon Accelerator Unit, University of Oxford, on South African rock art (van der Merwe et al. Reference van der Merwe, Sealy and Yates1987). Subsequently, a large number of rock art and Paleolithic cave art samples from Europe and Australia have been dated (e.g. Nelson et al. Reference Nelson, Chaloupka, Chippindale, Alderson and Southon1995; Gillespie Reference Gillespie1997; Valladas et al. Reference Valladas, Tisnérat-Laborde, Cachier, Arnold, de Quiros, Cabrera-Valdes, Clottes, Courtin, Fortea-Perez, Gonzalez-Sainz and Moure-Romanillo2001, Reference Valladas, Kaltnecker, Quiles, Tisnérat-Laborde, Genty, Arnold, Delqué-Količ, Moreau, Baffier, Cleyet Merle, Clottes, Girard, Monney, Montes, Sainz, Sanchidrian and Simonnet2013; Valladas Reference Valladas2003; Pettitt and Pike Reference Pettitt and Pike2007; David et al. Reference David, Geneste, Petchey, Delannoy, Barker and Eccleston2013; Quiles et al. Reference Quiles, Valladas, Geneste, Clottes, Baffler, Berthier, Brock, Bronk Ramsey, Delqué-Količ, Dumoulin, Hajdas, Hippe, Hodgins, Hogg, Jull, Kaltnecker, De Martino, Oberlin, Petchey, Steier, Synal, van der Plicht, Wild and Zazzo2014, Reference Quiles, Valladas, Bocherens, Delqué-Količ, Kaltnecker, van der Plicht, Delannoy, Feruglio, Fritz, Monney, Philippe, Tosello, Clottes and Geneste2016).
In southern Africa, fewer attempts at dating rock art have been made, all limited to dating of weathering crusts (Mazel and Watchman Reference Mazel and Watchman1997, Reference Mazel and Watchman2003) as it has long been assumed that the black paints used in the art were based on mineral pigments rather than carbon. However, recent characterization studies have provided new insights on black paints, revealing that carbon-based paints were indeed used (Prinsloo et al. Reference Prinsloo, Barnard, Meiklejohn and Hall2008; Tournié et al. Reference Tournié, Prinsloo, Paris, Colomban and Smith2011; Bonneau et al. Reference Bonneau, Pearce and Pollard2012; Hoerlé et al. Reference Hoerlé, Pearce, Bertrand, Sandt and Menu2016). Following these studies, we successfully obtained three dates on black paintings from collapsed rock flakes at site RSA TYN2 (South Africa) using a modified acid-base-acid (ABA) pretreatment protocol (Bonneau et al. Reference Bonneau, Brock, Higham, Pearce and Pollard2011). This project revealed the importance of characterizing the pigment prior to 14C dating in order to identify precisely what is being dated, and what possible 14C contaminants may be present, and thus adequately to interpret the dates obtained.
Characterization of paints before selection for 14C dating is not new, but is often limited to portable X-ray fluorescence (XRF) analysis, which, in the absence of iron or manganese, may lead to the assumption that black paints are made from carbon-based pigments. More recently, Beck et al. (Reference Beck, Genty, Lahlil, Lebon, Tereygeol, Vignaud, Reiche, Lambert, Valladas and Kaltnecker2013, Reference Beck, Rousselière, Castaing, Duran, Lebon, Moignard and Plassard2014) and Lahlil et al. (Reference Lahlil, Lebon, Beck, Rousseliere, Vignaud, Reiche, Menu, Paillet and Plassard2012) analyzed French cave art with nondestructive portable instruments (portable XRF, a micro-Raman spectrometer, and an infrared reflectography camera) to track carbon-based pigments before selecting samples for 14C dating. However, none of these studies fully characterize either the pigment (charcoal, soot, carbon-blacks) or the weathering products, which can be 14C contaminants such as calcium carbonates, calcium oxalates, or humic acids.
To assess this problem, the first characterization and pretreatment protocol (Bonneau et al. Reference Bonneau, Brock, Higham, Pearce and Pollard2011) has been extended and improved. It aims to select the paints that would be the most likely to be successfully 14C dated by using a multi-instrument protocol. To achieve this aim, the protocol estimates the quantity of paint needed depending on the nature of the paint and the weathering and alteration products present, and makes it possible to adjust the chemical pretreatment to remove contaminants at the same time as conserving as much as possible of the sample to be dated.
METHODS
Rock Art Sites
This project required the collection of “large” samples (i.e. at least 50 mg) to improve the existing protocols. Two areas served this purpose perfectly: the Thune Dam area in Botswana and the Phuthiatsana Valley in Lesotho. In both cases, dams were under construction in these areas at the time of our study and subsequently flooded many rock art sites (Figure 1). These sites were comprehensively photographed, traced, recorded, and in some cases also excavated by archaeologists before any sampling or flooding commenced.
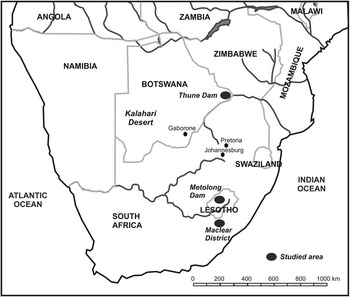
Figure 1 Southern Africa: locations of rock art research areas dated in the current project
Once the protocols were well established, they were then tested on material from sites in the Maclear District of South Africa’s Eastern Cape Province (Figure 1), where rock art sites are not currently endangered by dams. The initial project started in 2010 with a site from this area, RSA TYN2.
Thune Dam, Botswana
The Thune Dam is located in the Kalahari Desert, near the town of Mathathane, approximately 20 km west of the South African border, and 500 km northeast of Gaborone, the capital of Botswana. Forty archaeological sites are present in a narrow band about 35 km long and 5 km wide along the Thune River. Six of the rock art sites were flooded by the construction of the dam and 18 others may be impacted in the event of exceptionally high floods. All 24 sites were recorded and some excavated to reveal the presence of Later Stone Age artifacts of Holocene age (Walker Reference Walker2009).
The imagery at the sites includes finger paintings and San (Bushman) fine-line tradition paintings, but few superimpositions appear. The finger paintings are peripheral to, or superimposed upon, San paintings and thus appear to have been made at a later period.
Phuthiatsana Valley, Lesotho
The Phuthiatsana Valley is located approximately 30 km east of Maseru, the capital of Lesotho. From 1979 to 1982, this valley (and three other areas) was examined by Lucas Smits and his team then of the National University of Lesotho in order to record rock art sites as part of the Analysis of Rock Art of Lesotho (ARAL) project, subsequently extended to yet other regions of the country (Smits Reference Smits1983). A total of 259 sites were recorded in the Phuthiatsana Valley and adjacent areas.
In 1989 and 1990, excavations and surveys were conducted in the Phuthiatsana Valley by one of us (PM). These were resumed in 2008 through to 2010 ahead of the construction of the Metolong Dam in the middle section of the Phuthiatsana River. The excavations provided evidence of both Middle Stone Age (MSA) and Later Stone Age (LSA) occupations in several of the valley’s rockshelters and also documented aspects of the more recent settlement of the area by Sotho-speaking people in the 19th and 20th centuries (Mitchell Reference Mitchell1993, Reference Mitchell1994; Mitchell and Whitelaw Reference Mitchell and Whitelaw2005; King et al. Reference King, Arthur and Mitchell2014; Mitchell and Arthur Reference Mitchell and Arthur2014).
Within the catchment of the Metolong Dam, a total of 28 rock art sites were recorded. All were comprehensively documented, photographed, and traced and some of the scientifically most interesting and best-preserved panels were removed for long-term conservation. Five separate painting traditions were identified in the Metolong Dam area, the two most common of which are the San fine-line tradition and a series of paintings attributable to the area’s recent Basotho population.
Maclear District, South Africa
The Maclear District is located around the town of Maclear, in the Eastern Cape Province of South Africa. About 300 rock art sites have been recorded in this area and the adjacent districts, which together form part of a larger region known as Nomansland by the 19th-century colonial administration (Blundell Reference Blundell2004). Although very few dates from archaeological deposits are available for Nomansland, they give evidence of an occupation by hunter-gatherers from at least 29,000 yr ago to the colonial period (Opperman Reference Opperman1987, Reference Opperman1996; Opperman and Heydenrych Reference Opperman and Heydenrych1990; Blundell Reference Blundell2004).
Paintings were selected for sampling at 14 sites, all of the San fine-line tradition (Figure 2). None of these sites have yet been excavated, thus no archaeological material is available for comparison with the paintings or to give an idea of the periods at which the shelters may have been occupied.

Figure 2 Example of fine-line San paintings (panel from RSA CHA1, South Africa).
Instrumentation for Paint Analysis
To conduct the characterization of paints, a multi-instrumentation protocol has been developed to analyze unprepared and cross-section samples using microscopy, Raman spectroscopy, scanning electron microscopy coupled with X-ray energy dispersive spectrometer (SEM-EDS), and Fourier transform infrared (FTIR) spectroscopy.
Microscopic observations were conducted with a Leica DMLP microscope, equipped with a Leica DFC450 camera and objectives at ×10, ×20, and ×50, using reflected light.
SEM-EDS analysis was carried out with a JEOL 840-A SEM equipped with a PGT Avalon EDS at Laval University, Quebec City, Canada. An electron beam of 15 kV was used and observations were performed with secondary electrons. Samples were observed on a carbon stub with a gold-palladium coating. EDS analyses were performed with a 180-s acquisition time. Elemental mapping was conducted using a Hitachi S3400N SEM-EDS equipped with an Oxford Instrument EDS, cooled by Peltier effect, at the Geotop, Université du Québec à Montréal, Canada. Elemental maps were recorded at a pressure of 60 Pa, with an electron beam of 15 kV. Ten frames of 512 × 384 pixels were acquired per map, with an accumulation of 2000 µs per point.
Raman and FTIR spectroscopy analyses were undertaken at the Laboratoire de Caractérisation des Matériaux, Université de Montréal, Canada. An InVia microspectrometer Raman was used with 514-nm and 785-nm lasers and ×50 long-focal objective. Spectra were acquired from 100 to 2500 cm–1 at 2 cm–1 resolution.
The Stingray system employed combined a Digilab FTS7000e FTIR spectrometer and an IR UMA600 microscope. Analysis was carried out over a spectral range of 4000–750 cm–1, with 128 scans at 2 cm–1 resolution. Samples were crushed between two diamond microcompression cells and analyzed in transmission.
Interpretation of spectra was undertaken using Grams and CrystalSleuth software, and the RRUFF database, the IRUG Spectral database, available literature, and an in-house database prepared from reference minerals from the geological collection of the Earth and Atmospheric Sciences Department, Université du Québec à Montréal.
Characterization Protocol
The entire protocol is summarized in Figure 3 and discussed in detail below.

Figure 3 Sample characterization, selection, and pretreatment protocol. This schema details the different information obtained by each step of the protocol on each part of the sample. It states the order in which each analysis was conducted.
In-situ Sampling
In-situ preselection of paintings with portable instruments, as previously reported by Beck et al. (Reference Beck, Genty, Lahlil, Lebon, Tereygeol, Vignaud, Reiche, Lambert, Valladas and Kaltnecker2013), for example, was not possible as no portable instruments (e.g. XRF or Raman spectroscopy) were available in the research institutions involved in this project. Moreover, in the case of XRF, false positives may appear as the rock support in our sites [Clarens Formation sandstone (Lesotho and South Africa) and forest sandstone (Botswana)] is Fe-rich. This issue has been reported by Beck et al. (Reference Beck, Rousselière, Castaing, Duran, Lebon, Moignard and Plassard2014) and solved by a regression curve. Thus, sampling was the alternative option selected.
To avoid extensive sampling, which would damage the rock paintings, a two-step strategy has been developed: first, a barely visible sample is collected in situ. The initial sample is about 0.5 mm². It is collected from parts of the figure already damaged by weathering with a scalpel cleaned with distilled water and stored in a gelatin capsule. Characterization is carried out on this sample unprepared and in cross-section. Then, based on the results, an estimation of the quantity of paint needed is made and, if agreed by the relevant heritage authority, collected for 14C dating.
Microscopic Observations
Observations under the microscope make it possible to see some eolian deposits, such as soils or sand grains and sometimes charcoal pieces. If charcoal pieces are visible at the surface of the sample, they should be discarded as these may reflect posterior deposition by fire in the rockshelter, and will thus not reflect the date of the paint.
The cross-section is used to assess the homogeneity of the paint layer and any possible overpainting episodes. These episodes are easily visible most of the time under microscopic observation as two paint layers are visible, separated by a transparent or white layer composed of weathering products. However, in a few cases, this weathering layer is too small to be seen and can be detected only by scanning electron microscope (SEM) elemental mapping, conducted later in the characterization protocol. If a layer of repainting is present and if this layer is composed of carbon-based paint, then the sample is discarded as the date obtained would be a mixture of the two layers. In this study, only one sample has multiple layers of repainting composed of carbon-based paint, but 10 black paint layers were found to have red paint layers underneath them.
At this step, the thickness of the paint layer is estimated and the microstratigraphy observed: Is the paint made directly on top of the rock? Was there a preparation of the rock surface? Is there a crust or eolian deposits on top of the black layer? All of these details need to be answered since, when collecting the sample, despite taking many precautions, these layers surrounding the paint will be collected too.
Raman Spectroscopy Analysis
Raman spectroscopy is used to identify the components comprising the paint and the surrounding layers. Characterization should be conducted with both green and near-IR lasers to give a complete understanding of the sample, as they do not excite the same chemical bonds.
For a carbon-based paint (i.e. charcoal, carbon-blacks, soot), two broad peaks centered around 1320 and 1590 cm–1 are recorded. At this step, the green laser should be preferred as the near-IR laser is able to excite the chemical bonds of organic matter present in the sample, presenting the same peaks, even though they are not part of the paint. Furthermore, if the paint is made of a carbon-based pigment but contains little carbon, as is the case for soot for example, obtaining a spectrum with the green laser would be difficult. Finally, a long exposure to the green laser can burn the sample and amorphous carbon peaks will then appear without correlations with the original paint.
If the paint is not carbon based, but made of iron oxides, manganese oxides, or other minerals, they may not always react to green laser stimulation or to near-IR stimulation [e.g. hematite reacts better to the near-IR laser than to the green laser (Bonneau et al. Reference Bonneau, Pearce and Pollard2012)]. As a result, it is necessary to use both lasers to achieve the best characterization possible.
To distinguish between carbon-based paints, deconvolution of the two broad peaks (called the D-band and G-band) is performed following the parameters detailed by Coccato et al. (Reference Coccato, Jehlicka, Moens and Vandenabeele2015): Lorentzian curves are used to model the peaks, a linear baseline is subtracted from 800–1800 cm–1, and Grams is used as software. The positions of the peaks, their intensity, and their area are collected with Grams and edited with Excel. These data do not make it possible to distinguish carbon-based compounds between carbon-blacks and charcoal. The peaks are too similar for a proper distinction. However, if compared to Coccato et al.’s (2015) study, the peaks in our study are all in the group for charcoal and flame carbons, which confirms their attribution to carbon-blacks and charcoal, and the absence of graphite, i.e. mineral carbon. In the case of soot, a distinction can be made in a few cases with this deconvolution process as the positions may be slightly different from those of carbon-blacks and charcoal (Figure 4). This should, however, be coupled with SEM observations to assess the identification.

Figure 4 (a) D-band Raman peaks plotted against G-band Raman peaks for distinction between soot, charcoal and carbon-blacks (samples from Lesotho; the final identification of the paint was obtained by SEM observations); (b) principal component analysis of the same samples obtained from D-band position, G-band position, area ratio, and intensity ratio (analysis carried out with JMP).
Nevertheless, the fact that soot may exhibit slightly different peak positions may serve to discard samples contaminated at the surface with soot crusts from firewood, in the event that soot itself was not the pigment used. In this case, data obtained on unprepared samples and samples in cross-sections are compared and should reveal that the results are the same, within 10 cm–1, in the positions of peaks, and within 10% in intensity and area ratios. This is considered acceptable and tends to prove that the pigments used are chemically homogeneous with no carbon-based deposits at their surface. Only two samples did not match these requirements and thus were not sampled for 14C dating.
Carbonaceous matter peaks are sometimes influenced by the presence of peaks of clay minerals coming from a thin weathering layer on top of the black paint layer, or from intentional admixtures. These peaks modify the aspect of carbonaceous matter peaks and cannot be separated from them, even with deconvolution. Hence, these spectra are discarded for the deconvolution process.
The disadvantage of cross-sections at this step is the presence of epoxy resin that penetrates the sample and sometimes masks carbon peaks. Only spectra without resin peaks were used for deconvolution. On the other hand, analysis of both forms of the sample (raw and cross-section), as previously detailed, allows assessment of the chemical homogeneity of the paint, which is essential for 14C dating.
Peaks may be influenced by the presence of humic acids, too, as was the case for the Lesotho samples. There was no way to remove them from the spectra before the deconvolution process, introducing larger errors in the peak positions, intensity, and area ratios determined. Luckily, humic acids were present only in a few samples and detected with FTIR spectroscopy analysis, making it possible to have a better understanding of the deconvolution results.
Raman analysis with the green laser makes it possible to estimate the percentage of carbon present in the sample. Indeed, the tests performed show that if no or only weak peaks of carbonaceous matter are recorded with the green laser, the quantity of carbon present after pretreatment will be less than 3%.
Raman analysis conducted on the layers surrounding the paint and on the paint itself identifies their components (clay, calcium carbonates, calcium sulfates, calcium oxalates, etc.) and thus determines which should be removed before 14C dating.
SEM-EDS Observations and Elemental Analysis
SEM-EDS is used for both observations and elemental analysis. The coating should be made with gold or other metals. Carbon coating should be avoided as this element is tracked during analysis. Elemental analysis and mapping (of cross-sections only) show the repartition of chemical elements in the sample. This provides details about the chemical elements making up the paint and the surrounding layers. If compared to Raman results, this makes it possible to understand the place of each compound and the feasibility of excluding them prior to dating.
Semi-quantitative data on calcium and sulfur were collected from elemental maps. To be able to get reproducible results, maps are taken for 2000 µs per point, in a frame of 512×384 pixels, and 10 frames were acquired. If compared with conventional semi-quantitative EDS analysis conducted on the same part of the sample for 300 s, the results are within 5% error. The proportions of calcium obtained from the different sites range from 2 to 24% (±2%).
On unprepared samples, the morphology of the particles making up the samples is observed (Figure 5). In the case of carbon-based pigments, it is possible to distinguish between charcoal (long pieces with holes inside), soot (small balls), and carbon-blacks (flakes of different sizes) (Figure 5). This distinction has been previously reported by Tomasini et al. (Reference Tomasini, Siracusano and Maier2012).

Figure 5 Five different morphologies for carbon-based samples recorded in this study (secondary electron SEM observation).
FTIR Spectroscopy Analysis
FTIR analysis is conducted to confirm the presence of 14C contaminants such as calcium oxalates and humic acids, and to give an approximation of their abundance in the sample to be collected.
FTIR analysis, by definition, is quantitative as it compares the absorption of a beam of wavelengths by a sample and a second beam with the same wavelengths without the sample. One needs, however, to take into account the molecular extinction coefficient (ε). It is thus possible to make a ratio between the calcium oxalate peaks, calcium carbonate peaks, and calcium sulfate peaks (the three compounds of the sample containing calcium, the rate of calcium, and sulfur being calculated previously during SEM-EDS analysis).
To calculate this ratio, the absorption of the main Ca-X bond peak of each compound (i.e. the peak at 1618 cm–1 for calcium oxalates, peak at 1114 cm–1 for calcium sulfates, and peak at 1400 cm–1 for calcium carbonates) is normalized against the sum of the intensities of the three compounds (Equation 1):
 $${\rm \,\%\,}_{{ox}} {\equals}{{A_{{ox}} } \over {(A_{{ox}} {\plus}{\rm }A_{{ca}} {\plus}A_{{sul}} )}}{\rm }{\times}100$$
where % ox is the percentage of calcium oxalates in the FTIR spectrum, A ox the absorption of the main peak of calcium oxalates, A ca the absorption of the main peak of calcium carbonates, and A sul is the absorption of the main peak of calcium sulfates. A ox , A ca , and A sul are calculated by applying the Lambert-Beer law and using molecular extinction coefficients calculated from samples of known concentrations of each compound.
Percentages of each compound are calculated and then the proportion of each of them in the sample is estimated using the proportion of calcium obtained during SEM-EDS analysis (Equation 2):
 $$P_{{ox}} {\equals}{\rm }{{SEM_{{Ca}} {\rm }{\times}{\rm \,\%\,}_{{ox}} } \over {100}}$$
where P ox is the percentage of calcium oxalates estimated in the whole sample and SEM Ca the proportion of calcium obtained with SEM-EDS. In this project, P ox was used with a systematic error of 20% due to large uncertainties in the determination of the proportion of calcium with SEM-EDS, since no standard was used for semi-quantitative determination.
This determination is made on the whole sample as, when collection of the sample is carried out in situ, all the surrounding layers will be taken at the same time. Hence, the proportion of calcium may be calculated for each layer composing the sample, but only the result on the whole sample is used. We also chose to conduct FTIR analysis on unprepared samples for the same reasons. Micro-ATR (attenuated total reflectance) germanium may be used to focus on the different layers, but does not reflect the entire composition of the material to be sampled.
Following FTIR analysis, it was possible to determine the proportion of calcium oxalates, calcium sulfates, and calcium carbonates in the collected samples: from 2±0.5% to 21±4% for calcium oxalates, from 2±1% to 7±1% for calcium sulfates, and from 2±1% to 4±1% for calcium carbonates.
In the case of humic acids, very weak peaks were observed in just a handful of samples. They are thought to be present in about 5% of the samples, and can be easily removed with NaOH. Thus, no more detailed estimation has been conducted.
Having undertaken all of the stages outlined above, paints, their alterations, and their weathering products are now identified. Following the initial tests conducted (Bonneau et al. Reference Bonneau, Brock, Higham, Pearce and Pollard2011), a modified ABA pretreatment was established. However, to try to reduce the quantity of sample to be taken, tests were further undertaken to adjust the length of each step to avoid as much as possible the loss of sample.
Modified ABA Chemical Pretreatment and 14C Dating
Chemical pretreatment is almost certainly the key element in accurate 14C dating. There are essentially two important questions to be asked of any pretreatment method (Bronk Ramsey et al. Reference Bronk Ramsey, Higham and Leach2004: 18):
-
∙ Does the method remove contamination present in the sample (acceptable levels will depend on the relative age of the contaminants but are likely to be <1–5%)?
-
∙ Does the method add significant levels of contamination [acceptable levels are <0.1% since 14C concentration (i.e. “modern” carbon) is usually radically different]? […] (For example, a sample containing 10 mg C needs to keep any added contaminants below 10 µg.)
To answer the first question, FTIR analyses were conducted after pretreatment to assess the absence of the previously recorded 14C contaminants. Once dried, samples were weighed, and, if large enough (46 samples out of 49), an aliquot was collected for FTIR spectroscopic analysis. FTIR spectroscopy has a detection limit from 1 to 5% depending on the mineral or organic compound. In the case of calcium oxalates, as they contain a high proportion of water, this detection limit is estimated to be around 2–3%. Only one sample (out of 49 submitted) presented calcium oxalates after pretreatment and was rejected accordingly.
The 14C contaminants found in our samples are calcium carbonates, humic acids, and calcium oxalates. The first two are commonly found in samples from various origins and thus their removal using chemical pretreatments has been widely studied (Brock et al. Reference Brock, Higham, Ditchfield and Bronk Ramsey2010). On the other hand, calcium oxalates have received very little attention as they are rarely identified in common 14C samples. During the initial project at the Oxford Radiocarbon Accelerator Unit (ORAU), preliminary tests were conducted on calcium oxalates and published by Bonneau et al. (Reference Bonneau, Brock, Higham, Pearce and Pollard2011). Tests conducted for the present project aimed at reducing the time that samples need to be immersed in acids and bases while efficiently removing the 14C contaminants. The emphasis was placed on calcium oxalate removal as this was the main contaminant for our samples.
Investigations on Calcium Oxalates
Aliquots of pure calcium oxalates (calcium oxalate monohydrate 98%, ACROS Organics) of different weights (1, 3, 5, 10, 30, 50, 100 mg) were added to sample tubes with 10 mL of 1M HCl. Samples were left for dissolution in three different conditions: 80°C heating (as would be the case using the routine HCl pretreatment protocol at ORAU); ultrasonication with no heating; and ultrasonication at 80°C. The results (Figure 6) are all very similar to each other. The ultrasonication with no heating proves to take slightly more time to dissolve calcium oxalates than heating, whereas the addition of heating to ultrasonication proves to dissolve calcium oxalates slightly faster than only heating.

Figure 6 Weight of calcium oxalates dissolved against time in three different conditions (plots include uncertainties).
Experiments on Artificial Mixtures
Previous tests show that two different conditions (heating and ultrasonication with heating) lead to a better effectiveness in dissolving calcium oxalates. To evaluate the impact of such conditions on carbonaceous matter, similar tests were conducted on modern charcoal.
Aliquots of 5 mg modern charcoal were prepared in two series of 14 tubes with 10 mL of 1M HCl. The first set was heated at 80°C, whereas the second set was ultrasonicated at 80°C, for 10 to 120 min. Samples were then cleaned three times with distilled water and weighed. However, while pipetting cleaning distilled water, pieces of charcoal may be taken. Hence, the distilled water used to clean each sample was evaporated and any pieces of charcoal present in it weighed too, in order to make a correction between dissolving and pipetting actions. The results (Figure 7) are presented as corrected with the proportion of charcoal removed during pipetting, i.e. between 0.5 and 2%, depending on the samples.

Figure 7 Loss of charcoal during two different pretreatments (plots include uncertainties).
Using only heating, the loss of sample is 34±13%, whereas it is 42±14% for ultrasonication with heating, irrespective of the time spent in the HCl. This slightly higher loss of sample may be attributed to the permanent moving of the particles, which makes the acid more efficient at reacting with them. It may also introduce physical deterioration. However, it seems that the impact on calcium oxalates is less than that on charcoal. Hence, to dissolve calcium oxalates, only heating has been chosen.
Experiments on Real Samples and Results
Forty-nine samples were pretreated for 14C dating using the following protocol (when grains from the rock support were present, they were previously removed physically with a sterile scalpel blade under binocular glass):
-
∙ 1M HCl at 80°C for 20 to 90 min depending on the quantity of 14C contaminants estimated and using the exponential equation shown in Figure 5.
-
∙ Rinsing with ultrapure Milli-Q™ water (Millipore Corp.).
-
∙ 0.1M NaOH at room temperature for 10 to 20 min depending on the estimation of the presence of humic acids: 10 min if not detected with FTIR, and 20 min if detected.
-
∙ Rinsing with ultrapure Milli-Q water.
-
∙ 1M HCl at 80°C for 60 min.
-
∙ Rinsing with ultrapure Milli-Q water.
-
∙ Samples are then freeze-dried as detailed in the following section.
FTIR analysis conducted on each of these samples after pretreatments proves that all of the 14C contaminants were successfully removed (Figure 8), except for sample PRH1-2013-C4. This sample had a high proportion of calcium oxalates (20±3%) and calcium carbonates (4±1%). A first 1M HCl acidification was conducted for 90 min, but was not enough to remove all contaminants; thus, this step was repeated with fresh 1M HCl for a further 90 min, after which some contaminants still remained. However, these two steps considerably reduced the proportion of carbonaceous matter to be dated. The sample was therefore discarded.

Figure 8 FTIR spectra before and after pretreatment from sample TD12-2012-9 (Botswana) (Ox: calcium oxalates; CaS: calcium sulfates; Si-O: chemical bonds).
Using this entire pretreatment protocol and including the sampling of a tiny piece for FTIR analysis, the loss of sample in weight is 61±22% (of the 49 samples studied). However, it is highly dependent upon the proportion of contaminants estimated. For example, samples from Botswana, where calcium oxalates represent about 20% of each of the samples, the loss of sample during pretreatment was more than 70%. Moreover, charcoal and soot seem to be more affected by this pretreatment than carbon-blacks, maybe due to the difference in the heating process used to manufacture them.
This loss is slightly lower than the 90% reported by Valladas et al. (Reference Valladas, Tisnérat-Laborde, Cachier, Arnold, de Quiros, Cabrera-Valdes, Clottes, Courtin, Fortea-Perez, Gonzalez-Sainz and Moure-Romanillo2001) during pretreatment of Paleolithic cave paintings composed of charcoal. However, a part of this loss is due to the presence of humic acids that were extracted for dating separately.
This pretreatment yielded between 0.2 and 68.4 mg of purified samples for subsequent dating.
Combustion, Graphitization, and AMS Dating
After chemical pretreatment, samples were frozen and dried using a VaCo 5 freezer-dryer for a minimum of 12 hr. Once dried, they were weighed, and, if large enough, an aliquot was collected for FTIR spectroscopic analysis. Sufficiently large samples (i.e. yielding greater than ~0.6 mg C) were combusted and graphitized according to the routine ORAU protocol previously published by Brock et al. (Reference Brock, Higham, Ditchfield and Bronk Ramsey2010). Only three samples were large enough to be treated as routine “large graphite” (i.e. ~1.6 mg C) AMS targets, and a further three gave routine “small graphite” (i.e. ~0.8 mg C) AMS targets. The majority of the samples selected for 14C dating produced lower carbon yields of between 0.05 and ~0.6 mg, and were thus dated as nonroutine “very small graphite” AMS targets.
For “very small graphite” samples, a desiccant, magnesium perchlorate (Mg(ClO4)2), was added to the water trap of the reactor rigs, following a previously established protocol (Motuzaite-Matuzeviciute et al. Reference Motuzaite-Matuzeviciute, Staff, Hunt, Liu and Jones2013). Graphitization followed, with the reduction of CO2 in the presence of excess hydrogen (in the ratio of ~2.2 H2:CO2) and the iron powder, and heated at 560°C for 6 hr to yield pure C (graphite) and water by cooling and condensing. The presence of the desiccant helped to draw out H2O, and therefore optimized the conversion of CO2 to graphite for the very small samples, which are more sensitive to traces of water vapor that interfere with the graphitization reaction. This addition has previously been found to be necessary for the lowest yielding samples (i.e. those ≤0.5 mg C) (Motuzaite-Matuzeviciute et al. Reference Motuzaite-Matuzeviciute, Staff, Hunt, Liu and Jones2013).
Four samples yielded less than 50 µg of carbon and, although these were dated for experimental purposes (with application of the revised graphitization protocol for “very small graphite” targets outlined above), the ages obtained are not considered here as the level of contamination in them would be proportionally too high, compared to conventional AMS targets.
The resulting graphite was then pressed into aluminum targets and dated using the University of Oxford’s HVEE tandem AMS system (Bronk Ramsey et al. Reference Bronk Ramsey, Higham and Leach2004; Staff et al. Reference Staff, Reynard, Brock and Bronk Ramsey2014). Conventional 14C ages before present (BP) were calculated relative to the oxalic acid (HOXII) standard and normalized for isotopic fractionation (Stuiver and Polach Reference Stuiver and Polach1977). All 14C determinations were calibrated using the Southern Hemisphere SHCal13 calibration curve (Hogg et al. Reference Hogg, Hua, Blackwell, Niu, Buck, Guilderson, Heaton, Palmer, Reimer and Reimer2013) and OxCal v 4.2 software (Bronk Ramsey Reference Bronk Ramsey2009).
RESULTS AND DISCUSSION
Characterization Results
In this study, 101 black paint samples were characterized. They are all made with carbon-based pigments. Only 49 samples were submitted for 14C dating. Seven of these failed, mostly in the first stage of the development of the characterization and selection protocol. One other sample was discarded due to the presence of calcium oxalates after pretreatment.
The black pigments characterized were mostly found to be carbon-blacks (89 of 101); i.e. the result of incomplete combustion of an organic compound. Charcoal (6 out of 101) and soot (6 of 101) were also identified.
This characterization is essential to interpreting the 14C dates obtained. Indeed, if a date is produced from a charcoal painting, it will reflect the age of the death of the tree from which the charcoal derived, which could potentially be much older than the painting. Thus, the date would provide only a maximum age for the paint and the painting episode. On the other hand, dates obtained on carbon-black and soot paints will most likely reflect the time of painting. Carbon-black may be found in nature, but will not survive more than 2 or 3 months. Most of the time, this kind of pigment is thought to be made by humans (Garate et al. Reference Garate, Laval and Menu2004).
Regardless of the areas studied, the weathering products surrounding paint layers were similar, even if their repartition and proportions differed between sites. In this study, the most common weathering product found in and surrounding paint layers was calcium oxalates in the form of whewellite [Ca(C2O4).H2O] or weddellite [Ca(C2O4).2H2O]. Calcium sulfates more or less hydrated (CaSO4.xH2O), calcium carbonates (CaCO3), humic acids, and hydromagnesite [Mg5(CO3)4(OH)2.4(H2O)] were also observed. Of these, only calcium oxalates, humic acids, hydromagnesite, and calcium carbonates contain carbon and should be removed before 14C dating.
Calcium carbonates are present at the surface of the rock and doubtless come from the rock, which has a calcitic matrix. They are few in quantity and their carbon may be old, linked to the formation of the rock, several millions years ago. On the other hand, they may form as weathering products and include recent carbon.
Calcium oxalates are the result of different processes involving lichens, bacteria, percolating water, rock support, and paint binders (Watchman Reference Watchman1990; Bonneau et al. Reference Bonneau, Pearce and Pollard2012). In this case, it is impossible to track the provenance of their carbon. Moreover, the presence of the two forms of calcium oxalates in and surrounding the same paint layer proves that several formation processes are involved, and thus that several sources of carbon are present. Calcium oxalate crusts have been 14C dated previously at rock art sites in southern Africa and gave termini ante quos and post quos (Mazel and Watchman Reference Mazel and Watchman1997, Reference Mazel and Watchman2003). However, considering the results given by these studies and the debate about the provenance of carbon metabolized, we decided to remove them in this project.
Humic acids come from degradation of the carbon matter making up the paint. Just as for calcium oxalates, the sources of the carbon metabolized are multiple and they should be removed prior to 14C dating. On the other hand, once separated from the paint, the humic fraction containing humic acids can also be dated to see to what degree the initial pigment sample might have been contaminated (Valladas et al. Reference Valladas, Tisnérat-Laborde, Cachier, Arnold, de Quiros, Cabrera-Valdes, Clottes, Courtin, Fortea-Perez, Gonzalez-Sainz and Moure-Romanillo2001). However, in our project, the humic fraction was too small (<5% according to FTIR results) and has not been considered.
Selection and Collection of Samples for 14C Dating
At this stage, a question arises about the size of the sample to be collected on site. First, to get a 14C date with an acceptable uncertainty at ORAU, ≥0.5 mg of carbon is needed for the AMS target. Raman analysis with the green laser makes it possible to estimate the percentage of carbon present in the sample (see Characterization Protocol section). In this study, the samples used for dating (including the ones for tests) were composed of between 0.5 and 15% carbon after pretreatment.
Coming back to the 0.5 mg of carbon needed, if 3% of the sample is carbon, this means that the sample after pretreatment should be at least 17 mg. The pretreatment removes on average 61% of the sample; thus, the initial sample collected should be 35 mg.
However, following the characterization results, it is possible to select samples containing a higher proportion of carbon and to adjust the previous estimation, in the first instance by using the SEM morphology. Soot samples are those with less carbon and most affected by the chemical pretreatment. Hence, they would require at least 35 mg of sample. In the case of carbon-blacks with a fine-flaky texture (i.e. composed of flakes from 0.5 to 2 µm in diameter), the percentage of carbon is mostly between 8 and 15% of carbon after pretreatment, and thus should require less than 15 mg starting weight.
Finally, a proper estimation of the 14C contaminants and of the time immersed in acids and bases can reduce the loss of sample to only ~40% during pretreatment. Hence, a sample of 10 to 15 mg would be required, which is estimated to correspond to an area of 2 to 3 cm², depending on the thickness of the paint layer.
This collection area should be discussed with the relevant heritage authority and, where appropriate, the traditional owners of the site in question. The use of already damaged parts and collection in the thickest part of the paint layer should be preferred. Moreover, the integrity of the representation should be maintained. In this study, collection of samples for 14C dating was conducted with sterile scalpel blades and with the operator wearing nitrile gloves (replaced between every sample). Samples were stored in glass vials. These vials were previously cleaned with methanol in an ultrasonic bath, followed by baking at 500°C overnight to evaporate any organic residue, and sealed with aluminum foil covered with Parafilm.
Dates
Forty-one measurements on 37 images were obtained (Appendix A in the online Supplementary Material). Out of the 35 very small graphite determinations, 13 were obtained on AMS targets between 0.05 and 0.1 mg of carbon. The determinations obtained should be treated with extreme precaution as the effect of contamination is higher. Out of these dates, four replicates were conducted on four images from the three studied regions, providing measurements in good agreement.
The oldest date obtained in this study is from site TD12 in Botswana, with an age of 4500±260 BP, calibrated at 5723–4420 cal BP (OxA-X-2555-46; Appendix A). The same period has been recorded on two samples in ARAL 252, Lesotho, but as the amount of carbon in them was very low, they are not considered reliable. More dates should be provided to assess the presence of San rock art in this part of Lesotho at this period.
Our data show that southern African hunter-gatherers were creating images on rockshelter walls as long ago as 2326–965 cal BP in western Lesotho, and 2998–2381 cal BP in the Maclear region of South Africa. This chronology falls into the same period as the minimum and maximum ages obtained previously on calcium oxalates at sites in the uKhahlamba-Drakensberg Escarpment of South Africa’s KwaZulu-Natal province by Mazel and Watchman (Reference Mazel and Watchman1997, Reference Mazel and Watchman2003), but our results provide direct ages for the images in question. Moreover, as dates were obtained on several panels from the same rockshelter, it was possible to evaluate the continuation of use of a single rockshelter, revealing that some were used for several centuries, even several millennia in the case of two sites in Botswana and South Africa. Finally, this dating project was coupled to a characterization study, allowing comparison of styles, paint recipes, and techniques over time. For a more detailed discussion of the dates themselves and subsequent more detailed interpretation, see Bonneau et al. (Reference Bonneau, Pearce, Mitchell, Staff, Arthur, Mallen, Brock and Higham2016).
Using the protocols outlined above, the dates we have obtained now enable developing a chronometrically grounded approach to diversity and change within San rock art. Because the meaning of San rock art is so well understood, these chronological changes should be understood in social terms (Lewis-Williams and Pearce Reference Lewis-Williams and Pearce2004).
CONCLUSION
The multi-instrumental characterization we employed proved to be efficient at selecting rock art samples for 14C dating, and, coupled with an adjusted chemical pretreatment, optimizes chances to date rock art in southern Africa. Furthermore, using this protocol, the type of carbon-based pigment dated is known, contaminants are tracked and dissolved, and thus the date obtained can be adequately discussed: event of paintings, minimum or maximum ages, contaminations, etc. The addition of an FTIR analysis check to assess the dissolution of previously identified 14C contaminants is a key for ensuring that the measurement was conducted only on the sample and that no significant contamination remains present in the sample. This protocol is a step forward in the field of rock art dating by reducing the sample size to be collected, by optimizing the success rate of such dating, and by limiting the impact on such valuable paintings while providing new chronological insights.
ACKNOWLEDGMENTS
This project was funded by the South African National Research Foundation (DP), the United Kingdom’s Natural Environment Research Council (PM; NERC 2011/2/4 and NERC 2013/2/11), the French Institute in South Africa (AB and DP), and the Social Sciences and Humanities Research Council of Canada (AB), the Fonds de Recherche Québécois Société et Culture (A.B.), and the Université du Québec à Montréal (AB). We are grateful to landowners and local communities for allowing us to work on their properties or in their territories. AB particularly thanks Prof Daniel Arsenault, Prof Michel Lamothe, and Raynald Lapointe for their help and advice; Michelle Laithier for her help with the figures; and the Laboratoire de Microanalyse (Université Laval) and the Laboratoire de Caractérisation des Matériaux (Université de Montréal) for permission to use their equipment.
SUPPLEMENTARY MATERIAL
To view supplementary material for this article, please visit http://dx.doi.org/10.1017/RDC.2016.69.


