INTRODUCTION
Nuclear fusion reactions D + D have been reported by laser-initiated processes in ultra-dense deuterium called D(-1) or d(-1) (Badiei et al., Reference Badiei, Andersson and Holmlid2010a; Andersson & Holmlid, Reference Andersson and Holmlid2012b; Holmlid, Reference Holmlid2012a; Reference Holmlid2013). These studies have employed ns pulsed lasers of the same type as used here. Recent results with ps range pulses (Olofson et al., Reference Olofson, Ehn, Bood and Holmlid2012) show a larger rate of particle ejection but otherwise agree with the ns pulsed results. As shown in around 20 publications (Badiei et al., Reference Badiei, Andersson and Holmlid2009a; Reference Badiei, Andersson and Holmlid2009b; Reference Badiei, Andersson and Holmlid2010b; Reference Badiei, Andersson and Holmlid2010c; Andersson & Holmlid, Reference Andersson and Holmlid2009; Reference Andersson and Holmlid2010; Holmlid et al., Reference Holmlid, Hora, Miley and Yang2009; Holmlid, Reference Holmlid2011), the D-D distance in the most common form of D(-1) is 2.3 pm. This gives a density of this ultra-dense material close to 1029 cm−3 or 140 kg cm−3. Theoretical results for the laser intensity at break-even (Slutz & Vesey, Reference Slutz and Vesey2005) and extrapolations from experimental results on fusion in D(-1) (Andersson & Holmlid, Reference Andersson and Holmlid2012b) indicate that approximately 1 J laser pulses should be sufficient for reaching break-even. The rather low energy value of 1 J for break-even is due to the very large density of the D(-1) material. The density n is so high that the Lawson criterion n τ ≥ 1022 m−3 s for D + D fusion only requires a confinement time τ of 0.2 ps.
D(-1) is a quantum material (Guénault, Reference Guénault2003) and is both superfluid (Andersson & Holmlid, Reference Andersson and Holmlid2011) and superconductive (Andersson et al., Reference Andersson, Holmlid and Fuelling2012) at room temperature. Similar experimental results of a superconductive state are known from very high density hydrogen clusters in voids (Schottky defects) measured by SQUIDS in palladium crystals (Lipson et al., Reference Lipson, Heuser, Castano, Miley, Lyakhov and Mitin2005). The close relation between these hydrogen clusters and D(-1) has been pointed out (Holmlid et al., Reference Holmlid, Hora, Miley and Yang2009). This may give increased fusion gains from targets with such clusters (Yang et al., Reference Yang, Miley, Flippo and Hora2011). This effect was discussed as due to Bose-Einstein condensation (Miley et al., Reference Miley, Hora, Philberth, Lipson, Shrestha, Marwan and Krivit2009) or involving a Casimir effect (Hora & Miley, Reference Hora and Miley2007). The properties of D(-1) may be due to formation of vortices in a Cooper pair electron fluid as suggested by Winterberg (Reference Winterberg2010a; Reference Winterberg2010b). The structure of D(-1) is formed by chain clusters D2N with N integer, formed by D-D pairs probably rotating around the vortex (Andersson & Holmlid, Reference Andersson and Holmlid2011; Reference Andersson and Holmlid2012a). To better understand the details of the laser-induced processes in this material, the time-of-flight (TOF) signal due to particles ejected from D(-1) is now studied with good time resolution. The number of MeV particles formed is so large that the ns-resolved TOF signal at a metal collector at 64 cm distance can be observed directly on an oscilloscope. The timing is analyzed to ascertain that indeed particles with energy >10 MeV u−1 are observed, and other signal sources like electrons and energetic photons only give small contributions. The observation of multi-MeV particles indicates nuclear fusion, either as a source or as a result.
THEORY
Ultra-dense deuterium d(-1) or D(-1) is the lowest energy form of deuterium atoms, but above D2 molecules on the energy scale. In fact, several different states of D(-1) with different bond distances exist (to be published). The D-D bond distance in D(-1) is approximately 2.3 pm in its most common form (Badiei et al., Reference Badiei, Andersson and Holmlid2009a; Reference Badiei, Andersson and Holmlid2009b; Reference Badiei, Andersson and Holmlid2010b; Reference Badiei, Andersson and Holmlid2010c; Andersson & Holmlid, Reference Andersson and Holmlid2009; Reference Andersson and Holmlid2010; Holmlid, Reference Holmlid2011). This corresponds to a density of 1029 cm−3. This material is closely related to dense deuterium D(1), which has a D-D distance of 150 pm. The rapid transformation between D(1) and D(-1) was described previously (Holmlid, Reference Holmlid2012c). A recent review of Rydberg matter gives further background concerning the properties of D(1) and D(-1) (Holmlid, Reference Holmlid2012b). An oscillation between these two forms of deuterium was observed (Badiei et al., Reference Badiei, Andersson and Holmlid2010c) and concluded to have a typical time of transformation of less than 0.1 s while the observed period was on the order of a few seconds. The transformation between the two forms is driven by the lower energy of the material in the form D(-1) (Andersson et al., Reference Andersson and Holmlid2011).
The properties of D(-1) have been amply described in the literature cited above and elsewhere. See for example the experimental studies of super-fluidity at room temperature (Andersson & Holmlid, Reference Andersson and Holmlid2011) and the observation of a magnetic Meissner effect which indicates superconductivity at room temperature (Andersson et al., Reference Andersson, Holmlid and Fuelling2012). D(-1) is relatively easy to produce, but the amount assembled is limited by the superfluidity which means that the film of D(-1) creeps away over the surfaces where it is deposited or formed (Guénault, Reference Guénault2003). This material is stable on metal surfaces and inside the catalyst used for its formation during several days (Badiei et al., Reference Badiei, Andersson and Holmlid2010c) in a vacuum (high or medium). However, D(-1) will react with oxygen and form water if exposed to air. It is not created just by the interaction of the laser with deuterium which is clear from experiments using just one pulse (Andersson & Holmlid, Reference Andersson and Holmlid2011), but is formed by a catalytic process. D(-1) exists often in equilibrium with other deuterium Rydberg matter phases like D(1) and D(3) (Andersson et al., Reference Andersson, Lönn and Holmlid2011; Holmlid, Reference Holmlid2012b; Reference Holmlid2012c). The D(-1) material consists mainly of chain clusters of the form D2N with N an integer (Holmlid, Reference Holmlid2012b; Andersson & Holmlid, Reference Andersson and Holmlid2012a). N may take values up to 40 and above. These clusters give the superfluid properties of D(-1) at room temperature (Andersson & Holmlid, Reference Andersson and Holmlid2011). At elevated temperature, a phase transition is detected (to be published) and the high-temperature phase is not yet well characterized. A non-superfluid (normal) part of the D(-1) phase has also been studied, in the form of clusters D4 (Holmlid, Reference Holmlid2011). D(-1) forms superfluid layers only on metal and metal oxide surfaces. On polymer surfaces, the nucleation to D(-1) is prevented (Olofson & Holmlid, Reference Olofson and Holmlid2012b). On metal surfaces, the superfluid layer may be more than one monolayer thick with the clusters standing vertically to the surface, while on polymer surfaces, the layer is thinner and the clusters lie on the surface (Olofson & Holmlid, Reference Olofson and Holmlid2012b). The sensitivity of D(-1) to the surface structure means that the number of MeV particles formed by laser-initiated processes varies strongly with carrier material of the laser target (Holmlid, Reference Holmlid2013). Due to the special structure of D(-1), it interacts strongly with laser pulses of low intensity and gives Coulomb explosions (CE) in the clusters. Such processes with ejection of energetic particles take place at lower laser intensity than for ordinary materials (Badiei et al., Reference Badiei, Andersson and Holmlid2010b).
EXPERIMENTAL
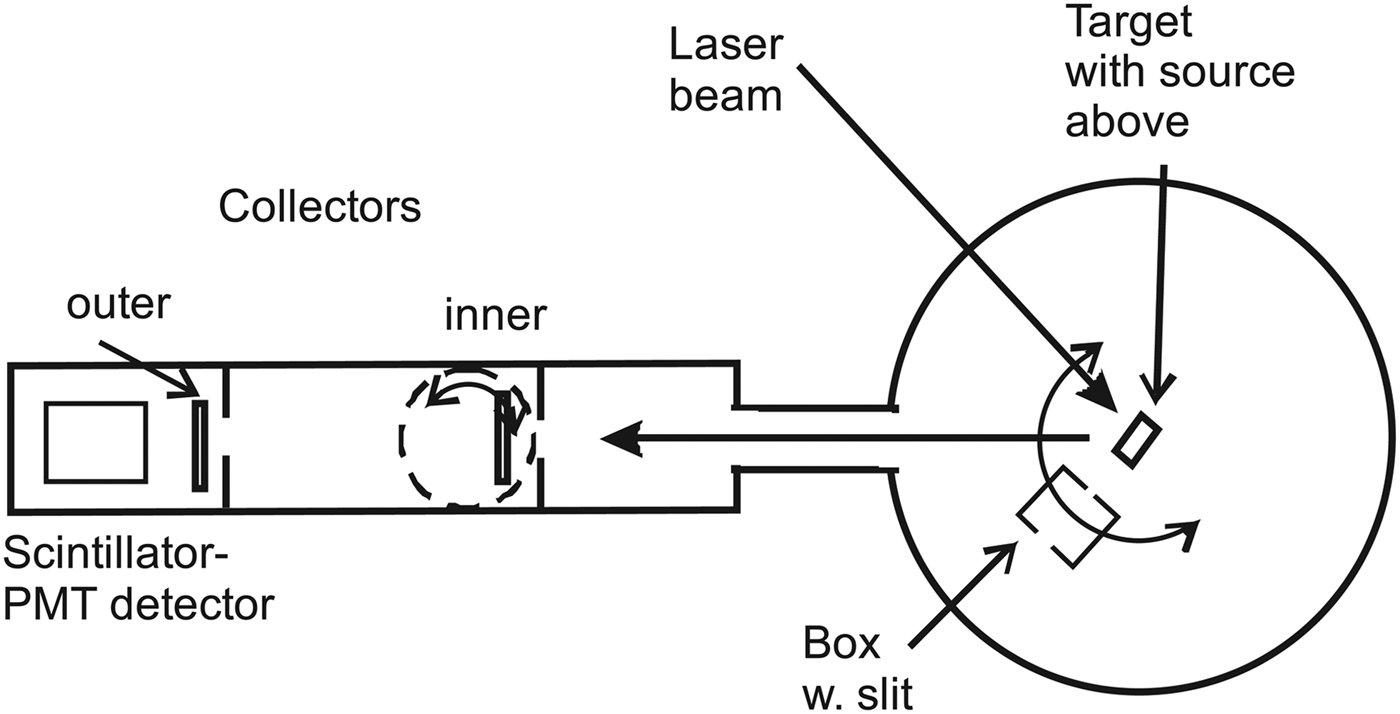
The layout of the experiment is shown in Figure 1. A Nd:YAG ns-pulsed laser is focused onto a metallic target plate with a thin superfluid layer of D(-1) (Andersson & Holmlid Reference Andersson and Holmlid2011). The focal length of the lens is 40 cm, giving a spot size of 30 µm (for a Gaussian beam) and a power density of <3 × 10¹² W cm−2. The laser is used with 532 nm light at maximum 200 mJ pulse energy, 5 ns pulse length. The particles from the target reach a collector plate at a distance of 64 or 103 cm from the target. The inner collector is easily rotated out from the beam. The signal from the collectors is measured by a fast digital two-channel oscilloscope (Tektronix TDS 3032, 300 MHz, risetime 1.7 ns) with no preamplifier. Digital averaging is used in all experiments. The “drop” source for producing D(-1) is described in the literature (Andersson et al., Reference Andersson, Lönn and Holmlid2011). In the source, a potassium doped iron oxide catalyst sample (Meima & Menon, Reference Meima and Menon2001; Muhler et al., Reference Muhler, Schlögl and Ertl1992) forms D(-1) from deuterium gas (99.8%) at a pressure close to 1 × 10⁻⁵ mbar. This porous catalyst is a plug that fills the opening of the gas feed tube 1–2 cm above the laser target.

Fig. 1. Horizontal cut through the apparatus, not to scale. The box in the central part is movable and has an entrance slit 3 mm wide at a distance of 74 mm from the target while the exit slit is much wider. The distance from the target to the inner collector is 64 cm, and to the outer collector 103 cm. Both collectors can be rotated out of the beam. The target-scintillator distance is 112 cm.
The experiment is performed using a slanting (45° against the vertical) laser target. The target faces the laser beam, with 45° angle between the laser beam and the beam to the collectors and the detector which are all in the vertical plane. The flux to the collector is taken out at 60° toward the surface normal of the target. The collectors are stainless steel plate rings with diameter 53 or 80 mm and a central opening centered behind an annular plate with central opening of 38 mm diameter. The collectors are covered by 30 µm Al foil. A tube with inner diameter 38 mm approximately half-ways between the target and the collector restricts the flux from the target to the collectors. The trigger is from a photodiode (BPW34) close to the laser with a 5 V supply. A capacitor is used for coupling out the fast NIM-type trigger pulse (Nuclear Instrumentation Module standard, at –0.9 V). The diode pulse rise-time is 7 ns on the oscilloscope. The trigger point is at the rise of the signal from the photodiode, at a low level relative to the peak of the trigger pulse. The coaxial cable is 2.95 m long. This length is the same as the distance travelled by the laser light from the trigger diode into the vacuum chamber to the target and from there to the collector. Since the speed of the signal in the RG58 type cable is 66% of the speed of light in vacuum, the trigger signal is delayed by 3 ns relative to the direct light beam. However, the signal cable to the oscilloscope also introduces a delay of approximately 5 ns, so the trigger gives the zero time quite accurately. No preamplifiers giving further delays are employed. The timing has an uncertainty less than 5 ns. The two-collector measurements presented here indicate that the trigger is 5 ns late, in approximate agreement with the cable delays.
In some experiments, another detector with a fast plastic scintillator and a fast photomultiplier (PMT) is used to study the signal flux. It is in the same direction behind the collectors as seen in Figure 1, and at a distance of 112 cm from the laser target. This detector has been used to measure 50 MK thermal distributions of particles in previous laser-induced experiments (Andersson & Holmlid, Reference Andersson and Holmlid2012b). The detection probability for thermal neutrons is low. The collectors can be rotated out from the beam giving free passage for the particle beam. The inner collector is used as a beam-flag to stop or delay the particles in the beam to the scintillator-PMT detector. The construction of the beam-flag and of the second detector is published (Holmlid, Reference Holmlid2012a; Olofson & Holmlid, Reference Olofson and Holmlid2012a). In the main vacuum chamber, a steel-plate box with a narrow slit (3 mm wide) can be rotated to analyze the flux to the detectors. The slit is at 73 mm distance from the center of the target. Its most important function here is that different parts of the target can be observed by moving the box with its slit in the flux from the target. The box can also be rotated out from the particle beam as shown in Figure 1.
RESULTS
The signal to the inner collector is analyzed by attaching a 24 V shielded battery in the signal path at the apparatus, still with 50 Ω input at the oscilloscope. The signals obtained are shown in Figure 2, with the battery reversed, giving +24 V or –24 V bias on the collector. Two different positions of the analyzing slit are used, as indicated in the figure, with the slit at maximum transmitted signal or with the slit moved out of the beam. We here concentrate on the rise and peak of the signals, since these are the parts where MeV particles are observed. With a negative bias, any low-energy electrons either from the target or emitted from surrounding walls by ionizing photons cannot reach the collector. (Electrons directly from the target are excluded in separate measurements, see below). Thus, the main signal with negative collector is due to particles partly in ionic form, and to electrons emitted from the collector itself, as secondaries due to the particles or as photoelectrons from ionizing photons reaching the collector. The secondaries due to the particles will have a time variation similar to the particle flux, so these two contributions can be treated together as a (slightly amplified) particle signal. So the only fast contribution to the signal with negative collector that is not due to fast particles is the emission of electrons from the collector due to ionizing photons (x-ray and similar) from the laser-created plasma on the target in the central chamber. This type of signal may be fast, giving a signal at very short times, of the order of the laser pulse-length.

Fig. 2. (Color online) Signals to the inner collector with a 24 V battery in the cable to the 50 Ω oscilloscope input. Panel (a) is the signal when the collector is positive and attracts negative charges, while panel (b) shows the signal when the collector is negative and repels electrons, also those ejected from the collector by impact of heavier particles. The curves with the slit at maximum signal are shown, and the unmarked curves (black) are measured with the slit moved out from the beam. The times given are from the zero indicated. Cu laser target.
The first signal observed in Figure 2, both with positive and negative collector, starts at 9–10 ns from the zero. When the collector is positive, an electron emission from the collector by impinging photons is not possible (or only possible with a low probability). Thus, the first signal rise in Figure 2 which is the same with positive and negative collector cannot be due to photons. Thus, it is due to fast particles. When the collector is positive, electrons from the surrounding walls (emitted by photons and particles) will give a negative signal which is seen in Figure 2 to overtake the positive signal due to particles, giving the negative maximum at 20–30 ns. This delay of 20–30 ns may be due to the drift time of the low-energy electrons from the walls to the collector.
With the slit in place and negative collector in Figure 2, the signal peak is considerably smaller than with no slit. The signal observed at times shorter than 15 ns (corresponding to 10 MeV u−1 particles) does not change with slit position, indicating a fast signal which moves centrally to the collector. The decrease of the peak centered at 19 ns is apparently caused by the removal and delay of such slower particles by interaction with the thin foil forming the slit. This can be seen from the reversal of the signal difference between the cases with slit and without slit in the figure, showing a delay of the particle flux in the peak. On the other hand, with the slit in place and positive collector, the signal is more positive over the whole time range than without the slit, showing that this effect is caused by a blocking of some of the ionizing photons by the slit, giving less electron current from the surroundings to the collector. The main conclusion from the times indicated in Figure 2 is that the signal starts at 9-10 ns corresponding to <20 MeV u−1 and has the main peak at 19 ns after the trigger, thus at 6 MeV u−1.
The energy of the particles is even better determined by using two-collector measurements in Figures 3 and 4. In these figures, the directly and simultaneously measured signals to the two-collectors in-line at 64 and 103 cm distances are shown in the top panels. In the bottom panels, the time-scale for the outer collector is recalculated by the factor 64/103 which is the ratio of the two collector distances. That means a direct comparison of the particle signals at the inner collector distance. Both measured time-scales are also shifted by –5 ns, which gives an improved matching of the distributions. A small contribution of photons is observed in both experiments, being too early after the rescaling of the outer collector signals. The ripples on the outer collector signals are caused by bad impedance matching due to the mechanical construction. These results show conclusively that the signals are due to massive particles moving from the target to inner collector and then to the outer collector. The energy of this particle flux is from 1 MeV u−1 to 20 MeV u−1. Only a small contribution from photons ejected during the laser pulse is observed in the figures. However, some photons emitted at 10–30 ns after the laser pulse may be unidentified within the particle distribution. Thus, MeV particles with 1–20 MeV u−1 are observed with certainty.

Fig. 3. (Color online) Two-collector measurements with –24 V collector bias. The directly measured signals are in the upper panel. In the lower panel the time-scale for the outer collector signal is recalculated by the ratio of the distances 64/103. Both original time-scales are also shifted by –5 ns to optimize the matching of the curves. Observe the small photon signal which does not shift as the particle signal. Ta target.

Fig. 4. (Color online) Two-collector measurements with zero collector bias. The directly measured signals are in the upper panel. In the lower panel the time-scale for the outer collector signal is recalculated by the ratio of the distances 64/103. Both original time-scales are also shifted by –5 ns to optimize the matching of the curves. Observe the small photon signal which does not behave as the particle signal. Ta target.
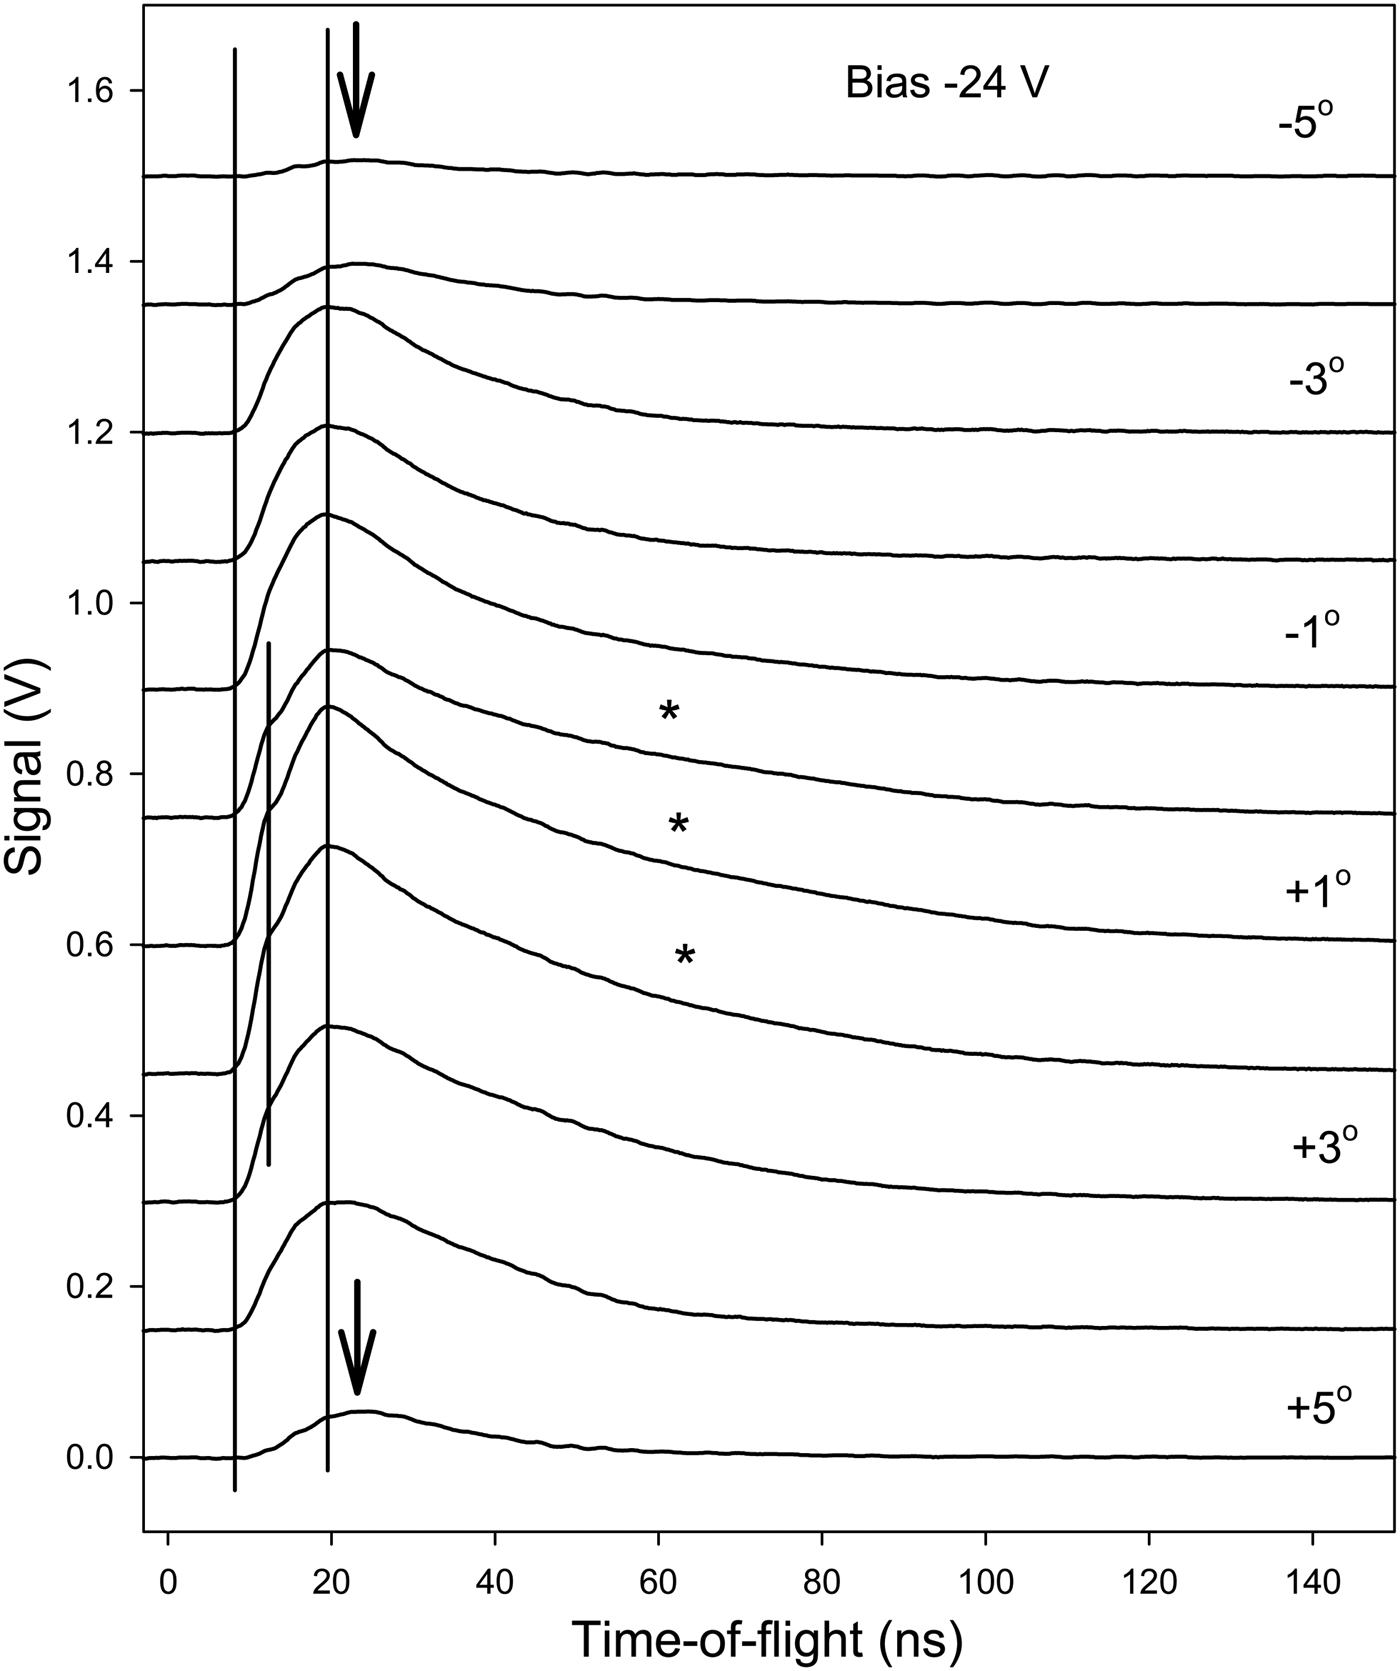
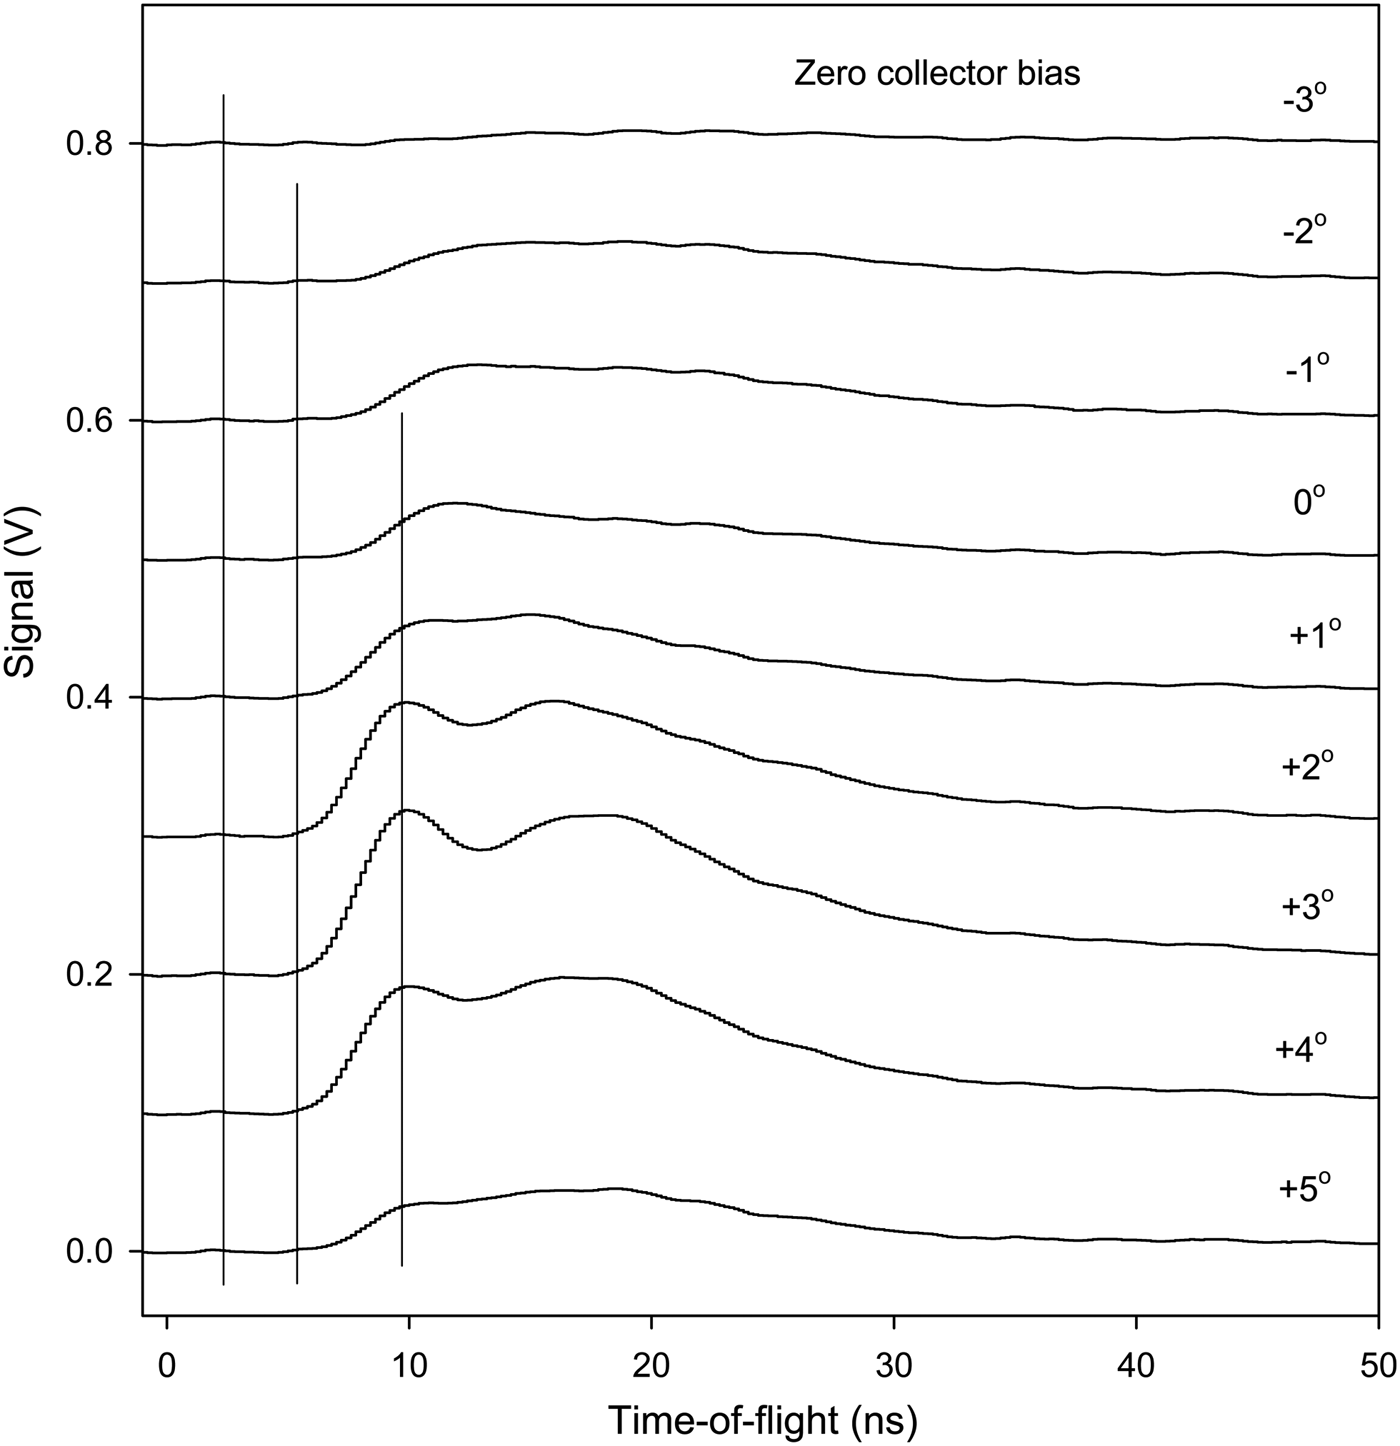
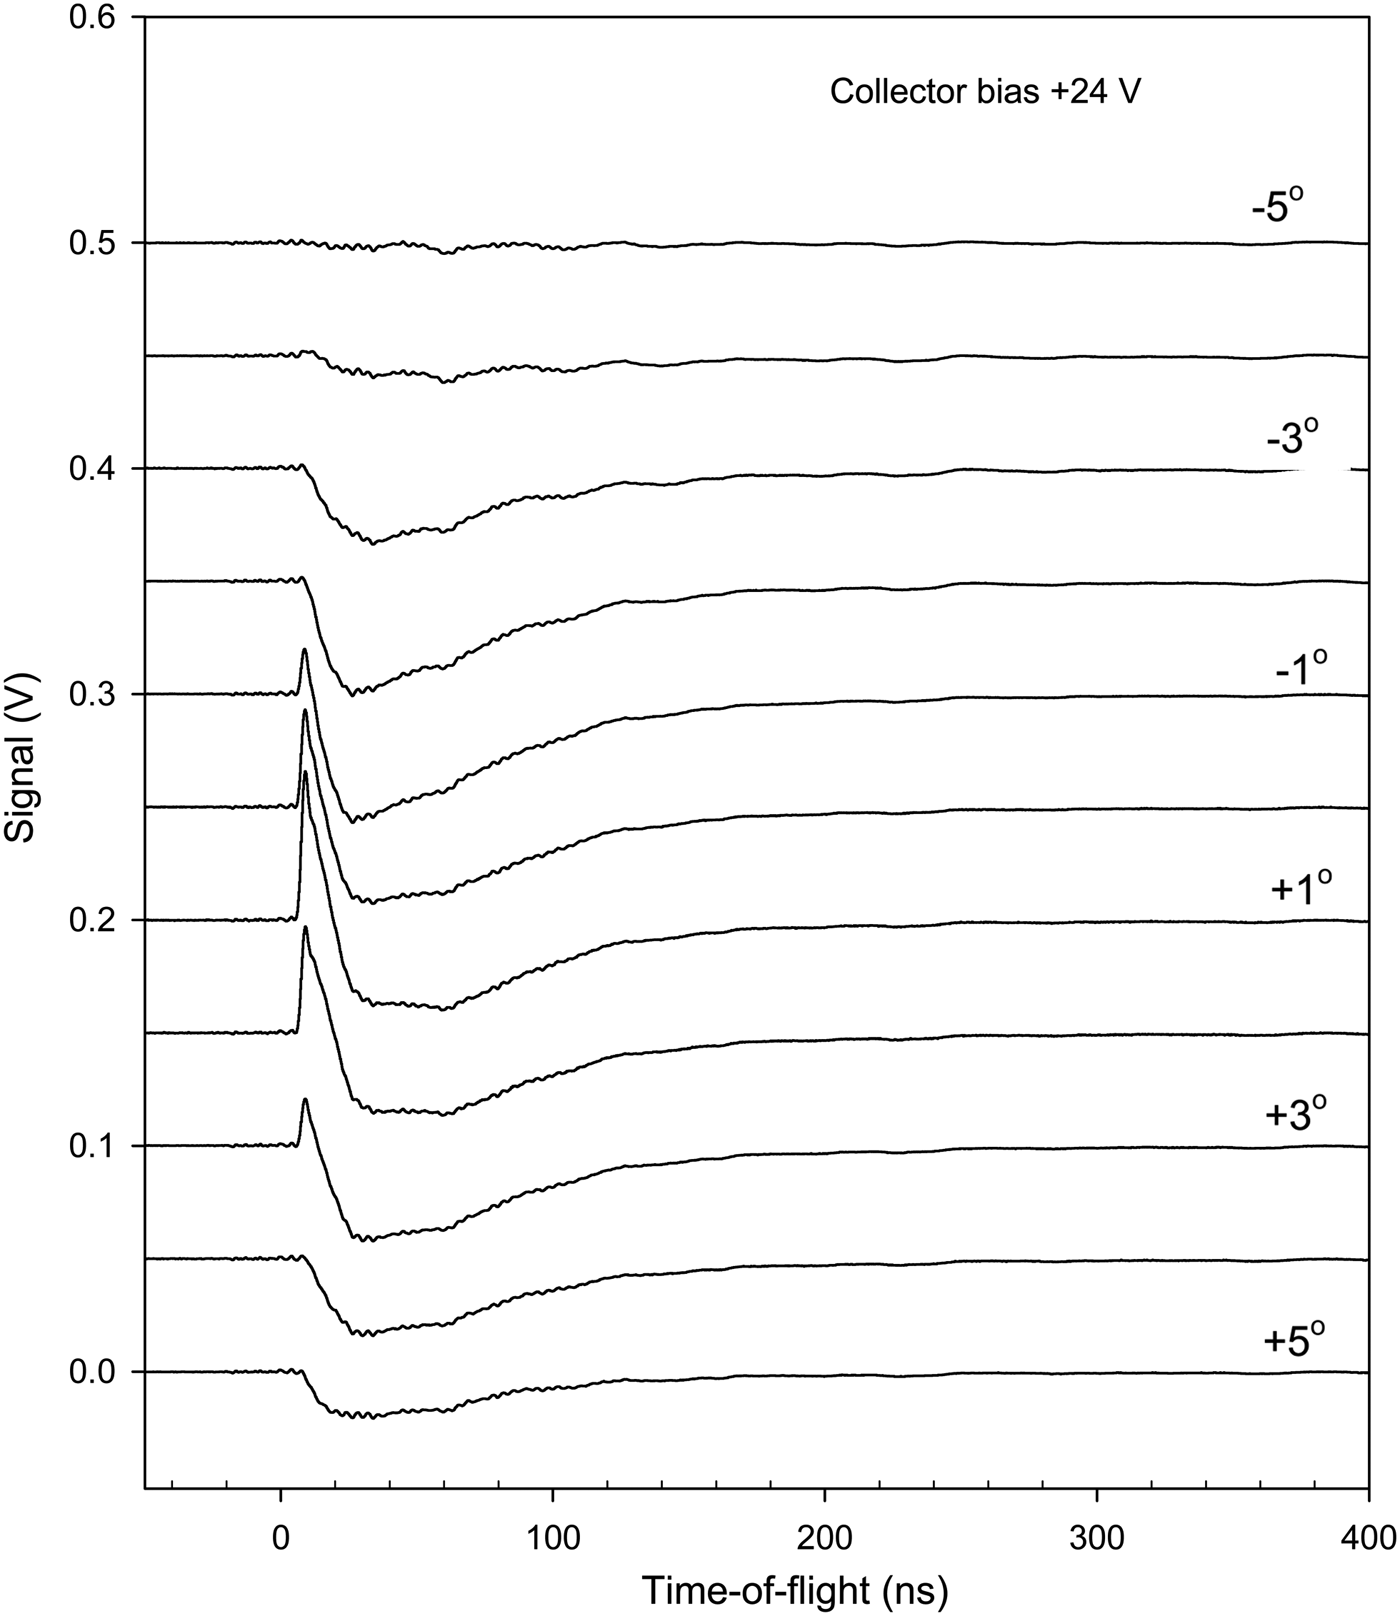
Further results on the particle signal at the inner collector have been obtained by moving the position of the inner slit. In Figure 5, typical results are shown with negative bias, in Figure 6 with zero bias, and in Figure 7 with positive bias. Different target surface materials are used to illustrate the generality of the features observed. The main behavior of the signals is as that in Figures 2 to 4. However, at the extreme positions of the slit in Figure 5, the inner-slit box structure blocks the particle flux strongly, giving much lower intensity and also a clear delay of the fastest particles at 12–15 ns. With the slit in the central position, the highest intensity is observed in the 0°– +3° range and a bump at 15 ns is clearly observed. At these central angles, the tail of the peak is also more extended than at other positions of the slit. This effect is indicated by stars in the figure. It may be due to electrons released by photons reaching the collector. The conclusions from Figure 6 are similar. The peak at 10 ns may be due to photons emitted during the laser pulse. They are blocked at large angles of the slit-box. With positive collector bias in Figure 7, the first positive peak attributed to fast particles in Figure 2 is correctly blocked by the slit at non-central angles. The negative electron signal is more extended in angle. It was attributed above to photon- and particle-released electrons from the surroundings of the collector, which agrees with the slit experiments in Figure 7.

Fig. 5. Collector signals with –24 V bias on the collector as a function of the inner slit position. The angles to the right indicate the angle relative to the nominal maximum transmission position of the slit. The vertical lines indicate the start of the signal and the maxima. The arrows indicate the shift of the maximum at large angles with low transmitted signal. The stars indicate long slopes of the signals. Ni target.

Fig. 6. Collector signal with zero bias on the collector as a function of the inner slit position. The angles to the right indicate the angle. The vertical lines indicate the start of the signal and the maxima. Ta target.

Fig. 7. Collector signal with +24 V collector bias as a function of the inner slit position. The angles to the right indicate the angle relative to the nominal maximum transmission position of the slit. Ti target.
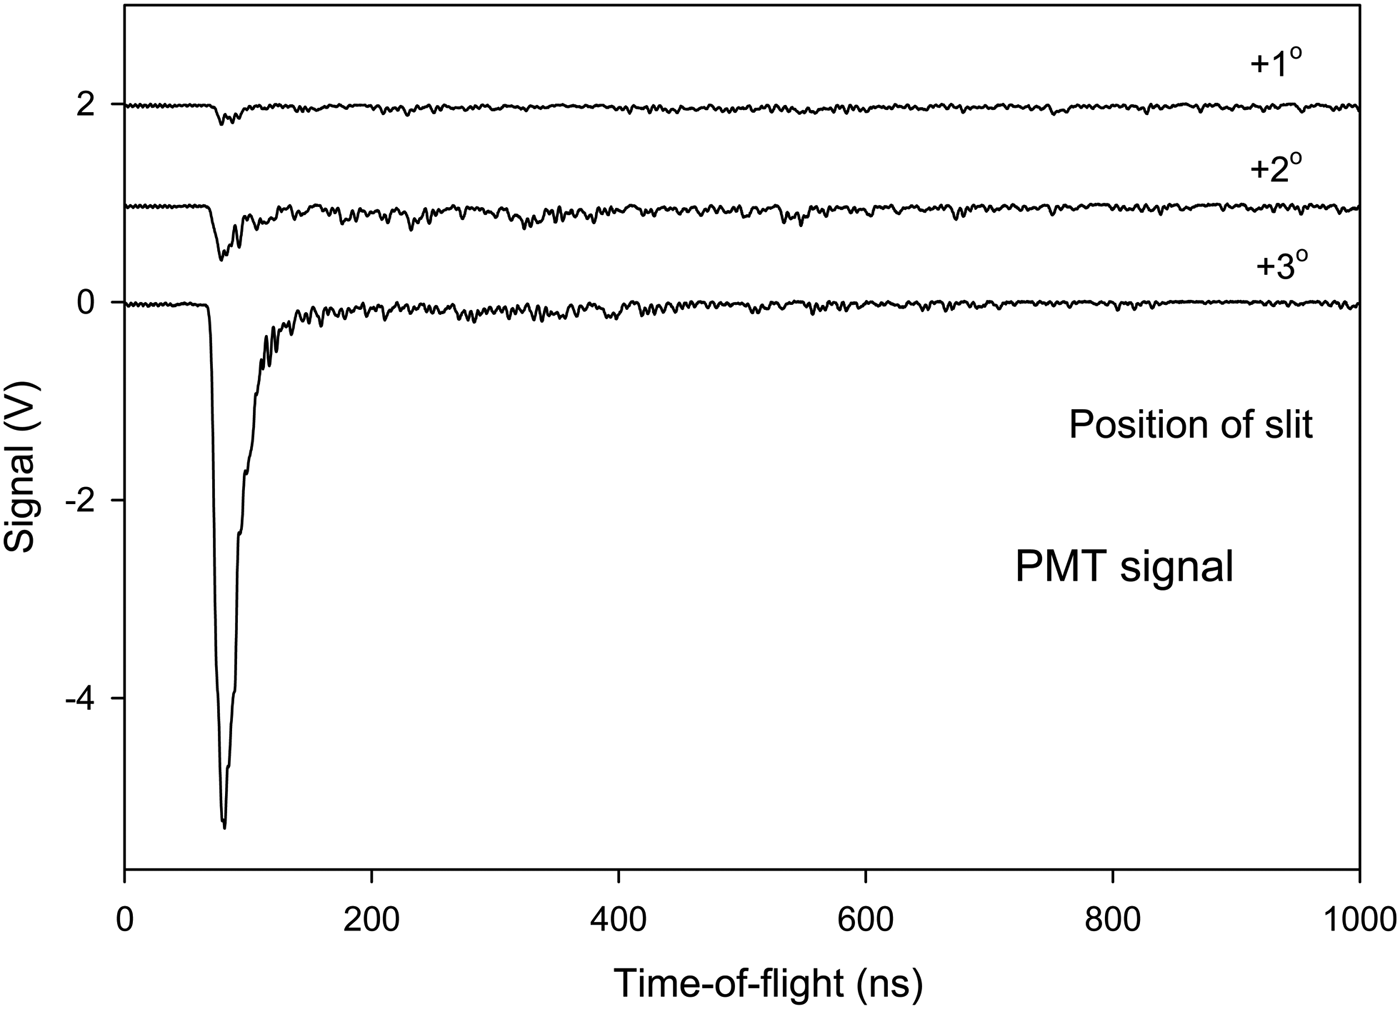
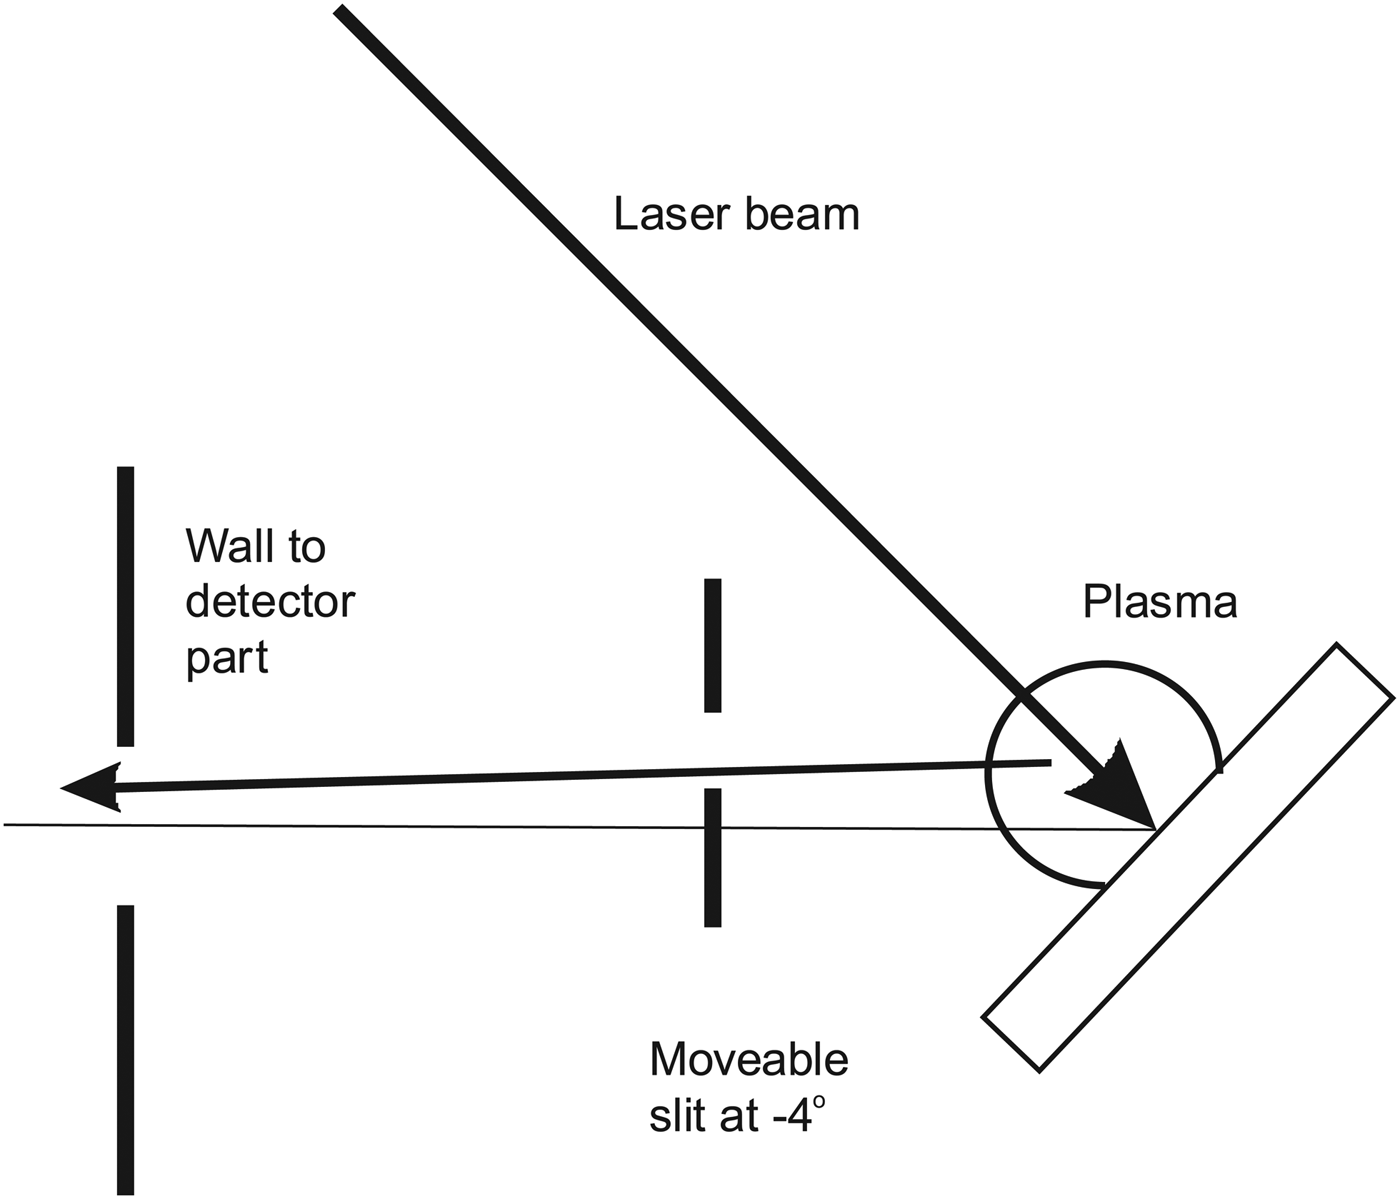
The signal to the scintillator-PMT detector shows clearly that the signal from the laser focus on the target is due to fast particles. Spectra obtained vary strongly in intensity with slit position and TOF and thus a full set of results as in Figures 5 to 7 requires several figures and is not included here. See similar results in Holmlid (Reference Holmlid2012a) and Olofson and Holmlid (Reference Olofson and Holmlid2012a). In Figure 8, the signal measured at a few angles is shown with the inner collector as a beam-flag for fast particles. At the central positions of the slit where the collector signal is at its maximum in Figure 5, almost no fast signal penetrating the beam-flag is observed. The results in Figure 8 are from the same experiment as in Figure 5 with unchanged conditions otherwise. At other slit positions as shown in one example in Figure 8, a high intensity signal is observed from photons which penetrate through the beam-flag, giving almost the same intensity with the beam-flag closed and open. Similar results are also shown in Figure 9. (This measurement has been done under slightly different conditions to avoid signal saturation in the PMT or its preamplifier thus retaining the time resolution.) Thus, at these slit positions the main signal observed is due to penetrating photons from the target plasma. The lay-out of the slit relative to the target and the plasma is shown in Figure 10. Thus, at a slit position of –4° the plasma contributes most of the signal, even if a few MeV particles pass the slit and are observed delayed at 200–500 ns in Figure 9. Further results of the same type are given in Holmlid (Reference Holmlid2012a) and Olofson and Holmlid (Reference Olofson and Holmlid2012a).

Fig. 8. TOF peaks in the scintillator-PMT detector with the beam-flag (the inner collector) in the beam (closed), at angles shown to give maximum transmission of the particle signal in Figure 5. Note that almost no particle signal passes undeflected through the collector at the central positions of the slit. Ni target.

Fig. 9. (Color online) TOF peaks in the scintillator-PMT detector signal at negative angles of the slit, thus mainly observing the plasma. Beam-flag (collector) position both closed and open (out from the beam). The signal is mainly due to photons which penetrate the beam-flag. A low-intensity delayed particle signal is also observed. Al target.

Fig. 10. Principle of the selection of flux to the detectors by the movable slit (box) at the target. In the position shown, particles from the point of laser impact have to penetrate the steel slit edge giving a delayed signal. Photons from the plasma are observed by the detectors on-line.
Several tests have been made to ascertain that no fast electrons directly from the target are involved in the signal to the collectors. A strong electric field from a –7 kV supply was used (inside the closed box with the slit) when the beam to the collector passed through the box, with no signal change. A few small strong permanent magnets were attached to the apparatus midways to the collector, at a distance of 2 cm from the beam, with no signal change. Internal strong magnets were used for deflection experiments of the ions in the beam, with unchanged behavior of the particle TOF signals (to be published). These tests make it certain that no electrons move from the target to the collectors and influence the signal observed. Besides, electrons with velocity corresponding to the observed TOF distributions will be strongly deflected in the geomagnetic field.
DISCUSSION
To conclude that particles with >10 MeV u−1 energy are observed, it is necessary to ascertain that the timing used to determine the TOF is correct, and that neither photons nor electrons give the signals observed. The measurements of the timing have been described above and it was concluded that the TOF timing was accurate within a few ns. The two-collector experiments in Figures 3 and 4 indicate that the trigger is 5 ns late, which gives even higher particle energies than concluded from some experiments shown here. Thus, the timing is correct or on the conservative (low energy) side.
The tests described in the Results section exclude any contributions to the signals from fast electrons from the target. Slow electrons, ejected by the impact of ionizing photons from the walls and other parts surrounding the collector, contribute to the signals observed with positive collector bias for example in Figures 7. However, they are not observed with zero or negative bias in Figures 5 and 6. The direct interaction of the photons with the collector must also be considered. The initial photon pulse from the laser-induced process at the target should give ejection of electrons from the collector. The electrons ejected may give a positive signal with negative collector. With positive collector, a smaller signal will be observed since the electrons will be retained by the positive voltage. However, if the slit is moved to mainly observe the photon signal with the scintillator-PMT detector as in Figure 9, the photon pulse is easily observed. It is also seen directly from such results that most initial pulse photons pass through the collector Al foils and do not interact strongly with the foils. Thus, the contribution to the fast collector signals from energetic photons is small also due to this effect.
The collector signals thus show clearly that MeV particles with several MeV energy, up to 20 MeV u−1 are ejected from the laser target. The particles ejected are probably fragments of the ultra-dense hydrogen H(-1) layer that exists on the target surface, containing both deuterons and protons. These fragments will behave similar to protons in many respects (range in materials etc.) but are mainly neutral. This is shown in magnet deflection experiments (to be published). It is not expected that neutrons will be observed in the collector signal due to their weak interaction with the Al collector material.
A discussion of the absolute signal observed should also include a discussion about the secondary electron emission coefficient for the impact of MeV protons on a metal collector surface like Al used here. Such data exist in the literature (Park & Jang, Reference Park and Jang2007; Borovsky et al., Reference Borovsky, McComas and Barraclough1988; Thornton & Anno, Reference Thornton and Anno1977). The coefficient is smaller than unity for the energy range of interest and thus the signal observed with negative collector should be less than twice as large as the true particle signal, which is similar to the signal found with the collector at ground potential. The total charge observed at the inner collector is up to 3 × 10⁻¹⁰ As or 2 × 10⁹ ions per laser shot. The exposed collector area corresponds to 2 × 10⁻⁴ of the full sphere, which gives a total charge ejected of 1.5 × 10⁻⁶ As or 1 × 10¹³ ions per laser shot assuming isotropic ejection of the particles. That this value is considerably higher than the previous value given in Holmlid (Reference Holmlid2012a) is due to the actual small viewing factor in these earlier scintillator and PMT based measurements, which was difficult to estimate correctly. If this charge is due to average particle energy of 3 MeV (lower than the peak values in the figures shown here), the total energy in the ejected protons is 4.5 J per laser shot. Assuming that the particles detected are not protons but that they are heavier than protons (as indicated by other experiments, to be published) means that the energy observed is correspondingly larger. Thus, the most conservative (lowest) estimate is that all the particles are protons. This means that the laser-induced process shows an energy gain from the laser pulse-energy of 0.12 J to >4 J, thus a gain of at least 30. The observed peak signal current is 8 mA, which corresponds to 16 A in the peak, assuming isotropic ejection. The observation of multi-MeV particles indicates nuclear fusion, either as a source or as a result.
CONCLUSIONS
It is shown that massive particles are ejected with energies 1–20 MeV u−1 by pulsed laser impact on a layer of ultra-dense deuterium D(-1). Direct signal collection by metal collectors at up to 1 m distance is used. Conclusive results are found directly by two-collector experiments. Electron and photon contributions to the fast signals are identified and found to be small. Peak currents of particles up to 8 mA are observed, corresponding to a total ejected current of 16 A assuming isotropic emission. The total energy in the particles ejected is >4 J, assuming isotropic formation, thus much larger than the laser pulse-energy. The observation of many-MeV particles indicates nuclear fusion, either as a source or as a result.


