Introduction
Panic disorder (PD) is a frequent psychiatric disease. According to epidemiological studies, 6-month prevalence rates run to 1% (Regier et al. Reference Regier, Boyd, Burke, Rae, Myers, Kramer, Robins, George, Karno and Locke1988). The aetiology of PD is unknown, although extensive research during the past two decades has revealed numerous neurobiological abnormalities possibly involved in the pathogenesis of the disease. Review articles have suggested that abnormalities in similar circuits may be involved in the pathophysiology of PD, as is the case with conditioned fear responses in animals (LeDoux, Reference LeDoux1996; Coplan & Lydiard, Reference Coplan and Lydiard1998). Gorman et al. (Reference Gorman, Kent, Sullivan and Coplan2000) proposed the existence of a ‘fear network’ in the brain that is centred in the amygdala and interacts with the hippocampus, temporal lobe and medial prefrontal cortex.
The temporal lobe is thought to play a major role in the pathophysiology of PD due to functional alterations reported in several electroencephalographic (EEG) and functional neuroimaging studies. Subjects suffering from PD demonstrated an increase in focal temporal lobe EEG abnormalities (Dantendorfer et al. Reference Dantendorfer, Prayer, Kramer, Amering, Baischer, Berger, Schoder, Steinberger, Windhaber, Imhof and Katschnig1996; Bystritsky et al. Reference Bystritsky, Leuchter and Vapnik1999). In accordance with these results, positron emission tomography (PET) and single photon emission computerized tomography (SPECT) studies have found abnormalities in blood flow and metabolism of the hippocampus, parahippocampus and temporal lobe (Reiman et al. Reference Reiman, Raichle, Robins, Butler, Herscovitch, Fox and Perlmutter1986; Nordahl et al. Reference Nordahl, Semple, Gross, Mellman, Stein, Goyer, King, Uhde and Cohen1990; Bisaga et al. Reference Bisaga, Katz, Antonini, Wright, Margouleff, Gorman and Eidelberg1998) in patients with PD. Besides these functional alterations, structural abnormalities of the temporal lobe have also been reported. Earlier magnetic resonance imaging (MRI) studies were based on qualitative assessment methods (e.g. visual estimation by a radiologist) without volume assessment of distinct structures. Ontiveros et al. (Reference Ontiveros, Fontaine, Breton, Elie, Fontaine and Dery1989) and Fontaine et al. (Reference Fontaine, Breton, Dery, Fontaine and Elie1990) reported various structural brain abnormalities, with right temporal lobe atrophy being the most frequent finding. Dantendorfer et al. (Reference Dantendorfer, Prayer, Kramer, Amering, Baischer, Berger, Schoder, Steinberger, Windhaber, Imhof and Katschnig1996) reported focal atrophy of different cortical areas (e.g. temporal and frontal lobes).
Until now, only three volumetric MRI studies have been performed in PD, all focusing on the temporal lobe and related structures. Vythilingam et al. (Reference Vythilingam, Anderson, Goddard, Woods, Staib, Charney and Bremner2000) reported a bilateral decrease in temporal lobe volume in patients compared to healthy controls. The hippocampi were normal. Massana et al. (Reference Massana, Serra-Grabulosa, Salgado-Pineda, Gasto, Junque, Massana, Mercader, Gomez, Tobena and Salamero2003b) found normal temporal lobe and hippocampus volumes, whereas they described bilateral amygdalar atrophy. Uchida et al. (Reference Uchida, Del-Ben, Santos, Araujo, Crippa, Guimaraes and Graeff2003) reported a decrease of the left temporal lobe. Unfortunately, the results of these volumetric MRI studies are inconsistent and there is only one study that has applied a more advanced approach: Massana et al. (Reference Massana, Serra-Grabulosa, Salgado-Pineda, Gasto, Junque, Massana and Mercader2003a) reported decreased grey matter (GM) density of the parahippocampal gyrus as a result of a voxel-based morphometry (VBM) study.
Parts of the frontal lobe, according to Gorman et al. (Reference Gorman, Kent, Sullivan and Coplan2000), are also hypothesized to be implicated in the proposed ‘fear network’, with altered function in PD. The medial frontal cortex, including the anterior cingulate and the medial orbitofrontal cortex, is thought to exert control over the amygdalar function in the form of a ‘top-down’ mechanism (Kent & Rauch, 2000). There is evidence from preclinical studies that reciprocal projections between the dorsal and ventral medial prefrontal cortex, on the one hand, and the amygdala, on the other, play a crucial role in attenuating fear responses and extinguishing behavioural responses to fear-conditioned stimuli if they are no longer reinforced (Morgan & LeDoux, Reference Morgan and LeDoux1995; Quirk et al. Reference Quirk, Russo, Barron and Lebron2000). The involvement of different regions of the frontal lobes in humans with PD has also been demonstrated by several functional neuroimaging studies (e.g. Bystritsky et al. Reference Bystritsky, Pontillo, Powers, Sabb, Craske and Bookheimer2001; Boshuisen et al. Reference Boshuisen, Ter Horst, Paans, Reinders and den Boer2002).
To our knowledge, quantitative volumetric MRI studies of the frontal lobe have not yet been performed in patients with PD. In light of this, two early studies based on qualitative assessment methods have provided important results: Dantendorfer et al. (Reference Dantendorfer, Prayer, Kramer, Amering, Baischer, Berger, Schoder, Steinberger, Windhaber, Imhof and Katschnig1996) were the first to describe atrophy of the frontal cortex. Wurthmann et al. (Reference Wurthmann, Bogerts, Gregor, Baumann, Effenberger and Döhring1997) reported bilateral enlargement of the frontal cerebrospinal fluid (CSF) spaces in PD on the basis of a qualitative computer tomography (CT) scan study.
The aim of our study was to examine possible alterations of the temporal and frontal lobe anatomy in PD by means of (1) quantitative volumetric MRI and (2) VBM. First, we performed the volumetric part of the study. VBM was introduced in a second step to test our a priori hypotheses and to localize the expected findings more precisely. Referring to prior studies, we hypothesized that the volumes of the temporal and frontal lobe would be reduced. Another structure of interest was the amygdala–hippocampus complex (AHC). With regard to the AHC, we were unable to formulate distinct hypotheses because the results of prior studies are inconsistent.
Method
Participants
Seventeen in-patients (nine women, eight men) with PD and 17 healthy volunteers matched for age and gender were assessed (mean age=34.9 years, s.d.=6.7 years, range 25–48 years). The mean duration of illness was 7.9 years (s.d.=5.2 years). Diagnosis was established using a symptom checklist according to DSM-IV criteria (abbreviated SCID interview) and confirmed by two clinical psychiatrists (T.S. and U.G.). According to the observer-rated Panic and Agoraphobia Scale (Bandelow, Reference Bandelow1995), patients had a mean score of 32.0 (s.d.=6.2) indicating a severe PD. Exclusion criteria were lifetime co-morbidity with mood disorders, substance-related disorders, obsessive–compulsive disorder, post-traumatic stress disorder, schizophrenia, delirium and dementia. Sixteen patients (94%) met criteria for agoraphobia, which is very common in patients with PD. According to recent literature, agoraphobia is thought to be closely related to avoidance behaviour, thus being part of the disease (Bandelow et al. Reference Bandelow, Hajak, Holzrichter, Kunert and Rüther1995). Therefore, agoraphobia was not considered as an exclusion criterion in the present study. Other co-morbid disorders were social phobia (6%), generalized anxiety disorder (6%), adjustment disorder with mixed disturbance of emotions and conduct (12%) and paranoid personality disorder (12%). The mean age of the control group was 33.1 years (s.d.=6.2 years, range 25–47 years). All patients and healthy controls were right-handed according to the modified version of the Edinburgh Handedness Inventory (Oldfield, Reference Oldfield1971). The study design was approved by the Ethics Committee of the University of Jena and all participants gave their written informed consent.
MRI acquisition
MRI scans were performed using a 1.5-T unit (Philips Gyroscan ACSII system; Germany). T1-weighted contiguous 1-mm-thick sagittal slices of the brain were obtained with the following parameters: repetition time (TR)=13 ms, echo time (TE)=5 ms, field of view=256 mm, in-plane resolution=256×256 voxels, flip angle=25°.
Quantitative volumetry
Image analysis
The imaging data were analysed using the CURRY program (distributed by Neuro Scan Inc., USA), which is a semi-automated volumetric approach. All measurements were made by two reliably trained and blinded raters (A.H. and K.S.). Inter-rater reliabilities (IRRs) were determined by intra-class correlation coefficients (ICCs). Structures of interest (and IRRs) were the following: right and left temporal lobes (0.991, 0.984), frontal lobes (0.998, 0.999) and the AHC (0.981, 0.980). The boundaries of the structures of interest were determined by reference to the Co-Planar Stereotaxic Atlas of the Human Brain (Talairach & Tournoux, Reference Talairach and Tournoux1988).
Statistical analysis
All statistics were performed using SPSS version 11.5 (SPSS Inc., USA). Prior to the statistical analysis, all structures of interest were divided by whole-brain volume to control for the influence of this factor (Free et al. Reference Free, Bergin, Fish, Cook, Shorvon and Stevens1995). To detect possible differences in transformed volume scores between groups, we first performed a mixed-effects MANOVA for all substructures with the between-subjects factor group (patients versus controls) and the within-subjects factor side (right and left sides). As groups were matched according to age and sex, no covariates were used. Follow-up univariate mixed-effects ANOVAs were performed to analyse specific structures of interest. Finally, planned post-hoc t tests were performed in addition to descriptive statistics to indicate the direction of differences.
VBM
Analysis of GM images
In the present study we used the VBM5 toolbox (http://dbm.neuro.uni-jena.de), which utilizes and extends the new unified segmentation approach implemented in Statistical Parametric Mapping 5 (SPM5; Ashburner & Friston, Reference Ashburner and Friston2005). Klauschen et al. (Reference Klauschen, Goldman, Barra, Meyer-Lindenberg and Lundervold2009) have compared three widely used software packages for the segmentation of MR brain volumes with each other. According to this study, SPM5, in comparison to Freesurfer and FSL, has the highest volumetric sensitivity and accuracy for GM and white-matter segmentation.
Unified segmentation provides a generative model of VBM preprocessing that integrates tissue classification, image registration and MRI inhomogeneity bias correction. We used SPM5 priors because we have not assumed that our sample shows large deviations from the International Consortium for Brain Mapping (ICBM) priors in SPM5. Furthermore, the VBM5 toolbox extends the unified segmentation model as it increases the quality of segmentation by applying a hidden Markov random field (HMRF) model on the segmented tissue maps (Bach-Cuadra et al. Reference Bach-Cuadra, De Craene, Duay, Macq, Pollo and Thiran2006). The HMRF algorithm provides spatial constraints based on neighbouring voxel intensities within a 3×3×3 voxel cube. It removes isolated voxels that are unlikely to be members of a certain tissue class and also closes holes in a cluster of connected voxels of a certain class, resulting in a higher signal-to-noise ratio of the final tissue probability maps.
The final tissue GM maps were modulated with the Jacobian determinants of the deformation parameters obtained by normalization to the Montreal Neurological Institute (MNI) standard space to analyse volume differences between study populations. We saved these modulated images, corrected for nonlinear warping, to conduct a subsequent statistical analysis with the modulated images, which were corrected for the confounding effect of different brain sizes. Finally, the modulated GM images were smoothed with a 12-mm full-width at half-maximum (FWHM) Gaussian kernel and entered in the statistical analysis.
Statistical analysis
Voxel-by-voxel one-way ANOVA was performed with the modulated GM images to test for differences between controls and patients with PD in regional GM volume. Only voxels with absolute GM values >0.20 were entered in the analysis, to avoid possible edge effects around the border between GM and white matter, and a predefined mask image that consisted of the frontal and temporal lobes and the AHC was applied, to test our a priori hypothesis and to present the volumetric results. All statistical images were thresholded at voxel-level p<0.001 (uncorrected for multiple comparisons) and the cluster extent was thresholded at a family-wise error (FWE) corrected threshold of p<0.05.
We also used the non-stationary cluster extent correction as implemented in the SPM toolbox (Hayasaka et al. Reference Hayasaka, Phan, Liberzon, Worsley and Nichols2004). Non-stationarity occurs due to non-isotropic (non-uniform) smoothness of VBM data. Because cluster size distribution varies depending on local smoothness, clusters tend to be large in smooth areas and small in rough ones. This leads, in VBM in particular, to invalid cluster size statistics and to cluster sizes being misestimated. The combined peak-level and cluster-level inference used, that is the number of activated voxels comprising a particular connected subset, provided a combination of conservative protection against false positives at the p<0.05 corrected level and sufficient power to detect GM volume differences.
Results
Quantitative volumetry
Uncorrected volumes of the structures of interest are given in Table 1. The whole-brain volume of patients with PD and normal controls did not differ significantly (1097.17±80.85 v. 1071.01±131.88 cm3). After correction for whole-brain volume, mixed-effects MANOVA revealed significant effects of group [Wilks' λ=0.63, F(5, 28)=3.23, p=0.019] and of side [Wilks' λ=0.25, F(5, 28)=16.78, p<0.001], but no significant group×side interaction. Follow-up univariate mixed-effects ANOVAs revealed a significant group effect for the temporal lobe [F(1, 32)=12.42, p=0.001], indicating decreases in whole-brain corrected volumes of the left [t(32)=2.27, p=0.03] and right [t(32)=3.51, p=0.001] temporal lobes in patients. There was no significant group effect for the AHC (see Table 2). We found a significant group effect for the frontal lobe volume [F(1, 32)=4.89, p=0.034]. The planned t test revealed a significant reduction in the right frontal lobe volume [t(32)=2.32, p=0.02] in patients with PD. The changes in the temporal and frontal lobes are shown in Figs 1 and 2. In addition, there was a significant main effect of side for the frontal [F(1, 32)=7.93, p=0.008] and temporal [F(1, 32)=7.23, p=0.01] lobes and the AHC [F(1, 32)=13.06, p=0.001]. Pair-wise t tests revealed that these structures had a greater volume on the right than on the left side in both groups. As indicated by the MANOVA, we found in the follow-up ANOVAs no significant group×side interactions.
Fig. 1. Decrease in temporal lobe volume in patients with panic disorder (□) versus healthy control (![]() ) subjects. The difference between groups was more pronounced on the right side.
) subjects. The difference between groups was more pronounced on the right side.
Fig. 2. Reduction in right frontal lobe volume in patients with panic disorder (□) versus healthy control (![]() ) subjects. The volume of the left frontal lobe also seems to be reduced, but this effect is not statistically significant (0.05<p<0.1).
) subjects. The volume of the left frontal lobe also seems to be reduced, but this effect is not statistically significant (0.05<p<0.1).
Table 1. Structures of interest (values not corrected for whole-brain volume)

AHC, Amygdala–hippocampus complex.
Values given as mean (standard deviation).
Table 2. Structures of interest (corrected for whole-brain volume)

AHC, Amygdala–hippocampus complex; n.s., not significant.
Values given as mean (standard deviation).
The calculation of Pearson's correlation revealed no association of age at onset or duration of illness with the cerebral alterations found in this study. These abnormalities therefore seem to be trait characteristics rather than state-dependent phenomena.
VBM
Testing the difference in GM volume between patients and healthy controls, we detected a significant GM volume reduction in the right middle temporal gyrus [Brodmann area (BA) 21: x=50, y=−15, z=−16, p (voxel-level)<0.001, k=1.56 cm3, p (cluster-level corrected)=0.01] in patients with PD, as shown in Fig. 3. Lowering the cluster-level threshold to the number of expected voxels per cluster, we detected an additional GM volume reduction in the medial part of the orbitofrontal cortex [BA 11: x=14, y=45, z=−20, p (voxel-level)<0.001, k=0.43 cm3, p (cluster-level corrected)=0.22; see Fig. 3). We did not observe any significant differences in the AHC and in the opposite contrast.
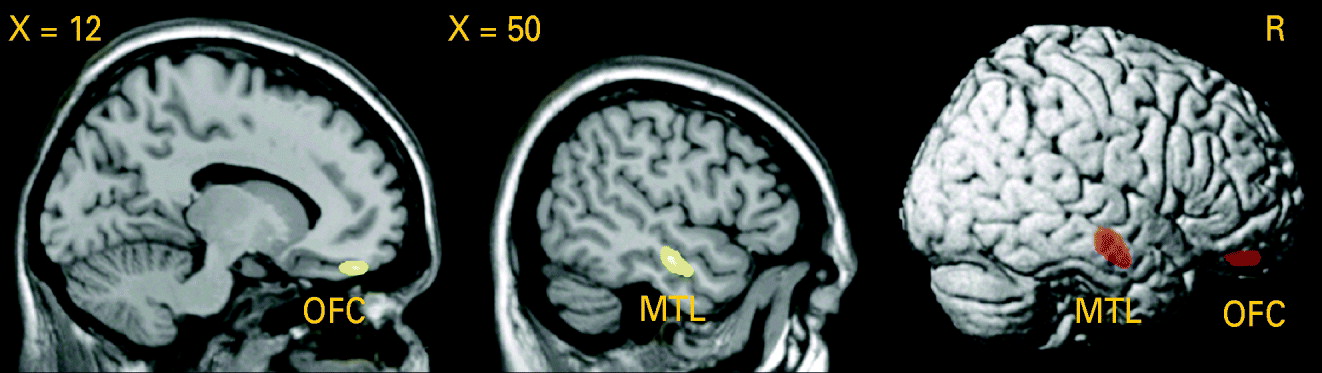
Fig. 3. Analysis using voxel-based morphometry (VBM): reduction of grey matter (GM) volume in patients with panic disorder (PD) relative to healthy controls (HC), voxel-level threshold: p<0.001 (uncorrected). Middle temporal lobe (MTL): p [cluster-level family-wise error (FWE) corrected]=0.01. Orbitofrontal cortex (OFC): cluster-level corrected according to the expected voxels per cluster.
When correlating the first eigenvariate (main component of the principal component analysis) extracted from the clusters of the significant GM difference in the middle temporal lobe and in the orbitofrontal cortex and the age at onset or duration of illness in patients with PD, there was a significant negative association between GM volume in the orbitofrontal cortex and the age at onset (r=−0.054, p=0.02).
Discussion
The major findings of this quantitative volumetric and voxel-based morphometric MRI study were: a bilateral decrease in temporal lobe volume and a decrease in right frontal lobe volume in patients with PD. By means of VBM we were able to assess the abnormalities more precisely and detected significant GM volume reductions in the right middle temporal gyrus (BA 21) and in the medial part of the orbitofrontal cortex (BA 11).
With regard to the temporal lobe, our findings confirm the results of Vythilingam et al. (Reference Vythilingam, Anderson, Goddard, Woods, Staib, Charney and Bremner2000), who reported a bilateral volume reduction in a quantitative volumetric MRI study. Our results are also partly in line with those of Uchida et al. (Reference Uchida, Del-Ben, Santos, Araujo, Crippa, Guimaraes and Graeff2003), who found a decline in the left temporal lobe volume. However, another working group encountered no change in the temporal lobe volume in PD (Massana et al. Reference Massana, Serra-Grabulosa, Salgado-Pineda, Gasto, Junque, Massana, Mercader, Gomez, Tobena and Salamero2003b). Our finding of normal AHC cannot be compared directly to the results of prior volumetric studies in which the hippocampus and the amygdala were assessed separately. Two of these studies found no changes in hippocampal volume in patients with PD (Vythilingam et al. Reference Vythilingam, Anderson, Goddard, Woods, Staib, Charney and Bremner2000; Massana et al. Reference Massana, Serra-Grabulosa, Salgado-Pineda, Gasto, Junque, Massana, Mercader, Gomez, Tobena and Salamero2003b). However, as the hippocampus forms a large part of the AHC, our findings are at least not contradictory to these results. Massana et al. (Reference Massana, Serra-Grabulosa, Salgado-Pineda, Gasto, Junque, Massana, Mercader, Gomez, Tobena and Salamero2003b) reported bilateral ‘atrophy’ of the amygdala in patients with PD. This finding, however, was not supported by a concurrently published VBM study by the same group (Massana et al. Reference Massana, Serra-Grabulosa, Salgado-Pineda, Gasto, Junque, Massana and Mercader2003a) or by the VBM data of our current study.
In this study VBM analysis revealed a significant GM volume reduction in the right middle temporal gyrus and enabled the quantitative volumetric findings to be localized more precisely. Normal VBM results on the opposite side may indicate that abnormalities in the left temporal lobe are less pronounced or less specific. This point of view is also supported by the quantitative volumetric data: a volume decrease of the temporal lobe had a higher level of statistical significance on the right side (p<0.001) compared to the left (p<0.03). When comparing quantitative volumetry and VBM, it should be taken into account that both methods deal with different measures of volume and therefore may provide inhomogeneous or even disparate results. However, consistent findings can be expected if the effects are robust and specific. Up to now only one VBM study has been published with patients suffering from PD. Massana et al. (Reference Massana, Serra-Grabulosa, Salgado-Pineda, Gasto, Junque, Massana and Mercader2003a), by means of SPM99, reported GM deficits in the left parahippocampal gyrus of patients with PD on the threshold corrected for multiple comparisons. When using uncorrected p values (p<0.001), GM deficits could also be observed in the right middle temporal gyrus, which is in agreement with the results of the present study.
The temporal lobe is thought to play an important role in the pathophysiology of PD because of abnormalities found in numerous functional neuroimaging studies. Several investigations performed by PET and SPECT have revealed changes in the regional cerebral blood flow (rCBF) and regional cerebral metabolic rate (rCMR) in the temporal lobes (Reiman et al. Reference Reiman, Raichle, Robins, Butler, Herscovitch, Fox and Perlmutter1986; Nordahl et al. Reference Nordahl, Semple, Gross, Mellman, Stein, Goyer, King, Uhde and Cohen1990; De Cristofaro et al. Reference De Cristofaro, Sessarego, Pupi, Biondi and Faravelli1993; Bisaga et al. Reference Bisaga, Katz, Antonini, Wright, Margouleff, Gorman and Eidelberg1998; Meyer et al. Reference Meyer, Swinson, Kennedy, Houle and Brown2000). In accordance with these observations, Gorman et al. (Reference Gorman, Kent, Sullivan and Coplan2000) postulated that predominantly structures of the medial temporal lobe (amygdala, hippocampus) are involved in the aetiology of PD. Adding to this, the results of our study may shed new light on temporal lobe dysfunction in PD as GM deficits occurred in a region involved in visual integration and contextual organization (BA 21; Kolb & Whishaw, Reference Kolb and Whishaw1996).
The frontal lobe in PD has not previously been investigated by quantitative volumetric MRI, although structural and functional neuroimaging studies have demonstrated striking abnormalities in this region. A decrease in right frontal lobe volume as assessed in this study is therefore a de novo finding, not comparable to any prior results. Subsequent VBM analysis revealed a significant GM volume reduction in the medial part of the orbitofrontal cortex. A possible reason that Massana et al. (Reference Massana, Serra-Grabulosa, Salgado-Pineda, Gasto, Junque, Massana and Mercader2003a) did not find any frontal lobe abnormalities is that they used a less advanced VBM approach based on SPM99.
The frontal lobe is thought to be involved in the aetiology of PD and abnormal cortical functioning in this brain region has been demonstrated by the results of several SPECT (Kaschka et al. Reference Kaschka, Feistel and Ebert1995; Kuikka et al. Reference Kuikka, Pitkanen, Lepola, Partanen, Vainio, Bergstrom, Wieler, Kaiser, Mittelbach and Koponen1995; Brandt et al. Reference Brandt, Meller, Keweloh, Hoschel, Staedt, Munz and Stoppe1998; Bremner et al. Reference Bremner, Innis, White, Fujita, Silbersweig, Goddard, Staib, Stern, Cappiello, Woods, Baldwin and Charney2000), PET (Nordahl et al. Reference Nordahl, Stein, Benkelfat, Semple, Andreason, Zemetkin, Uhde and Cohen1998; Boshuisen et al. Reference Boshuisen, Ter Horst, Paans, Reinders and den Boer2002; Kent et al. Reference Kent, Coplan, Mawlawi, Martinez, Browne, Slifstein, Martinez, Abi-Dargham, Laruelle and Gorman2005; Hasler et al. Reference Hasler, Nugent, Carlson, Carson, Geraci and Drevets2008) and functional MRI studies (Bystritsky et al. Reference Bystritsky, Pontillo, Powers, Sabb, Craske and Bookheimer2001; Maddock et al. Reference Maddock, Buonocore, Kile and Garrett2003). Different areas of the frontal lobe are hypothesized to be involved in the pathogenesis of PD (Gorman et al. Reference Gorman, Kent, Sullivan and Coplan2000). The role of the medial prefrontal cortex and the medial orbital prefrontal cortex in modulating anxiety and other emotional behaviours is well established. These regions share extensive reciprocal projections with the amygdala. Therefore, these areas are hypothesized to control amygdalar function and to restrain the generation of affects such as anxiety or panic. According to this model, a weakening of these influences may result in the release of abundant anxiety as occurs in PD (Charney, Reference Charney2003). The significance of ‘top-down governance’ of the orbitofrontal cortex in PD was demonstrated by Kent et al. (Reference Kent, Coplan, Mawlawi, Martinez, Browne, Slifstein, Martinez, Abi-Dargham, Laruelle and Gorman2005), who found that the baseline perfusion in this region predicted panic attacks during the performance of a PET study. ‘Hypofrontality’, in those patients who had a spontaneous panic attack, was described earlier in an iomazenil SPECT study (Bremner et al. Reference Bremner, Innis, White, Fujita, Silbersweig, Goddard, Staib, Stern, Cappiello, Woods, Baldwin and Charney2000).
Compared to prior investigations, our study has some methodological benefits: healthy control subjects were matched to patients with PD for age and gender. Our sample was larger than in the preceding studies and co-morbidity was low, although we investigated severely ill in-patients. In particular, the enrolment of subjects with affective disorders was ruled out because these patients may exhibit other brain abnormalities, as for instance a reduction of hippocampal volume (Sheline et al. Reference Sheline, Sanghavi, Mintun and Gado1999). In addition, the image resolution in our study was higher than in previous studies (slice thickness of 1 mm versus 3 mm/2 mm/1.2 mm) and may have favoured high inter-rater reliability. As a major advantage of our study, the volumetric results could be evaluated and defined more precisely by VBM analysis performed in the same sample. We also used an advanced VBM approach (VBM5 toolbox). However, it should be mentioned as a methodological limitation that, in the volumetric part of our study, the structures of the amygdala and hippocampus could not be assessed separately and were combined as the AHC. However, we could compensate for this limitation of the volumetric analysis by the voxel-wise VBM statistic, which is not dependent on anatomical landmarks and expertise about them.
Our results lend further support to current aetiological models of PD (Gorman et al. Reference Gorman, Kent, Sullivan and Coplan2000). Earlier observations of aberrant function of the orbitofrontal cortex in PD (Kent et al. Reference Kent, Coplan, Mawlawi, Martinez, Browne, Slifstein, Martinez, Abi-Dargham, Laruelle and Gorman2005) are substantiated and extended by our finding of a structural brain consequence of weakened ‘top-down governance’ of the orbitofrontal cortex in PD. With regard to the temporal lobe, as in most prior studies we did not find any abnormalities of the amygdala and hippocampus. Therefore, the important role of the medial temporal lobe in the pathophysiology of PD as it has been proposed could not be proved. However, our study revealed GM deficits in BA 21, a region that is involved in visual integration and contextual organization (Konen & Kastner, Reference Konen and Kastner2008). It might be that dysfunction in this area underlies psychopathological symptoms such as derealization and depersonalization, which often occur in PD. With this background, it is of interest that patients with DSM-IV depersonalization disorder exhibit lower metabolic activity in right BA 21 and 22 compared to normal controls (Simeon et al. Reference Simeon, Guralnik, Hazlett, Spiegel-Cohen, Hollander and Buchsbaum2000).
Nevertheless, the exact pathogenetic implications of the structural alterations remain unclear. The GM deficits in the medial orbitofrontal cortex and middle temporal gyrus as observed in our study proved to be correlated with age of onset but not with duration of illness. This result was unexpected. The structural abnormalities do not therefore seem to be a direct consequence of the disease process. As a possible explanation for this finding, it may be assumed that older individuals, when affected by PD, are more susceptible to neurostructural and neurofunctional abnormalities, possibly resulting in a more severe and chronic form of the disease. To answer these open questions, our findings need to be replicated by other VBM studies, and follow-up studies during the course of the disease should be performed.
Acknowledgements
This study was supported by a grant from the Thüringer Ministerium für Wissenschaft, Forschung und Kultur (Thuringian Ministry of Science, Research and Culture).
Declaration of Interest
None.