Introduction and motivation
The 20th century brought huge social and economic advancement for Europeans: increased longevity, better health and the adoption of pension policies designed to reduce the risk of financial poverty of older people. The public provision of health and social welfare also advanced extraordinarily. The downside of these developments has been the uncertainty of whether existing welfare states can afford and sustain this progress. Increasing numbers of people living longer have put inevitable strain on the affordability of welfare states, particularly on public pensions and health-care systems. Equally importantly, many in the new generation of older people, being healthier, can be seen to be contributing to their own wellbeing by adopting an active and healthy lifestyle.
The shock to economic systems caused by the economic crises after 2008/9 has now receded in the majority of European countries. Such a shock, combined with the longer-term challenges of population ageing, has affected the fabric of the European welfare state. The costs of looking after a growing number of older people raise serious concerns about the sustainability of current provisions of support, especially when there are competing claims on the limited resources of a country. Evidence is therefore required for public policy priorities when identifying individuals and their sub-groups who need to be targeted in promoting active-ageing outcomes. The study of an individual-level metric of active ageing undertaken in this paper is also motivated by these fundamental current-day societal challenges.
Active and healthy ageing means growing older in good health and as a full member of society, feeling more fulfilled in one's job and social engagements, more independent in one's daily life and more engaged as a citizen. Active ageing encompasses and interacts with several specific policy areas; it is about fostering employment, promoting engagement, reducing poverty, improving health and wellbeing, and much more (Boudiny Reference Boudiny2013; Paúl, Ribeiro and Teixeira Reference Paúl, Ribeiro and Teixeira2012; Stenner, McFarquhar and Bowling Reference Stenner, McFarquhar and Bowling2011; Walker Reference Walker2005; Zaidi et al. Reference Zaidi, Gasior, Hofmarcher, Lelkes, Marin, Rodrigues, Schmidt, Vanhuysse and Zolyomi2013). While at times these policies focus on specific goals, they must be cast in a broader approach that addresses all positive aspects of the lives of older people, most of which are brought together in the Active Ageing Index (AAI) project (see Zaidi and Stanton Reference Zaidi and Stanton2015). The active ageing index constructed as a result of this project provides only a snapshot of active-ageing experiences at the national level, although results are also provided separately for men and women.
The AAI is a first-of-its-kind quantitative measure of active ageing in the literature which has hitherto focused largely on concepts, definitions and public policy discourse. In this pursuit, an important contribution of this measure is that it provides internationally comparable multi-dimensional evidence on the relative position of European Union (EU) countries with respect to active-ageing experiences. The AAI and its sub-indices are available for both men and women. This helps us to identify a need for social policy emphasis on reducing gender disparity in experiences of active and healthy ageing in European countries (for more discussion, see Zaidi et al. Reference Zaidi, Gasior, Zolyomi, Schmidt, Rodrigues and Marin2017).
Through the work on the AAI, a lot is now known about operationalising the measurement of active and healthy ageing at the country level. Results have shown how diverse the EU member states are with regard to active ageing measured at the country level. The affluent Nordic countries, Ireland and the United Kingdom are at the top of the ranking among the 28 EU member states, whereas Greece and the majority of Central European countries are at the bottom. The separate analysis for men and women reveals that AAI scores for men are higher especially where the employment and income dimensions are involved (Zaidi and Stanton Reference Zaidi and Stanton2015). A number of other studies have explored different derivations of the AAI (e.g. for a study at the regional level in Poland, see Breza and Perek-Bialas Reference Breza and Perek-Bialas2014).Footnote 1 These studies and the broadening of the scope of the AAI are important extensions for our knowledge of how to measure and promote active ageing.
The AAI and its derived work build on carefully selected indicators from several data sources. This reliance on multiple data sources has the advantage that the best set of indicators can be chosen from the most suitable data-set for the investigation of national differences in active-ageing outcomes (Zaidi and Stanton Reference Zaidi and Stanton2015). As such, the AAI is a useful and necessary tool to highlight differences in average active-ageing outcomes across countries and over time. However, by way of its construction, it comes with the drawback that even if indicators are derived, as in many cases, from individual-level data sources, the indicators come from different surveys. This means that any dispersion across individuals and sub-groups is lost in the process of constructing national averages. Furthermore, this method of constructing the AAI also implies that correlations across indicators at the individual level cannot be recovered, rendering moot e.g. distributional analysis. In addition, the analysis of correlates of the AAI with other variables is severely inhibited by the fact that any correlate must be present in all the surveys from which the AAI draws its indicators.
Increasing our knowledge of the distribution of active-ageing outcomes is important in its own right, but it has taken on increased urgency by the recent rise in income inequality (Piketty Reference Piketty2014). This has generally raised the priority of understanding distributional issues (Organisation for Economic Co-operation and Development 2011). Furthermore, it speaks to the concern about whether ageing experiences have also been unequal (see e.g. Cann and Dean Reference Cann and Dean2009). These considerations together motivate us to study inequality in active-ageing experiences. This paper is a first attempt at constructing an active ageing index from individual-level data from only one survey data source. This enables us to form an individual-level active ageing index. Our purpose for doing so is threefold. First, as noted above, an individual-level active ageing index enables us to study inequality in active-ageing experiences within countries. Secondly, we can study how and if inequality in active ageing has changed over the past decade. Lastly, documenting the construction of an individual-level active ageing index has value in its own right, since we believe it opens a number of avenues for research which cannot be addressed using the macro-level AAI. Research themes which are not pursued in this study but may well add information important to policy makers and practitioners include the study of vulnerable sub-groups such as older people with disabilities; correlations between the individual-level active ageing index (or its sub-indicators) and other important measurements of wellbeing such as subjective wellbeing, health and individual income. Moreover, our index also facilitates the construction of a regional, i.e. at the level of the European Commission's NUTS3 classification of regions, active ageing index for a number of countries.
We use data from Wave 5 of the Survey of Health, Ageing and Retirement in Europe (SHARE) collected in 2013 for this purpose. SHARE has the added value that it focuses on older people and thus can be expected to have better coverage among this population group than general-purpose surveys used in the AAI. This paper proceeds in three steps. First, the construction of the individual-level active ageing index is carefully documented in relation to existing work on a macro-level AAI. We then proceed to compare the macro-level AAI with the individual-level active ageing index. This is done by aggregating the latter over individuals to obtain an alternative measure of the macro-level AAI, this time built from the individual-level active ageing index. This step is important because it ensures that when aggregated, the proposed individual-level active ageing index corresponds to the macro-level AAI; hence, that the two indices are measuring the same phenomenon but at very different levels. Subsequently, the individual-level active ageing index is used in studying the inequality in active-ageing outcomes in the 15 European countries available in SHARE. This distributional analysis can only be done with our suggested individual-level active ageing index. Finally, the evolution in inequality in active-ageing outcomes is analysed over time, relying on SHARE data from both 2004 and 2013.
Methodology
The macro-level AAI was developed during the 2012 European Year on Active Ageing and Solidarity Between Generations, with funding from the European Commission's Directorate General for Employment, Social Affairs and Inclusion, and the Population Unit of the United Nations Economic Commission for Europe (UNECE). It provides a tool at the country level to assess the untapped potential of older people and to provide comparative integrated evidence on overall progress with respect to active ageing in the EU.
On the basis of a literature review on the topic of active ageing (in particular Eurostat 2011; Gabriel and Bowling Reference Gabriel and Bowling2004; Organisation for Economic Co-operation and Development 2008; UNECE 2012a, 2012b; Walker and Maltby Reference Walker and Maltby2012; World Health Organization 2002), and also in consultation with the AAI Expert Group, which was formed as part of the original AAI project, a conceptual and empirical framework was developed to aid the selection and organisation of active-ageing indicators and their specific domains. At the end, the AAI comprises 22 individual indicators grouped into four distinct domains (Table 1): employment; participation in society; independent, healthy and secure living; and capacity and enabling environment for active ageing. This construction allows for comparative assessment across countries for individual domains (for the strength and limitations of the macro-level AAI as a comparative tool for policy making, see Zaidi Reference Zaidi2015).
Table 1. Mapping of macro-level Active Ageing Index (AAI) indicators to the Survey of Health, Ageing and Retirement in Europe (SHARE) data (Wave 5)

Notes: EQLS: European Quality of Life Survey. ICD: International Classification of Diseases. ICT: information and communications technology. ISCED: International Standard Classification of Education.
Most active-ageing components of the macro-level AAI are drawn from the analysis of micro data. However, the fact that the AAI is assembled from many different surveys poses a challenge to measuring inequality, since the different indicators do not belong to the same individual and thus cannot be aggregated at the individual level. Atkinson and Marlier (2012) also make this critical distinction and hold the view that the aggregation of multi-dimensional indicators into a composite index is conceptually less defensible than the method of summation of individual attributes within an individual, as explored in this paper.
This paper extends the work on a macro-level AAI by constructing an individual-level active ageing index and undertaking analysis of inequality of active ageing, following the analytical framework of the AAI. Not surprisingly, the analysis of the distribution of active-ageing outcomes presents some methodological challenges. The most obvious is that all forms of active-ageing experiences have to be captured at the individual level. This becomes an issue when the indicators in question are defined only at the macro level (Kaneda, Lee and Pollard Reference Kaneda, Lee and Pollard2011; Zaidi Reference Zaidi2015). An example is the indicator linked to mortality and health: ‘Share of healthy life years in the remaining life expectancy at age 55’ (see Table 1). While well-defined and relevant at the macro level, it is not measurable prospectively at the individual level. Due to this issue, it is not possible to make a exact one-to-one correspondence between the macro-level AAI and the individual-level active ageing index. The individual index constructed in this article relies on the SHARE data-set for indicators in all four of the indicator domains of the AAI. The advantage is that the study of inequality can then proceed in a rather straightforward manner from the individual active ageing composite indices. The use of the SHARE data-set, although rich in content, compromises the country coverage. As can be expected, for different reasons not every single element of the AAI can be matched using the SHARE data-set.
In order to validate the individual-level active ageing index based on the SHARE data, the individual-level composite index is aggregated into a country-level active ageing index. This is then compared to the results from the macro-level AAI of Zaidi et al. (Reference Zaidi, Gasior, Hofmarcher, Lelkes, Marin, Rodrigues, Schmidt, Vanhuysse and Zolyomi2013). Overall, aggregating the index based on the SHARE data to the country level yields comparable results to the AAI. This supports the notion that the individual measure provides a good starting point for the distributional analysis of active-ageing experiences across selected EU countries.
The first step of our analysis seeks to reproduce the country-level active ageing index with the one constructed from the individual-level SHARE data-set. The analysis is based on Wave 5 of SHARE (conducted in 2013), which covers 13 EU countries and provides us with 20 suitable counterparts to the 22 indicators of the original AAI. Only two indicators are not covered. The coverage of countries include both top-, mid- and low-ranked countries according to the macro-level AAI ranking. The following countries are covered (AAI clustering is reported in parentheses): Austria (middle), Belgium (middle), Czech Republic (middle), Denmark (top), Estonia (middle), France (middle), Germany (top), Italy (middle), the Netherlands (top), Luxembourg (middle), Slovenia (low), Spain (middle) and Sweden (top).
Table 1 describes the original macro-level AAI indicators for the four domains, and the link to the corresponding individual-level indicators as constructed from the SHARE database. The weights applied to and within each sub-domain are also listed.
The matching of the AAI indicators follows three steps. First, for most of the AAI indicators the micro-level attributes are available and the transformation is implemented by translating macro-level indicators (e.g. employment rate, percentage of people participating in politics, etc.) into 0/1 variables at the individual level. For instance, individuals active in the labour market are categorised as 1 and non-active as 0. In contrast to the original AAI, we thus define activity rates rather than employment rates. Labour market activity rates (or participation rates) are less sensitive to recessions, although they are not unaffected by them. Given the economic divergences within Europe following the great economic recession, it is more robust to use participation rates rather than employment rates when comparing across countries. As such, this is one way to account for the fact that some countries have high unemployment levels (Southern Europe) whereas others are currently doing better (Northern Europe).
Second, some AAI indicators are not contained in the SHARE data-set, but they can be proxied by replacing them with closely related indicators. For instance, the share of healthy life years in the remaining life expectancy is approximated by a binary variable (0/1) if the person's self-assessed health is indicated as ‘good’ or better on a five-point scale. Self-assessed health, while vulnerable to subjective biases, is correlated with mortality and healthy life expectancy (Idler and Benyamini Reference Idler and Benyamini1999; Milligan and Wise Reference Milligan and Wise2015). Likewise, the World Health Organization-5 measure of mental wellbeing as used in the AAI is replaced with a combination of five variables on the mental condition in the SHARE questionnaire. The correlation between original and SHARE-based measures amounts here to 0.38. For the other indicators, the individual-level indicators correspond closely to the AAI indicators (see Table 1).
Third, all 20 indicators are converted into binary variables so they take the values 1 or 0 at the individual level. For most indicators this is a natural extension of the corresponding AAI indicator (see Table 1).Footnote 2 Building only on 0/1 variables allows for the replication of the AAI scores coherently in a simple way: by using the weights the AAI assigns to each indicator, and adding up the personal scores per individual over indicators yields a person-specific score between 0 and 1 that conceptually corresponds to the macro-level AAI. The proposed individual measure can then be understood as the weighted average personal score on the active-ageing indicators and is the main measure on which we build the inequality analysis.
Table 2 presents the mean value for each indicator for the three main age groups for which results are reported (55–64, 65–74 and 75+ years). Note that in the macro-level AAI some indicators are calculated only for those aged between 55 and 74, 65+ or 75+ (see e.g. Table 1, indicator 3.3 ‘independent living arrangements’). For the individual-level active ageing index, each indicator is maintained (and calculated) for all age groups, such that the ‘independent living arrangements’ indicator is also applied to individuals below the age of 75. Given that the data are available for each individual in SHARE, irrespective of age, we consider this to be the most consistent approach.
Table 2. Summary statistics for indicators per age group
Notes: The employment category differs from Table 1 in line with the age groups applied in this study. EQLS: European Quality of Life Survey. ICD: International Classification of Diseases. ICT: information and communications technology.
One indicator is lagging in each of the two domains ‘independent, healthy and secure living’ and ‘capacity and enabling environment for active and healthy ageing’ (Table 1, domains 3 and 4). While this is a limitation, once the weighting scheme is taken into account, less than 8 per cent of the weighted indicators are missing. Overall, the SHARE data-set from Wave 5 provides very good coverage of the active ageing index.
Assessing inequality within countries
To assess the distribution of individual-level active-ageing scores two popular measures of inequality are computed: the Gini coefficient and the ratio of the value for the 80th percentile to the 20th percentile (p80/p20 ratio). The Gini coefficient – taking a value between 0 and 1 – is a frequently used measure to describe the dispersion of a distribution (most commonly wealth or income distributions, see e.g. Atkinson and Marlier Reference Atkinson and Marlier2010). The higher the Gini value the more unequal is the distribution; with the value 0 describing complete equality and 1 complete inequality. Several other measures exist but the Gini coefficient is the most commonly used. As a test of the robustness of our results on inequality, we also report the p80/p20 ratio; another common measure of dispersion that gives information about the ratio of the 80th to the 20th percentile of individual active ageing index scores. As will be apparent, the p80/p20 ratio supports the same key findings as the Gini coefficient, both qualitatively and quantitatively.
Assigning weights in the composite indicator
The construction of a composite indicator always involves assumptions about the weights chosen for each indicator. Results are shown using both the weights applied in Zaidi et al. (Reference Zaidi, Gasior, Hofmarcher, Lelkes, Marin, Rodrigues, Schmidt, Vanhuysse and Zolyomi2013) and also an equal weighting scheme where each indicator is assigned the same weight in the individual composite indicator. As it turns out, the negative association between the country-level active ageing and inequality in active ageing only gets stronger when we use an equal weighting scheme.
In the two domains where one indicator is lagging, the weights (when the AAI weighting scheme is used) are spread out proportionally between the remaining indicators, in order to keep the relative weight of an indicator within a domain constant.
In order to verify that the main elements of the macro-level AAI are captured with the proposed micro-level AAI, we first reproduce the AAI country scores by aggregating the individual scores. Taking survey weights into account, the average of the individual scores per country for the overall index and also for the domain-specific indexes are found. The country-level scores obtained in this way are highly correlated with the AAI scores of Zaidi et al. (Reference Zaidi, Gasior, Hofmarcher, Lelkes, Marin, Rodrigues, Schmidt, Vanhuysse and Zolyomi2013). Furthermore, besides the main results a number of robustness checks are also reported.
Results
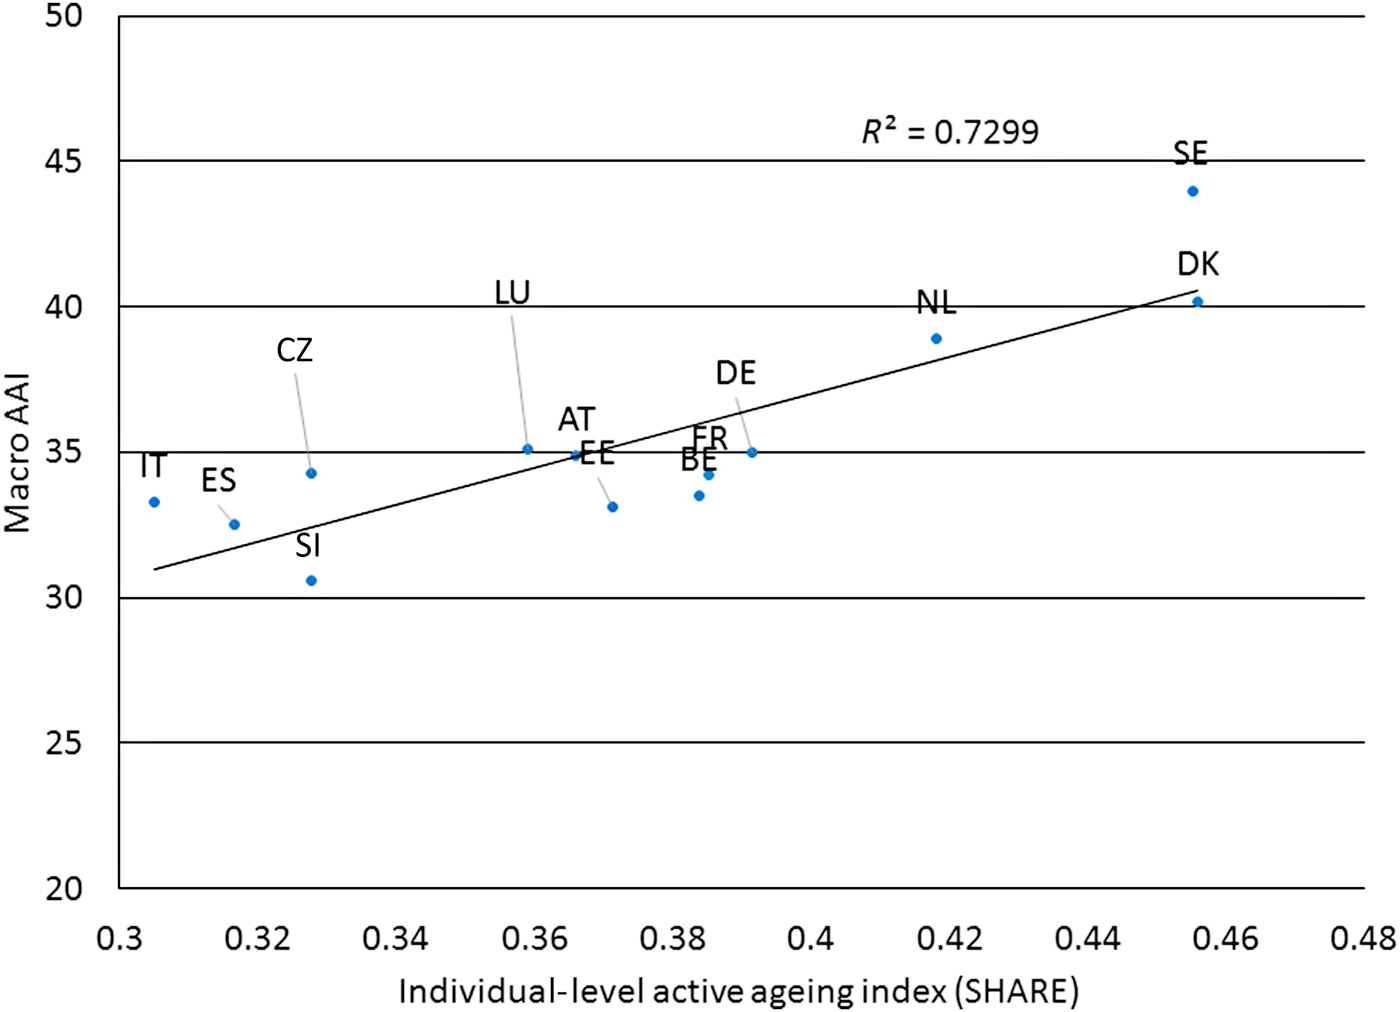
Figures 1 and 2 contain charts in which we plotted the country values of the macro-level AAI against the country scores of the individual-level active ageing index. While the correlations are not perfect, they do show a close relationship between our individual-level active ageing index and the macro-level AAI. We conclude from this close relationship that our approach is able to represent the same country-specific characteristics as in the macro-level AAI. It can therefore be an adequate micro-level proxy to the macro-level original.

Figure 1. Comparison of the macro-level Active Ageing Index (Macro AAI) and the average individual-level active ageing index.

Figure 2. Correlation of the average individual-level active ageing index and the macro-level Active Ageing Index (Macro AAI): the overall relationship of the indexes.
As noted above, the macro-level AAI procedure applies certain indicators only to certain age groups. By contrast, we apply our set of indicators to all persons above the age of 55 and then conduct the inequality analysis for three age groups (55–64, 65–74, 75+) in order to take account of systematic differences in active ageing.
A first set of results is given in Table 3, in which countries are ranked according to the Gini coefficient of active-ageing scores in the age group 65–74 years. Apart from the Gini coefficient for each country and age group (more on this below), Table 3 also lists the respective average individual-level active ageing index scores per age group.
Table 3. Average individual-level active ageing index score and corresponding Gini coefficient per country

Note: Countries are ordered according to the Gini coefficient for the 65–74 age group.
Generally, the average active-ageing scores vary between 0.59, which is the average for Swedish persons between the ages of 55 and 64, and 0.18 for Spaniards, Italians and Estonians above the age of 75. The average individual scores are highest for the youngest age group and decrease with age. This pattern indeed appears in all countries. The reason is that the performance on a number of indicators – e.g. employment, voluntary activities, health – is related to age. However, the negative relationship between age and active ageing is robust to leaving out the AAI-specific weights that particularly stress the significance of employment, although the association between age and active ageing then becomes less strong.
Differences between men and women
It is well known that there are important gender differences when it comes to the ageing experience (Corsi and Samek Reference Corsi and Samek2010; Foster and Walker Reference Foster and Walker2013). Table 4 therefore adds gender differences to the analysis of the individual-level active ageing index. The individual-level active ageing index scores now vary between 0.60, which is the average score of Swedish men between the ages of 55 and 64, and 0.17 as the average score of Spanish and Italian women above the age of 75. Again, and as reflected in the overall score, for both men and women active ageing declines with age. Most, but not all, of this difference for each gender is due to sharply declining rates of labour market participation. The average scores are generally higher for men, but not by a very large margin and not for all countries (Table 4). The largest difference in active ageing between men and women is observed in Italy and Spain. The average value for the active-ageing index for Spanish women in the age group 55–64 is almost 20 per cent lower than the equivalent score for Spanish men. For most countries the difference is well within 10 per cent for all age groups and comparative differences at the country level are small.
Table 4. Average individual-level active ageing index score and corresponding Gini coefficient per country, by gender
Note: Countries are ordered according to the Gini coefficient for females from the 65–74 age group.
Labour market participation plays a significant role in generating the observed gender differences. In fact, for the age group 55–64, excluding the indicator for labour market participation from the active ageing index turns the gender difference on its head (not reported). The impact of labour force participation is less strong among those aged 65–74, but excluding the indicator narrows the gender gap significantly. Labour market participation among those aged 75+ is too small for both genders to play a role for this age group.
Table 4 suggests that gender differences in active ageing are not fundamentally different across age groups, i.e. the ratio of female to male active-ageing scores are only marginally different between the age groups 55–64 and 75 + . However, the discussion above of the impact of labour market participation implies that women score worse on the three other domains of the active-ageing index when they get older. In other words, where the gender gap in the age group 55–64 is driven by higher labour market participation for men, the gap for the 75+ age group is driven by a higher male score in the other three domains. This finding is stable across countries.
Inequality in active ageing
The analysis of the Gini coefficients across age groups does not reveal a clear-cut pattern. However, the Gini coefficient in most countries is slightly decreasing with age. This is particularly the case for women: no country, except Sweden, has a higher Gini coefficient for the 75+ group than for the 55–64 age group. It is the same in the total population, except in Sweden a larger Gini coefficient is observed for the oldest age group compared to the youngest. The broad decrease in within-age group inequality with age is in large part due to a decrease in ‘employment’ inequality. In the oldest age group very few people work. Across all countries, around 50 per cent of those aged 55–64 are employed. The strong implicit weight that the AAI procedure assigns to the employment status probably accounts for these exceptions.
This is corroborated by the fact that without the AAI-specific weights (i.e. all sub-indicators are given equal weight), the relationship between age and within-age group Gini coefficient vanishes (not reported). The inequality measures thus either remain rather stable over age groups or rise marginally with age, as in Slovenia. Hence, we have to be careful when concluding that within-age group inequality in active ageing changes with age. In fact, the more interesting finding is how little the Gini varies across age groups. In all countries the Gini coefficient remains higher for women in the full sample. But the differences are relatively small; thus, while there is a tendency for inequality in active ageing to be higher for women, this point should not be over-emphasised.
Cross-country comparisons of active ageing within age groups reveal systematic differences between countries. Denmark, Sweden and the Netherlands score very high over all age groups, while older people in Spain, Italy and, to a lesser extent, Slovenia, are always among the low-scoring countries. The country differences in average scores are large both in relative and absolute terms, as exemplified by the percentage difference between minimum and maximum score. This difference equals 50 per cent (Sweden: 0.59; Slovenia: 0.39) for those aged 55–65 and amounts to 56 per cent for the age group above 75 years (Denmark: 0.28; Spain, Italy and Estonia: 0.18). Inequality between countries is stable over the three age groups when measured by the coefficient of variation.Footnote 3
Considering the Gini coefficient across countries shows that Sweden, Denmark and the Netherlands have the lowest degrees of inequality in active-ageing scores over all age groups. Italy and Estonia have the highest observed inequality for the different age groups. The differences between countries in Gini coefficients show little variation over age groups.
Inactive and unequal?
The analysis above finds that the same countries, namely Denmark, Sweden, the Netherlands and Italy, stand out – albeit at different ends of the scale – both when it comes to levels and within-country inequality of active ageing. This observation points to an interesting relationship between average active-ageing attainment and inequality in active ageing: the higher the average score of a country in the individual-level active ageing index, the lower is the inequality in that country in active-ageing terms. This finding is consistent with the case that countries with lower outcomes on social indicators are also more often unequal (Wilkinson and Pickett Reference Wilkinson and Pickett2009).
This negative link is portrayed well in Figures 3 and 4. They contain scatter plots of the countries’ average scores against their Gini coefficients (marked by squares).
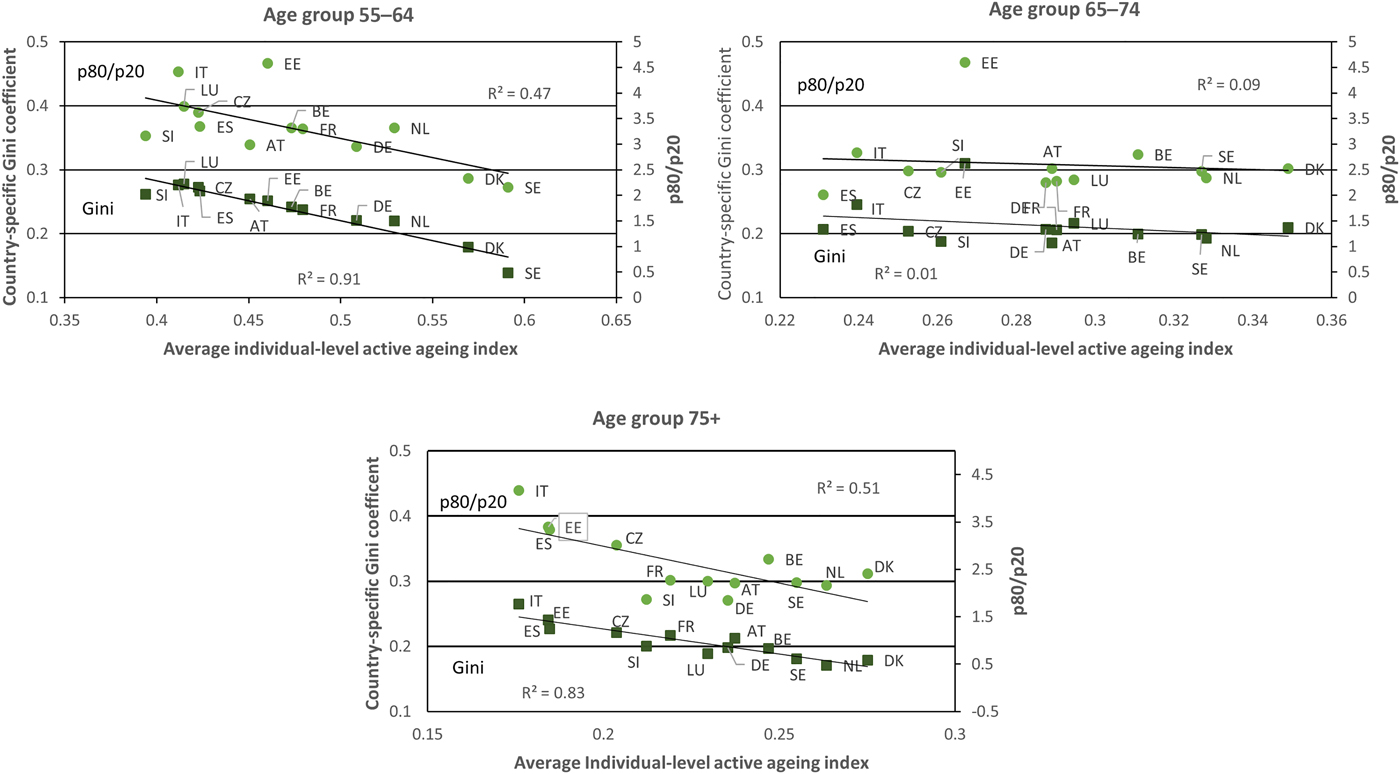
Figure 3. Average individual-level active ageing index versus Gini coefficients and ratio of the value for the 80th percentile to the 20th percentile (p80/p20), by age group.
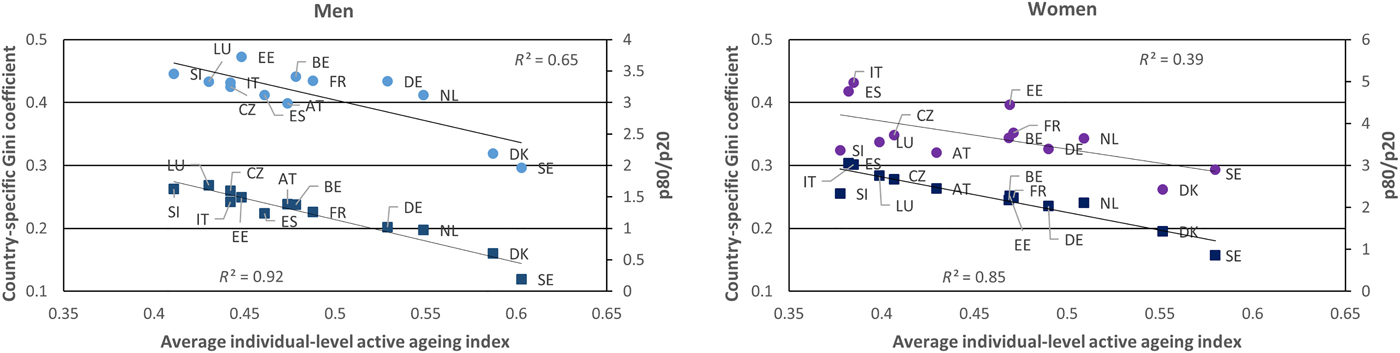
Figure 4. Average individual-level active ageing index versus Gini coefficient (squares) and ratio of the value for the 80th percentile to the 20th percentile (p80/p20; circles), by gender for the 55–64 age group.
While the strong correlation is most apparent for the 55–64 age group (Figure 3), the relationship holds over all age groups and genders (Figure 4), results by gender for the age groups 65–74 and 75+ are available from the authors upon request) and is robust to the exclusion of AAI weights (see below for a discussion).
With the ratio of the 80th percentile and the 20th percentile, we plot a second inequality measure against the average scores (marked by circles). It confirms the previous finding of a negative relationship between inequality and average active-ageing achievement for men and women.
In order to illustrate the interplay of inequality and average old-age activity, consider active ageing in the Netherlands and Estonia for the age group aged 65–74 (Table 3). The average active-ageing outcomes differ substantially with the Netherlands among the top scores (index value of 0.33) while Estonia is performing slightly better than countries at the bottom (index value of 0.27). However, due to their differences in inequality measured by the Gini coefficient, the Netherlands is among the countries with the lowest inequality for this age group whereas Estonia has the highest inequality, the average score among the top quantile in each country is actually slightly higher in Estonia (0.50 versus 0.49).
The inequality in some countries is strong enough to distort the comparison of mean levels of the active-ageing relationship. The average score for Estonia in the age group 65–74, for instance, is only slightly lower than the average score for the corresponding senior citizens in Germany. However, this outcome is due to much higher inequality in Estonia compared to Germany. Looking instead at the median score, which is less sensitive to extreme distributions, reveals that Germans in the age group 65–74 have a higher median score than Estonians.
The role of national income levels
One important question to ask is to what extent the association between the country level of active ageing and inequality in active ageing is being driven by country-level income (i.e. Gross Domestic Product (GDP) per capita). In other words, how does national wealth link with active ageing and with inequality in active-ageing outcomes. While it is difficult to assess this in terms of cause and effect, that is, whether GDP is causing both a high level of active ageing and a low level of inequality, it is possible to look at the correlation between level and inequality of active ageing once the influence of GDP has been accounted for. In other words, is a higher level of active ageing at the national level still associated with less inequality once country-level GDP is controlled for?
To this end, first the level of active ageing is regressed on GDP to find the portion of active ageing at the country level that can be explained by GDP alone. The residual is then the part of the active-ageing score not associated with GDP.Footnote 4 If the correlation between the residual active-ageing scores and the Gini coefficient (technically this is the semi-partial correlation between the Gini coefficient and the level of active ageing) continues to be substantial for each age group, it is unlikely that the observed associations between level of active ageing and inequality found in Figures 3 and 4 are driven by GDP differences. This correlation is indeed large.Footnote 5 In fact, GDP is only weakly correlated with both Gini and country level of active ageing in the sample of countries, which further strengthens the view that GDP is not the underlying driver of the negative relationship between level and inequality.
Results with equal weights
As noted above, the main analysis in this study uses the same weighting scheme as the one employed in the macro-level AAI study (see Table 1). Any weighting scheme in composite indicators involves subjective judgements. Weights from the macro-level study provide a good starting point insofar as they are obtained from experts in the area of active ageing. However, our results do not depend on this weighting scheme. In particular, we obtain an even starker negative association between the overall level of active ageing and inequality for the two oldest age groups if we use equal weights for each of our indicators (not shown, but results are available from the authors).
Changes in inequality over time
While the level of cross-sectional inequality is clearly of policy interest, so too are changes over time. The available data are too limited to give a definitive picture of how inequality of active ageing is changing in Europe. However, the SHARE data allow us a representation of recent developments for a number of countries.
The first wave of SHARE data was collected in 2004 in 12 countries. Of these, nine were also covered in the 2013 Wave 5 data collection: Austria, Germany, Sweden, the Netherlands, Spain, Italy, France, Denmark and Belgium. However, the coverage of indicators are less complete in the 2004 data-set. For the employment and participation in society domains, all indicators can be found in the 2004 survey. Note that these two domains account for 70 per cent of the overall weights in the AAI (cf. Table 1). In the independent, healthy and secure living domain, three indicators can be matched (physical activity, independent living and lifelong learning) and the same is true for the capacity and enabling environment for active and healthy ageing domain (healthy life years, mental wellbeing and educational attainment). In total, more than 80 per cent of the indicators can be included in the analysis of inequality over time from 2004 to 2013. This is arguably a reasonably long period, and at the same time an interesting period for the economic and social changes in the European countries. It covers the period of the economic boom in Europe until the financial crisis of 2008, and subsequently the period of recovery, austerity and widespread economic divergence between Northern and Southern Europe. In effect, the trend analysis undertaken can give us an insight into the effect of the great economic recession on active-ageing inequality. It is important to note, however, that we are comparing different cohorts over time. Thus, assigning cause and effect is complicated by legacy effects, affecting the distinct cohorts in different ways. However, it is still of policy interest to analyse whether active-ageing outcomes for a given age group are more or less equal compared to an earlier time period.
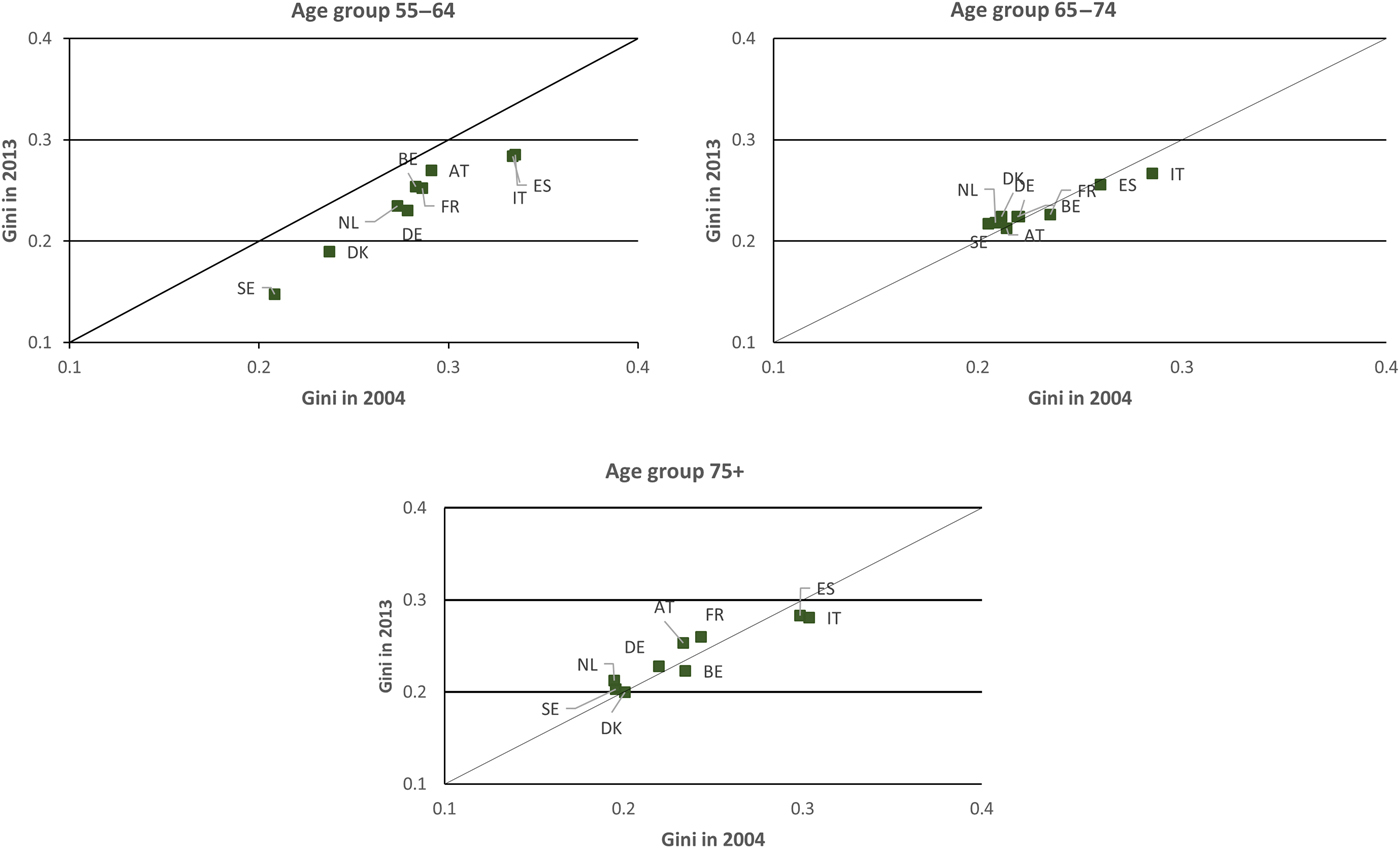
The overall picture is one of slightly falling inequality over the period 2004–2013 for the nine countries covered. This effect is driven by the 55–64 age group. Figure 5 shows, for each of the three age groups, the Gini coefficient in 2013 plotted against the coefficient in 2004 combined with a 45° line to show changes in inequality over the period. Markers below the 45° line illustrate a decrease in inequality whereas the opposite is the case for markers above the line.

Figure 5. Changes in Gini coefficients from 2004 to 2013 by age groups, selected countries.
For the age group 55–64, this finding is driven by an increase in employment which lowered inequality in the active ageing index scores for all countries. Employment rates have changed markedly for this age group in the ten-year period from 2004 to 2013, and given the large weight in the active ageing index, this has driven down inequality. For the two oldest age groups the picture is less clear, but changes in either direction are very small. These qualitative results hold also for the equal weighting scheme, though are less stark for the age group 55–64 due to the smaller implicit weight on employment outcomes (cf. above, not shown in figures).
The broad message conveyed in Figure 5 is that inequality in active ageing does not seem to have suffered from the early part of the great economic recession. In fact, the evidence suggests that, at least in Western Europe and for the age group 55–64, active ageing has become a more equal experience since 2004.
With respect to the gender dimension, it is worth mentioning that the reduction in inequality for Austria in the youngest age group is driven by a decrease among men with no change in inequality in active-ageing outcomes for women. For the other age groups there are small differences between men and women for some countries, but the size of the change, in either direction, is in any case very small. Thus, while none of these differences amounts to a gender divide, it is nevertheless advisable to keep an eye on these developments.
Conclusions
The trends of population ageing and inequality are both major concerns for the advanced societies of Europe. This study undertakes an examination of both these issues, by analysing the dispersion in the experiences of ageing in these societies. For the motivation, it is argued that inequality late in life should carry extra weight in policy agendas because there is little mobility (in a broad sense) within the group of older people. In addition, combating inequality and disadvantage with the help of association with the labour market will only go so far with older persons.
Studying inequality in active ageing is no easy task because of the need for individual-level indicators for the different domains of active ageing from the same data source. The SHARE data-set provides good individual-level indicators for most domains and we find a high correlation between the aggregated measures constructed using SHARE and the macro-level AAI. This instils confidence that we are measuring the same underlying phenomenon with both approaches.
Results included in this paper show consistency with the findings of the macro-level AAI project, although no large gender differences are observed. The central finding of the paper is that countries with a higher level of active ageing tend to have a more equal individual distribution of active ageing. This is a clear indication that, as with analysis of income, it is important to look beyond averages.
These findings lead to three important observations. First, countries that have achieved higher active-ageing outcomes have also been able to keep the inequality in active-ageing experiences low. Thus, there is no tension in this respect across unequal experiences.
Second, helping the most vulnerable in EU member states with low active ageing may go a long way towards supporting more equality across member states.
Third, all other things being equal, the experiences of active ageing became more equal in the period from 2004 to 2013. Since data were only available for nine Western European countries, the extent to which these results can be generalised offers an interesting avenue for future research.
Finally, the set of results reported here is robust given the data available. Nevertheless, further research could focus on complementing this line of research by measuring individual-level active ageing from other surveys to see if the same results would be obtained. There might also be additional information of importance for policy makers by looking at individual domains to see if there are common factors across countries that contribute to both low levels of active ageing and high inequality.