


One hundred years after ratification of the Nineteenth Amendment, the ability of women to effectively exercise the right to vote is far from guaranteed.
One hundred years after ratification of the Nineteenth Amendment, the ability of women to effectively exercise the right to vote is far from guaranteed. Although 1920 may mark the historical moment when women’s suffrage was added to the Constitution, the past century has been rife with obstacles preventing many women, particularly women of color, from exercising their right to vote. Scholars have noted that for these women, the Voting Rights Act (VRA) of 1965 was pivotal in more fully securing the right to vote (Hewitt Reference Hewitt and Hewitt2010; Junn and Brown Reference Junn, Brown, Wolbrecht, Beckwith and Baldez2008; Montoya Reference Montoya, McCammon and Bansazak2018; Smooth Reference Smooth2006). With a resurgence in voter-suppression efforts and a US Supreme Court ruling that weakened the VRA, voting rights again are imperiled. Although the role of race and class justifiably have been placed at the center of analysis, little attention has been given to the potential gendered considerations. This article argues that gender is still a salient part of the story, and intersectional analysis is necessary for a more thorough understanding of the impact that restrictive laws might have in order to counter them.
CONTEMPORARY CHALLENGES TO VOTING RIGHTS
Studies on voting rights show that the suffrage of marginalized groups has been consistently impeded by economically and racially biased policy and practice (Keyssar Reference Keyssar2000; Michener Reference Michener2016; Wang Reference Wang2012). Although the VRA removed many of the de jure racial impediments to voting, it did not remove all of the obstacles that remained de facto. The widely publicized irregularities of the 2000 presidential election brought renewed scrutiny to the voting process, albeit to different political ends. Democrats emphasized the need to remove discriminatory practices and to improve voting accessibility, whereas Republicans emphasized the need to protect elections from alleged voter fraud and began reframing voting as a privilege rather than a right. The GOP’s significant state-level gains in the 2010 midterms, in what has been characterized as a backlash to the election of Barack Obama, prompted a wave of restrictive voting bills and practices across the country, from strict voter-identification laws to citizenship checks and voter-registration purges. The 2013 Shelby County v. Holder US Supreme Court decision removing the federal preclearance provision to the VRA opened the floodgates, eliminating what had been an effective means of slowing down and limiting restrictive efforts. The consequences of this rollback of voting rights are not yet entirely clear. Although restrictive laws have been adopted in several states (primarily those with Republican leadership), countermobilization and legal challenges have muted the effect on turnout (Fraga Reference Fraga2018, 172).
The first public attention given to the possibility that there might be a gendered impact came after a restrictive law in Texas (signed into law the day after Shelby) was put into effect. Two prominent white women—State Senator Wendy Davis and District Judge Sandra Watts—were challenged at the polls for discrepancies between how their names were listed on voting registers and their driver’s licenses, a common occurrence related to marital name changes. Reports highlighted potential gendered implications but with little mention of the role that race and class might play more broadly. Meanwhile, other examples and accounts in recent years emphasized racial marginalization with little emphasis placed on the role that gender might play—even those focused on women of color.
Whereas racial and class exclusions are still paramount, gender should not be dismissed. In regard to voter-identification laws, women are still significantly more likely to change their name when they marry or divorce. A 2006 Brennan Center survey found that only 66% of voting-age women with ready access to any proof of citizenship had a document with a current legal name on it (Brennan Center for Justice 2006). Women also comprise a larger percentage of many groups noted as less likely to have any valid identification: those living in poverty, senior citizens, and college students. A broader gender analysis also should include the fact that voter-identification laws also disproportionately impact transgender or nonbinary voters, who often have less legal recourse. In a report released before the 2018 midterms, the William Institute estimated that strict voter-identification laws could disenfranchise approximately 78,000 transgender voters (Herman and Brown 2018). Other than voter identification, myriad voting laws and practices might be considered for their gendered impact, from those shaping the broader contours of accessibility (i.e., hours and locations of voting) to specific regulations limiting the number of children brought to the polls.
INTERSECTIONAL ANALYSIS
Scholarship on race and gender has long been critical in the assessment of US political institutions as “robust, legitimate, and democratic” (Eckhouse Reference Eckhouse2018). Both have provided parallel arguments that characterize political institutions as embedded within societal hierarchies, which they uphold and reproduce. These scholars frequently use race-only or gender-only approaches that are useful in highlighting a particular dimension of analysis or adhering to disciplinary standards on parsimony but that serve to minimize the complexity of interlocking modes of power and oppression. Hancock (Reference Hancock2007, 74) argued that by unpacking the assumptions of single-axis approaches, intersectionality can fundamentally change the way in which political science research is conducted. The application of intersectional analyses to the study of voting already has yielded invaluable insights. For example, although much attention has been given to “gender gaps” in voting behavior, intersectional scholars have noted how incorporating race changes the analysis (Bejarano Reference Bejarano2013; Junn and Masuoka Reference Junn and Masuoka2019; Smooth Reference Smooth2006). The partisan gender gap favoring Democrats is found across all ethno-racial groups, but white women still vote predominantly Republican. A race–gender analysis of the 2016 election showed that Black voters had the largest partisan gender gap and that Black women voted overwhelmingly for Hillary Clinton, more so than any other group (Pew Research Center 2018).
A race–gender analysis of voter turnout also challenges gender-gap narratives, showing that although women’s turnout has outpaced men in the aggregate, the size (and sometimes direction) of the gaps change when disaggregated by ethno-racial groups (figures 1–4). The gender gap between white men and women has grown steadily but is still smaller than the gap between Black men and women. The high rates of political participation by Black women have received more attention in recent election cycles, but a broader race–gender analysis is needed. For example, Latinas and Asian American women participate at much lower rates, and their gender gaps have different dynamics. For Latino/as, the average gender gap is higher than that for white and Asian American voters but lower and less consistent than the gap between Black men and women. For Asian voters, the average gap is the smallest and varies in its direction, with men sometimes reporting higher turnout than women. A race–gender analysis deepens our understanding of both the respective gender and racial analyses, which can be greater than the sum of their parts and raise new questions. What at times has been dismissed as “race trumps gender” might be better understood as gender operating differently across race with varying levels of saliency. For this reason, intersectional analyses should leave the relationship among social categories as an open empirical question with attention given to the larger historical and structural context (García Bedolla Reference García Bedolla2007; Hancock Reference Hancock2007).

Figure 1 White Gender Gap for Voter Turnout

Figure 2 Black Gender Gap for Voter Turnout

Figure 3 Latino/a Gender Gap for Voter Turnout

Figure 4 Asian Gender Gap for Voter Turnout
THE 2016 ELECTION AND NONPARTICIPATION
The 2016 presidential election was notable for several reasons not only because of the high salience of race and gender in the campaign but also because it was the first election after Shelby v. Holder.
The 2016 presidential election was notable for several reasons not only because of the high salience of race and gender in the campaign but also because it was the first election after Shelby v. Holder. Several states—many of which had been under the scrutiny of preclearance—adopted restrictive legislation, reduced the number of polling stations, shortened registration periods, and cut back polling hours. To explore how gendered and race–gender analysis might be used for studying the impact, I examined data from the 2016 US Current Population Survey Voting and Registration Supplement to determine why eligible voters (i.e., citizens either by birth or naturalization and older than 18) did not register or registered but did not vote (see the online appendix). To keep the relationship among social categories as an open empirical question, I reviewed potential differences by gender, race, and race–gender.
Reasons for Not Registering
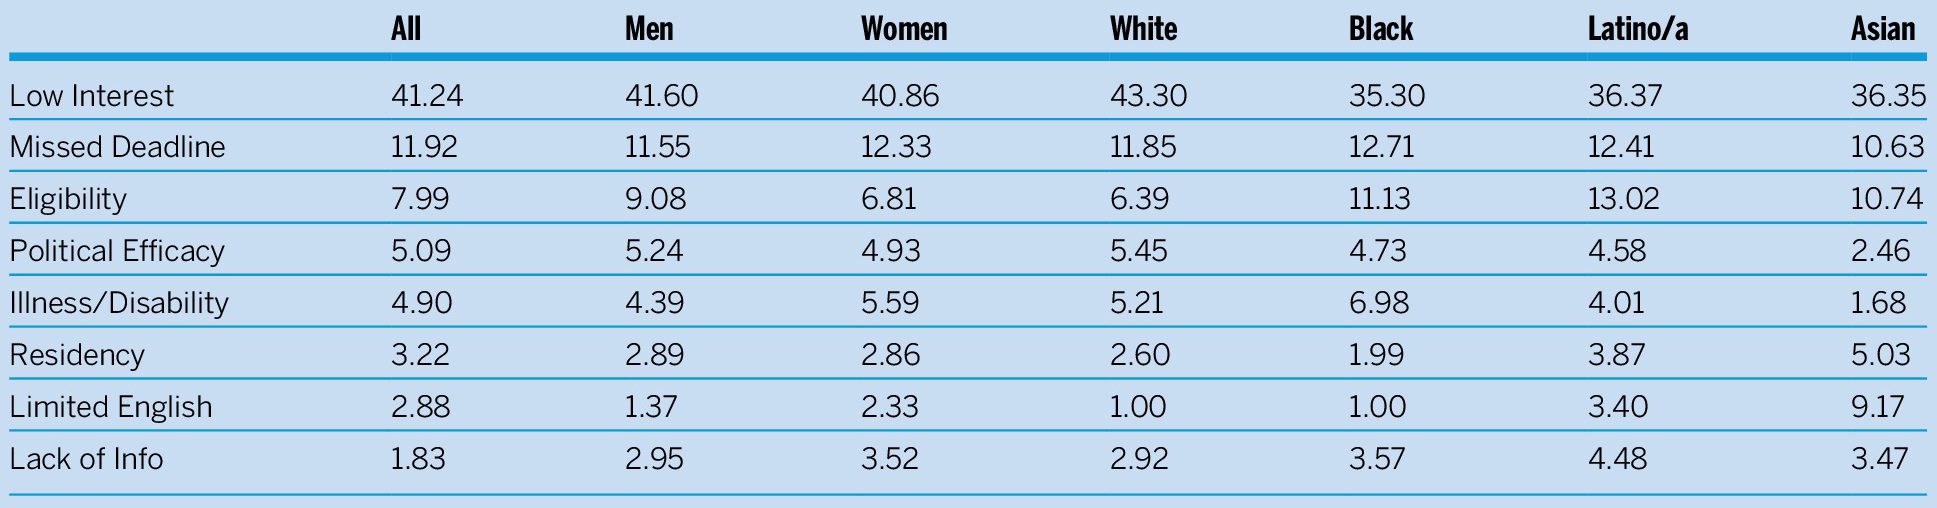
The most common reasons given for not registering across all eligible citizens were low interest, missed deadline, perceived eligibility, political efficacy, illness/disability, lack of information, residency requirement, and limited English. Whereas some of the percentages are quite low in the aggregate, each reason made the top five for at least one racial and/or race–gender group (tables 1 and 2).
Table 1 Reasons for Not Registering, By Race and Gender
Source: US Current Population Survey Voting and Registration Supplement, November 2016.
Table 2 Reasons for Not Registering, By Race–Gender

Source: US Current Population Survey Voting and Registration Supplement, November 2016.
Low interest is overwhelmingly the most prevalent reason. Although it may not be directly related to voting laws and practices, it is part of the larger voting calculus. A single-axis approach might elicit a “race-trumps-gender” finding. The gender gap is quite small (0.74%), whereas the racial gaps are more substantial, with a 7% to 8% gap between white respondents and Black, Latino/a, and Asian respondents. A race–gender analysis, however, shows different gender gaps among the different ethno-racial groups. Whereas the gender difference for white and Black respondents is less than a percentage point, there are larger gender gaps among Latino/as (2.49%) and Asian Americans (5.65%). Overall, men of color were more likely than women of color to report low interest as a reason for not registering.
Given space limitations and the simplicity of this descriptive analysis, I focus on only a few examples in which gender and race–gender analysis could make important contributions. The first is related to perceptions of eligibility. Of the reasons listed, it has the most distinctive gender gap (2.27%), with men more likely to report being ineligible. It also has notable racial gaps, with white respondents least likely to report ineligibility—a 4.35% to 6.63% racial gap with Asian, Black, and Latino/a respondents. Across race and gender, men of every ethno-racial group except Asian Americans are more likely to report ineligibility as a reason for not registering. The gender gap is largest among Black men and women (5.82%) and Latino/as (2.21%), with Latino and Black men reporting ineligibility at the highest levels.
In regard to illness/disability as a hindrance to registration, there is a smaller gender gap in the aggregate (1.19%). In regard to race, Black respondents were most likely to cite illness/disability as a reason for not registering and Asians the least likely (i.e., a 5.3% racial gap). Across race and gender, women were more likely than men to report illness/disability as a reason for not registering in every ethno-racial group. The gender gap varies, with the biggest gap reported among Latinos/as (1.62%). Of all the race–gender groups, Black women were most likely (7.38%) to report illness/disability as an impediment to registration.
Other notable trends among the most prevalent reasons included the following. Asian and Latino/a respondents reported not meeting residency requirements at higher rates than other ethno-racial groups, and men were more likely than women to report it in all groups except African Americans. Language limitations was one reason with the highest variance across racial groups, with Asian respondents being most likely to report it as a reason for not registering. They also had the highest gender gap (3.46%), with women more likely than men to report it as a reason—a pattern that holds in all groups except Black respondents. Lack of information had a gender gap across all ethno-racial groups.
Reasons for Not Voting
The N for respondents that registered but did not vote is fairly small, particularly for the smaller ethno-racial groups.1 Therefore, I focus on gendered differences and highlight some areas where intersectional analysis is most likely to elucidate important findings. The top reasons listed for registering but not voting included the campaign, low interest, busy with work or school, illness/disability (own or family), out of town, and transportation (table 3). The largest gender gap was for illness/disability, with women more likely than men to cite it as a reason for not voting across all ethno-racial groups. The biggest gender gap was between Black men and women (7.4%), with Black women reporting illness/disability as a primary reason for not voting most frequently (16.9%). The next two highest gender gaps were reported as being out of town (4.04%) and busy with work or school (3.14%)—both of which were reported more by men than by women of all ethno-racial groups, except for Asian men and women, who reported being out of town at the same rate. Low interest had a similar gender gap (1.96%), with men more likely than women to report it in all groups except Asian respondents. Transportation had a gender gap of 1.19%, with women of all ethno-racial groups more likely to report it as an issue. Black women were most likely to list transportation as an issue. Campaign had the lowest gender gap (0.43%), with men more likely than women to cite it as a reason for not voting; the biggest gender gap was between Asian men and women (5.6%).
Table 3 Reason for Not Voting, By Race and Gender

Source: US Current Population Survey Voting and Registration Supplement, November 2016.
Table 4 Reasons for Not Voting, By Race–Gender

Source: US Current Population Survey Voting and Registration Supplement, November 2016.
DISCUSSION
The descriptive analysis used in this study suggests that gender still may play an important role in assessing voting rights in practice. However, understanding this role may necessitate a more careful intersectional analysis that incorporates race as well as other potentially salient structural positions. This type of analysis requires better data (quantitative and qualitative), which might include larger and more careful sampling of ethno-racial minorities (Barreto et al. Reference Barreto, Frasure-Yokley, Vargas and Wong2018) as well as reconsiderations of how we measure sex and gender (Medeiros, Forest, and Öhberg Reference Medeiros, Forest and Öhberg2020). It also might require questions that better reflect people’s experiences. The Current Population Survey asks only for the main reason that people did not participate, when there may be more than one. It also asks only those who did not register or vote about potential obstacles. Research on Black women reveals that they turn out at higher rates than might be expected, given their structural disadvantages (Brown Reference Brown2014; Holman Reference Holman, Brown and Gershon2016; Smooth Reference Smooth2018). Showing up at the polls does not mean that these women have not encountered obstacles but rather that they have persisted. The full realization of voting rights means identifying and removing any and all obstacles so that there is nothing to overcome.
The full realization of voting rights means identifying and removing any and all obstacles so that there is nothing to overcome.
Celebrating the centennial anniversary of the Nineteenth Amendment is important. At the same time, it is imperative to recognize that new and persisting threats remain in exercising rights that ostensibly were granted a century ago. There is still much to learn about how voting rights guaranteed by the Constitution can be better translated into practice for all groups. Intersectional analysis provides a better understanding of the ways in which multiple categories of inequality interact to shape experiences and how “removing any one piece from our analysis diminishes our understanding of the true nature of relations of domination and subordination” (Collins Reference Collins1993, 30). This analysis suggests that gender remains a salient part of the story.
Supplementary Materials
To view supplementary material for this article, please visit http://dx.doi.org/10.1017/S104909652000030X.


