Introduction
The maintenance and use of crop diversity, such as that found in landraces, is critical to feed a predicted population of 9.8 billion by 2050 (United Nations, 2017) whilst adapting to climate change and an estimated loss of production of 2% per decade (Porter et al., Reference Porter, Xie, Challinor, Cochrane, Howden, Iqbal, Lobell, Travasso, Field, Barros, Dokken, Mach, Mastrandrea, Bilir, Chatterjee, Ebi, Estrada, Genova, Girma, Kissel, Levy, MacCracken, Mastrandrea and White2014). As noted by Esquinas-Alcazar (Reference Esquinas-Alcazar, Hayward, Bosemark and Romagosa1993), the heterogeneous varieties of the past (landraces, farmer-, traditional- or heritage varieties) are the plant breeder's raw material, potentially providing genes for agricultural traits, pest and disease resistance, resilience and adaptation to marginal environments. There are many examples of the use or value of landraces in crop improvement in the literature (Shetland cabbage – Crute and Pink (Reference Crute and Pink1989); sorghum – Li and Li (Reference Li and Li1998); lupin – Raza et al. (Reference Raza, Christiansen, Jørnsgård and Ortiz2000); pearl millet – Yadav et al. (Reference Yadav, Weltzien-Rattunde, Bidinger and Mahalakshmi2000); oats – Hammami et al. (Reference Hammami, Allagui, Chakroun and El Gazzeh2007); wheat – He et al. (Reference He, Li, Xu, Duan, Zhou and Li2007) and cassava – Raji et al. (Reference Raji, Ladeinde and Dixon2008)). Landraces are under threat from a range of factors including the introduction of modern cultivars, loss of traditional knowledge (through increasing farmer age, rural depopulation and migration to urban centres), lack of awareness of the value of landraces, and changes in climate directly affecting crops and cropping patterns (Negri et al., Reference Negri, Maxted, Vetelainen, Vetelainen, Negri and Maxted2009; FAO, 2014). Although historic changes in the use of many landraces have resulted in their being lost from mainstream production, they have not been entirely lost from niche production and collections. Landraces often perform well in low input, sustainable farming systems due to their ability to adapt to marginal conditions or under domestic/garden conditions where the economic imperative is not central to production (Harlan, Reference Harlan1992; Frankel et al., Reference Frankel, Brown and Burdon1995; Wood and Lenne Reference Wood and Lenne1997; Veteläinen et al., Reference Veteläinen, Maxted, Negri, Veteläinen, Negri and Maxted2009). Landrace cultivation is increasingly sustained or even re-established by growers developing and marketing landrace-based niche products (Ambrose and Letch, Reference Ambrose, Letch, Vetelainen, Negri and Maxted2009; Hofer, Reference Hofer, Turner, Moreau, Ambrose, Isaac, Butcher, Weller, Dupin, Dalmais, Le Signor, Bendahmane and Ellis2009; Martin et al., Reference Martin, Wishart, Cromarty, Chang, Vetelainen, Negri and Maxted2009; Nikolaou and Maxted, Reference Nikolaou, Maxted, Veteläinen, Negri and Maxted2009; Veteläinen et al., Reference Veteläinen, Maxted, Negri, Veteläinen, Negri and Maxted2009).
Landrace diversity is sampled and held ex situ in genebanks, and is maintained on-farm by farmers and in home gardens, allotments and market gardens albeit on a smaller scale. The landrace diversity held in home gardens is maintained by individuals who may belong to seed saving networks, such as Irish Seed Saver Association, Australian Seed Savers’ Network and US Seed Savers Exchange, which maintain collections in a parallel system to more conventional genebanks (Eyzaguirre and Watson, Reference Eyzaguirre, Watson, Watson and Eyzaguirre2002). The Heritage Seed Library (HSL) of Garden Organic, UK, is well known among seed savers for its wealth of approximately 800 heritage variety accessions, donated primarily from home gardens and unavailable elsewhere. Some may confine the value of the HSL collection to a relatively few gardening enthusiasts, but this under-estimates its larger role in agrobiodiversity conservation, being the last refuge of unique diversity and alleles, lost from mainstream commercial production and conservation. The aim of this study was to demonstrate the range of diversity held in the collection through an Amplified Fragment Length Polymorphisms (AFLP)-based genetic analysis of a representative sample of the accessions held in the HSL.
Materials and methods
A total of 171 accessions were analysed from six crops (Vicia faba L. (33 accessions), Pisum sativum L. (77), Daucus carota L. (12), Cucumis sativus L. (13), Lactuca sativa L. (22) and Brassica oleracea L. var. acephala (DC.) Metzq. (14)) (online Supplementary Table S1). AFLPs were chosen for several reasons. Firstly, because the project required estimations of genetic diversity and relationships between a relatively large number of accessions (200), for six different crops, but not with high numbers of accessions in individual crops. Secondly, AFLPs generate a large number of markers per experiment; providing the high resolution required for distinguishing between closely related taxa, such as crop varieties, and allows a broad sweep of a large number of accessions to look for general patterns of diversity and relationships. Thirdly, AFLPs are cost-effective in both time and resources; partly because it is not necessary to design primers beforehand (Spooner et al., Reference Spooner, van Treuren and de Vincente2005), compared with microsatellites and single-nucleotide polymorphisms (SNPs) (Bensch and Akesson, Reference Bensch and Åkesson2005) and can be used in any species and any genome size (Spooner et al., Reference Spooner, van Treuren and de Vincente2005; Semagn et al., Reference Semagn, Bjornstad and Ndjiondjop2006). Fourthly, relatively small amounts of DNA are required compared with Restriction Fragment Length Polymorphism (Spooner et al., Reference Spooner, van Treuren and de Vincente2005; Semagn et al., Reference Semagn, Bjornstad and Ndjiondjop2006).
In order to determine a broad overview of general patterns within the collection, five individuals per accession were sampled. Replicates totalling 10% for each crop were processed using the system established by Bonin et al. (Reference Bonin, Ehrich and Manel2007). Seed was obtained from the HSL, and two commercial varieties were included for each crop. Plants were grown in field trials at Birmingham in 2008 and 2009. Leaf samples were flash-frozen in liquid nitrogen then stored at −20 °C as individuals.
Six primer pairs identified in previous studies (references in Table 1) were optimized for eight individuals from each crop, with two primer pairs ultimately used for each crop (Table 1). Final selection was done based on trace quality, number of polymorphisms and clarity of informative peaks. Plant tissue was extracted for leaf tissue using the Qiagen DNeasy 96 plant kit as per the manufacturer's instructions (Qiagen, 2006). AFLPs, as described by Vos et al. (Reference Vos, Hogers, Bleeker, Reijans, van de Lee, Homes, Frijters, Pot, Peleman, Kuiper and Zabeau1995), were processed at the Aberystwyth University Institute of Biology, Ecology and Rural Science (IBERS), following their set protocol (Skot et al., Reference Skot, Humphreys, Armstead, Heywood, Skot, Sanderson, Thomas, Chorlton and Sackville Hamilton2005). Briefly, for digestion/ligation (DIG/LIG) each sample digested 5.5 µl of DNA (approximately 20 ng/μl) with 1.00 µl Mse adaptor, 1.00 µl Eco adaptor, 0.1 µl Msel (10 units/μl) and 0.05 µl EcoRI (100 units/μl). Samples were incubated in the PCR machine for 2 h at 37 °C. Pre-amplification of sets of restriction fragments used 1 µl EcoRI + MseI pre-amp primer mix, 15 µl AFLP core mix, and 4 µl diluted DIG/LIG DNA. The PCR reaction was carried out followed by selective amplification with 0.5 µl MseI primer-Cxx (5 µM) per sample, 0.5 µl EcoRI primer-Axx (1 µM) per sample and 1.5 µl diluted pre-amp product per sample and selective PCR reaction. Samples were analysed on the ABI3730xl 16 capillary system. Resulting data were displayed and genotyping performed using GeneMapper (version 4.0). Profiles were normalized in GeneMapper and settings were standardized to include peaks with an average RFU over 50, in the range of 50–500 bp. All individual sample traces were verified manually. Replicates were run on separate plates and analysed blind (following Pompanon et al., Reference Pompanon, Bonin, Bellemain and Taberlet2005).
Table 1. Details of AFLP primer pairs, samples, loci obtained and used, and error rates in six crop species

a Further selection made after removal of other Cucumis species.
b Of final selection.
Genetic diversity metrics were calculated using AFLP-SURV version 1.0 (Vekemans et al., Reference Vekemans, Beauwens, Lemaire and Roldan-Ruiz2002), using Method 4 (‘a Bayesian method with non-uniform prior distribution of allele frequencies’, Zhivotovsky, Reference Zhivotovsky1999; Vekemans et al., Reference Vekemans, Beauwens, Lemaire and Roldan-Ruiz2002). The two methods for measuring genetic diversity deployed in the current study were the proportion of polymorphic loci at the 5% confidence level [proportion of polymorphic loci (PLP) or P] and Nei's gene diversity (or expected heterozygosity – H j) (Lynch and Milligan, Reference Lynch and Milligan1994; Vekemans et al., Reference Vekemans, Beauwens, Lemaire and Roldan-Ruiz2002). AFLP-SURV allows the user to specify whether populations are in the Hardy–Weinberg equilibrium on a scale from completely outbreeding [inbreeding coefficient (FIS) = 0], to completely inbreeding (FIS = 1). Since the current study is on crop plants, a large degree of inbreeding (for type, etc.) is inevitable, even in open-pollinated varieties, therefore the analyses were run with three scenarios: 0, 0.5 and 1. Results between scenarios show the same relationships between accessions, only with increased distance between relationships and higher genetic diversity as degree of outbreeding increases. Since all of the plant species in the study are crops, which have undergone selection and genetic improvement to some extent, the scenario of complete inbreeding (FIS = 1) is presented here, which is a more conservative estimate for outbreeding species. For each crop, Nei's genetic distance measures, calculated in AFLP-SURV, were used to construct a Unweighted Pair Group Method with Arithmetic Mean (UPGMA) dendrogram in Phylip (Felsenstein, Reference Felsenstein1989), using Neighbor and Consense to construct the tree, perform bootstrap analyses, and then visualized in TreeView (Page, Reference Page1996). GenAlEx version 6.0 (Peakall and Smouse, Reference Peakall and Smouse2006) was used to create pair-wise genetic distances from the binary data matrix for measuring genetic distance between individuals (following Huff et al., 1993, in Peakall and Smouse, Reference Peakall and Smouse2006) and to visualize patterns of groupings in Principal coordinates analysis (PCoA). GenAlEx was also used to create PCoA plots for Nei's genetic distance, from a similarity matrix using measures calculated in AFLP-SURV for between-accession distances. Error rates were calculated both as error rate per locus (the ratio between the number of loci and the number of mismatches), and the average error rate per replicates sample pair (the average of the ratios between the number of loci and the number of mismatches between each replicate pair) (Pompanon et al., Reference Pompanon, Bonin, Bellemain and Taberlet2005). This facilitated the removal of error-prone loci and samples and reduction in the number of errors in the dataset (Bonin et al., Reference Bonin, Bellemain, Bronken Eidesen, Pompanon, Brochmann and Taberlet2004; Pompanon et al., Reference Pompanon, Bonin, Bellemain and Taberlet2005).
When assessing potential duplicates, Le Clerc et al. (Reference Le Clerc, Suel and Briard2005) used the criterion of the presentation of one clearly distinctive character to classify an accession as morphologically distinguished. This was used in the current study to discount accessions as duplicates where one marker difference was found. Virk et al. (Reference Virk, Newbury, Jackson and Ford-Lloyd1995) suggest that the distinction of accessions should use two sets of analysis, if they can be distinguished in neither, and then they can be considered duplicates. In the current study, morphological data were used where available to distinguish accessions that were not genetically distinct using the set of markers identified by the current study (data not published).
Results
Satisfactory traces were retrieved for two primer pairs for five out of six of the crops (P. sativum, D. carota, C. sativus, L. sativa and B. oleracea var. acephala), and one primer pair for V. faba (Table 1). The number of polymorphic fragments per crop (Table 1) ranged from 76 in V. faba (particularly low due to the loss of a primer pair), to 286 in C. sativum. Alleles with frequencies nearing 0 or 100% (such as missing a ‘present’ in one sample) were removed to reduce error. The error rates were calculated for each crop (Table 1).
Genetic diversity
A range of genetic diversity values were determined in each of the crop species studied, with some individual accessions exhibiting high genetic polymorphism compared with others. Average expected heterozygosity was highest in V. faba (0.25, standard error (s.e.) 0.01) (Table 2), and lowest in P. sativum (0.06, s.e. 0.003) (Table 2). Average PLP and H j values provided are for heritage accessions only. A full list of genetic diversity measures for all accessions and commercial varieties can be found in online Supplementary Table S1.
Table 2. Genetic diversity measures for HSL accessions calculated in AFLP-SURV using method 4 (Bayesian method with non-uniform prior distribution of allele frequencies); FIS = 1

a Percentage of polymorphic loci at the 5% level within accessions.
b Average expected heterozygosity within accessions (Hj).
In V. faba, F st was 0.31 (s.e. = 0.09) which indicates large population differentiation. The percentage of polymorphic loci ranged from 10.5%, in Beryl, to 76.3% in Red Bristow's. Expected heterozygosity ranged from 0.07, in Beryl, to 0.36 in Brown. The average PLP for all accessions was 57.7%, and average expected heterozygosity was 0.25 (s.e. = 0.01).
In D. carota, F st was 0.34 (s.e. 0.08) between accessions, indicating a large amount of differentiation. The percentage of polymorphic loci ranged from 52.8 in John's Purple to 59.0%, in Giant Improved Flak and Manchester Table. Expected heterozygosity ranged from 0.18 in White Belgium to 0.28, in Giant improved flak. The average PLP for all accessions was 56.7%, and average expected heterozygosity was 0.21 (s.e. = 0.01). Giant Improved Flak was of much higher genetic diversity than all other accessions; although a small sample size was used, s.e. indicates that this accession is higher than the others. Orange-rooted HSL accessions were more heterozygous than white- or purple-rooted accessions.
In P. sativum F st was 0.78 (s.e. = 0.02) which is very high, suggesting little gene flow between accessions. Genetic diversity was generally low; the PLP ranged from 0% in Harold Idle, Holland Capucijner's, Lancashire Lad, Newick, Stokesley, Sutton's Harbinger and Table Talk to 57.5% in Latvian Grey Pea. Expected heterozygosity ranged from 0.02 in Newick to 0.18 in Latvian Grey Pea. Average PLP for all accessions was 11.3%; average expected heterozygosity for all accessions was 0.06 (s.e. = 0.003).
For L. sativa, a very high level of differentiation between accessions was measured (again, potentially indicating little gene flow between accessions) (F st 0.7; s.e. 0.03). The level of genetic diversity varied widely across accessions in the collection, particularly in PLP, but was generally low. PLP ranged from 2.9% in Black Seeded Samara to 69.9% in Soulie. Expected heterozygosity ranged from 0.05 in Black Seeded Samara to 0.18 in Soulie. The average PLP for all accessions was 26.0%, and average expected heterozygosity was 0.10 (s.e. 0.001).
Varietal differentiation was high in C. sativus (F st 0.32; s.e. 014). The level of genetic diversity varied widely across accessions; PLP ranged from 40.3% in 741 Peking China to 77.7%, in Izjastnoi. Expected heterozygosity ranged from 0.15 in 741 Peking China to 0.37 in Izjastnoi. The average PLP for all accessions was 61.4%, and average expected heterozygosity was 0.23 (s.e. = 0.02).
In accessions previously identified in the HSL as B. oleracea var. acephala, F st was 0.7 (s.e. = 0.03) indicating very high differentiation. This was reflected in all genetic distance analyses, with a split in the collection between two groups identified as two separate species: B. oleracea var. acephala (kale) and Brassica napus var. pabularia (leaf rape, Siberian kale or rape kale) (Cartea et al., Reference Cartea, Soengas, Picoaga and Ordas2005). The two species groups had very different genetic diversity levels, with a higher level of genetic diversity in the B. oleracea var. acephala accessions, than the B. napus var. pabularia. The exception to this was Russian/Hungry Gap, which clusters with the B. napus var. pabularia accessions with high bootstrap values, but has higher genetic diversity (online Supplementary Fig. S4i). The average PLP for the B. oleracea var. acephala group was 48.1% and average expected heterozygosity was 0.23. The averages for the B. napus var. pabularia group were 20.6% and 0.23 for PLP and H j, respectively. Asparagus and Uncle Bert's Purple did not have enough individuals to be included in this part of the analysis.
Genetic relationships between HSL accessions of each crop
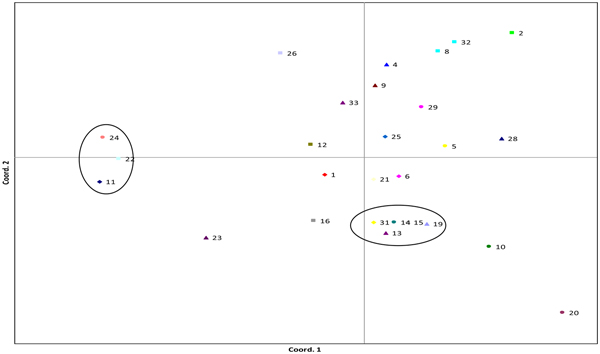
In V. faba, two distinct clusters containing three and five accessions were visible in PCoA (Fig. 1), one within the main distribution of accessions and the other separated by principal coordinate 1 (PC1). The first two principal co-ordinates (PC1 and PC2) explained 25.62 and 21.89% of the variance, respectively. The most genetically distant accessions were Seville (24), Red Bristow's (22) and Estonian (11) which formed a cluster separated from the other accessions based on PC1. This cluster was also supported in UPGMA cluster analysis using Nei's genetic distance (online Supplementary Fig. S1). Painswick Wonder (20) and Crimson Flowered (10) were separated out by PC2.
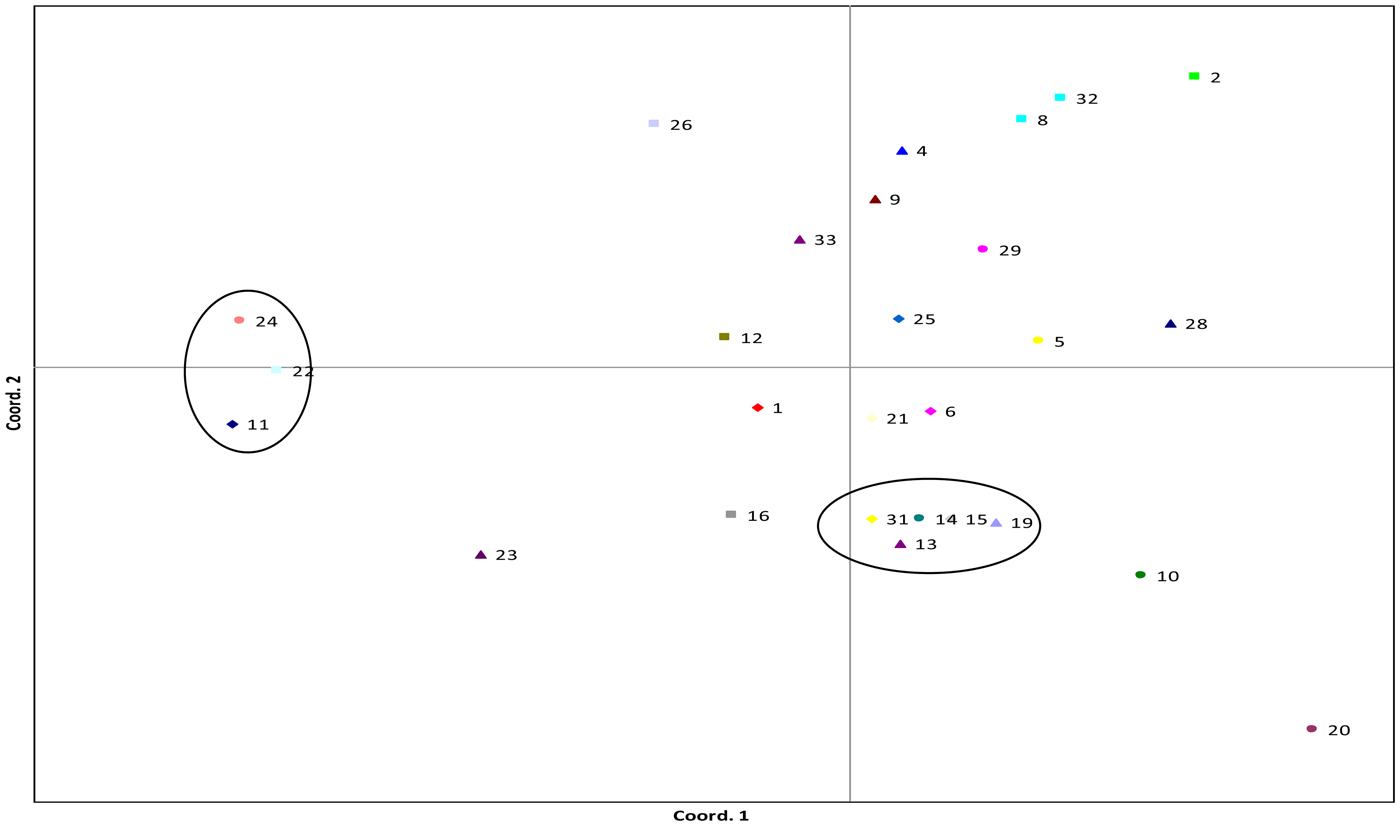
Fig. 1. PCoA plot of V. faba accessions, data from one AFLP primer pair, 76 loci and three–five individuals sampled per accession. Cumulative variation explained within the first two principal co-ordinates was 25.62 and 47.51%. Numbers represent accessions; full list is given in online Supplementary Table S1. Commercial varieties are denoted by ‘cv’. Circles highlight clusters. Bacardi (1), Beryl (2), Bossingham Long Pod (4), Bowland's Beauty (5), Brown (6), Chak'rusga (8), Cretian (9), Crimson Flowered (10), Estonian (11), Gloucester Champion (12), Jack Gedes (13), Jonah's (14), Londonderry (15), Martock (16), Mr Townend's (19), Painswick Wonder (20), Perovka (21), Red Bristow's (22), Rent Payer (23), Seville (24), Somerset (25), Stafford (26), The Sutton (cv) (28), Sweet Lorraine (29), White Continental (31), Canadian Purple (32), Gloucester Bounty (33).
In D. carota, PC1 and PC2 cumulatively explained 50.17% of the variance. Two accessions, Afghan Purple (1) and John's Purple (6) clustered together based on the PC1. This cluster was also seen in the genetic distance dendrogram, with the Afghan Purple and John's Purple cluster having a bootstrap value of 96.2%. White Belgian clustered in with the orange accessions (online Supplementary Fig. S5).
In P. sativum, PC1 and PC2 cumulatively accounted for 51.90% of the variance. Accessions were distributed widely across the PCoA plot, with one large cluster and several smaller clusters observable. The largest cluster, separated by PC1, contained 13 accessions along with a sub-cluster of 15 more densely grouped accessions. The accessions in the tighter PCoA cluster were also seen in the UPGMA cluster analysis. Those pairs of accessions with short genetic distance included Carruther's Purple Podded and Dwarf Defiance/John Lee; Champion of England and Veitch's Western Express; Harold Idle and Panthers; Doug Bray of Grimsby and Tutankhamun and Mummy's and Prew's Special (online Supplementary Fig. S6).
In L. sativa accessions, PCoA resulted in clusters of two or three accessions. Accessions were regularly distributed along the length of PC1, with PC2 separating out Soulie (17), Iceberg (commercial variety; 18) and Windermere (22), in particular. PC1 and PC2 explained 49.17% of the cumulative variance (Fig. 2). The clustering of accessions Bunyard's Matchless (7) and George Richardson (9), and Loos Tennis Ball (12) and Mescher (14) were also supported in the UPGMA cluster analysis (online Supplementary Fig. S2).

Fig. 2. PCoA plot of L. sativa accessions, data from 2 AFLP primer pairs, 103 loci, 4–5 individuals sampled per accession. Cumulative variation present in the first three PCs was: 27.99, 49.17 and 66.66% respectively. Numbers represent accessions; full list in online Supplementary Table S1. Commercial varieties denoted by ‘cv’. Circles highlight clusters. Asparagus (1), Bath Cos (2), Black Seeded Samara (3), Bronze Arrow (4), Brown Bath Cos (5), Brown Goldring (6), Bunyard's Matchless (7), Burpee's Iceberg (8), George Richardson (9), Laitue Cracoviensis (11), Liller (10), Loos Tennis Ball (12), Maroulli Cos (13), Mescher (14), Northern Queen (15), Rouge D'Hiver (16), Soulie (17), Iceberg (cv) (18), Corsair (cv) (19), Stoke (20), White Seeded Samara (21), Windermere (22).
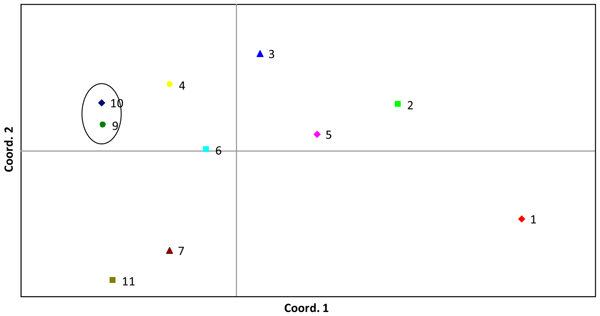
In C. sativus, the closest clustering accessions are Sigmadew (9) and Telegraph Improved (commercial variety; 10). 741 Peking China (1) was separated from the other accessions by PC1. King of the Ridge (7) and Burpless Tasty Green (commercial variety; 11) were separated by PC2 (Fig. 3). The variance explained by PC1 and PC2 was 42.11 and 26.31%, respectively. The two clusters mentioned above were reflected in the UPGMA analysis (online Supplementary Fig. S3) with high bootstrap values.

Fig. 3. PCoA plot of C. sativus accessions, data from two AFLP primer pairs, 139 loci, four–five individuals sampled per accession. Cumulative variation explained in the first three PCs was: 42.11, 68.42 and 78.76%, respectively. Numbers represent accessions; full list is given in online Supplementary Table S1. Commercial varieties denoted by ‘cv’. Circles highlight clusters. 741 Peking China (1), Jordanian (2), Butcher's Disease Resisting (3), Dekah (4), Izjastnoi (5), Boothby's Blond (6), King of the Ridge (7), Sigmadew (9), Telegraph Improved (cv) (10), Burpless Tasty Green (cv) (11).
As mentioned above, seven B. oleracea var. acephala accessions were re-identified as B. napus var. pabularia. PC1 and PC2 explained 65.66 and 10.45% of the variance present within the B. oleracea var. acephala and B. napus var. pabularia accessions (Fig. 4). The UPGMA analysis separated B. oleracea var. acephala and B. napus var. pabularia accessions into two clusters (online Supplementary Fig. S4). The first cluster had long branch-lengths indicating higher genetic distance, with well supported nodes. The second cluster had much shorter branches, indicating less genetic distance.

Fig. 4. PCoA plot of B. oleracea var. acephala and Brassica napus var. pabularia accessions, data from two AFLP primer pairs, 118 AFLP loci, two–five individuals sampled per accession. Cumulative percentage of variation explained within the first three PCs was 65.66, 76.11 and 84.11%, respectively. Numbers represent accessions; full list is given in online Supplementary Table S1. Commercial varieties denoted by ‘cv’. Circles highlight clusters. Asparagus Marshall Curtis Mill (2), Canadian Ragged Jack (3), Georgia Southern Collared (4), Madeley (5), Marrowfat Greens (6), Ragged Jack (7), Red Russian (8), Russian/Hungry Gap (9), Spis Bladene (11), Redbore (cv) (12), Dwarf Green Curled (cv) (13), Tall Kale (14).
Comparison of HSL accessions with commercial varieties
Comparisons of the diversity found in heritage varieties with that found in commercial varieties did not show a consistent pattern (online Supplementary Table S1). Genetic diversity in commercial varieties of V. faba, D. carota and L. sativa analysed was below the overall average for each crop. In both P. sativum and C. sativum, one commercial variety was below average (Kelvedon Wonder and Burpless Tasty Green, respectively) and the other was just above or average (Early Onward and Telegraph Improved, respectively).
Potential duplicates
UPGMA cluster analysis was used in combination with morphological data (not published) where available, to identify potential duplicate accessions. Four pairs were identified (online Supplementary Table S2): B. napus var. pabularia – Ragged Jack/Red Russian; L. sativa – Brown Bath Cos/Brown Goldring, and Bunyard's Matchless/George Richardson and P. sativum – Lancashire Lad/Stephen's.
Genetic analysis indicated duplication but this was not corroborated by the morphological data in other crops (V. faba – Red Bristow and Seville; C. sativus – Sigmadew/Telegraph Improved; and P. sativum – Carruther's Purple Podded/Dwarf Defiance/John Lee; Victorian Purple Podded/Lancashire Lad/Stephen's; Champion of England/Veitch's Western Express; Prince of Prussia/Jeyes/Ostgotaart and Prean/Cooper's Bean Pea).
No morphological data were available for B. napus var. pabularia and L. sativa.
Discussion
The heterogeneous origin of heritage varieties (Preston et al., Reference Preston, Maxted, Sherman, Munro, Ford-Lloyd and Maxted2012) and the diverse origins of the accessions from the HSL would imply that a range of genetic diversity values may be expected. This study indicated that the collection contains a range of genetic diversity values within crops, with accessions of comparatively high diversity found in all of the six sampled crop species. Generally, the genetic diversity found within crops reflected the breeding system dictated by the crop physiology (high genetic diversity was seen in outbreeding crops (e.g. D. carota and V. faba), and lower relative genetic diversity in inbreeding crops (e.g. P. sativum and L. sativa)) and cultivation history of the crop (e.g. the narrowing of the genetic base due to strong selection for desirable traits, such as root colour in some D. carota).
Varietal differentiation levels (F st) are also broadly consistent with previous studies (Hamrick and Godt, Reference Hamrick and Godt1996), although levels of differentiation between populations were proportionally higher for all crops compared with previous studies (Loveless and Hamrick, Reference Loveless and Hamrick1984; Hamrick and Godt, Reference Hamrick and Godt1996). For genetic diversity, although the inclusion of different accessions and different numbers of accessions between studies can make comparisons difficult (Sanz et al., Reference Sanz, Gonzalez, Syed, Suso, Saldaña and Flavell2007), levels found here were comparable with previous studies in V. faba (Ouji et al. (Reference Ouji, Rouassi, Abdellaoui and El Gazzah2011) (isozymes), Sanz et al. (Reference Sanz, Gonzalez, Syed, Suso, Saldaña and Flavell2007) (sequence-specific amplification polymorphism transposons), Zong et al. (Reference Zong, Guan, Wang, Ren, Lui, Paull and Redden2010) (AFLPs) and Ouji et al. (Reference Ouji, Rouassi, Abdellaoui and El Gazzah2011) (isozymes)), D. carota (Shim and Jorgensen, Reference Shim and Jorgensen2000 and St Pierre and Bayer, Reference St Pierre and Bayer1991); and P. sativum (Simioniuc et al., Reference Simioniuc, Uptmoor, Friedt and Ordon2002). In L. sativa, lower average expected heterozygosity values were found than those reported in van Treuren and van Hintum (Reference van Treuren and van Hintum2009), however the individual expected heterozygosities of each lettuce type are of comparable range. L. sativa is predominantly self-fertilizing (although some cross pollination may take place and lead to heterozygotes (van Treuren et al., Reference van Treuren, de Groot, Boukema, van de Wiel and van Hintum2010)), therefore low heterozygosity is in accordance with expectations (Jansen et al., Reference Jansen, Verbakel, Peleman and van Hintum2006). High varietal differentiation was found in C. sativus accessions; the level of genetic diversity varied widely across accessions, and were slightly higher than Staub et al. (Reference Staub, Dane, Reitsma, Fazio and Lopez-Sese2002) (isozymes). The two Brassica species groups had very different genetic diversity levels, with the B. oleracea var. acephala group much higher than B. napus var. pabularia, reflecting relative outbreeding and inbreeding nature of each crop respectively (Gowers, Reference Gowers and Bradshaw2010).
Some accessions exhibited clustering in the analyses. Possible factors causing this, due to the unknown nature of the accession backgrounds, could not be linked back to any geographical data, but other possible causative factors can be discussed.
D. carota accessions clustered primarily in accordance with root colour (purple and orange). The current study was unable to resolve orange-root colour relationships; this may be due to the overlapping nature of the diversity present. Clotault et al. (Reference Clotault, Geoffriau, Lionetton, Briard and Peltier2010) discuss the split in carrot accessions between eastern and western carrots with reference to microsatellites (simple-sequence repeats) and SNPs, and found purple carrots tend to cluster in the eastern group. The clusters found in the current study may reflect this.
L. sativa genotypes are generally arranged into seven cultivar-groups: butterhead, cos, latin, crisphead, oilseed, cutting (leafy) and stalk (or asparagus) (deVries, Reference deVries1997). In the current study, highly supported nodes in L. sativa were within lettuce types, except for Rouge D'Hiver and Bronze Arrow, which are cos and leafy types respectively. Yang et al. (Reference Yang, Jang and Kim2007) also did not separate leafy and cos accessions. The practice of mixing lettuce types to obtain new varieties may have led to genuine blurring of these lettuce-type boundaries and increasing complexity of these relationships (van Treuren and van Hintum, Reference van Treuren and van Hintum2009).
For C. sativus accessions, the history of the accessions held is not known; therefore, it is only possible to speculate as to the reasons for clusters. The name of the 741 Peking China accession suggests it could originate from China and therefore could represent a different gene pool; in previous studies Chinese germplasm has been compared with others and has grouped separately (Staub et al., Reference Staub, Serquen, Horejsi and Chen1999).
Previous studies have found that B. oleracea var. acephala accessions cluster based on geographic origin, for example Okumus and Balkaya (Reference Okumus and Balkaya2007) and Zeven (Reference Zeven1998) (in closely related perennial kale (B. oleracea var. ramosa)). Both of these studies found relatively low levels of intra-varietal variation. These studies differ to those results from Christensen et al. (Reference Christensen, van Bothmer, Poulsen, Maggioni, Phillip, Andersen and Jorgensen2011), who found a continuous range of genetic diversity, with higher levels in those accessions still widely in cultivation. This was attributed to gene flow due to either cross-pollination or farmer seed exchange. Since detailed background information for many HSL B. oleracea var. acephala accessions is unavailable, a geographical component cannot be investigated.
In V. faba no large clusters formed, there were few highly supported nodes and large genetic distances between most accessions. This may reflect a general high level of genetic diversity, low resolution due to the small number of loci used, and the possible overlaps in genetic variation between accessions and low genetic structure found V. faba which has been seen in previous AFLP studies (Hamrick and Godt, Reference Hamrick and Godt1996; Zeid et al., Reference Zeid, Schon and Link2003; Zong et al., Reference Zong, Lui, Guan, Wang, Lui, Paull and Redden2009, Reference Zong, Guan, Wang, Ren, Lui, Paull and Redden2010; Duc et al., Reference Duc, Bao, Baum, Redden, Sadiki, Suso, Vishniakova and Zong2010). This is due to out-crossing and plant breeding methods, with individuals forming a continuum of points rather than discrete clusters.
Although the background of many heritage varieties is unknown (Preston et al., Reference Preston, Maxted, Sherman, Munro, Ford-Lloyd and Maxted2012) it has been proposed that the genetic diversity of heritage varieties is on a spectrum, between that of landraces sensu stricto and modern varieties (Shim and Jorgensen, Reference Shim and Jorgensen2000; Archak et al., Reference Archak, Karihaloo and Jain2002). This was found in the current study in V. faba, L. sativa, B. oleracea var. acephala and D. carota. In C. sativus and P. sativum, those commercial varieties that were found to be more diverse, were either an older variety themselves (Early Onward) or were closely related to older open-pollinated varieties (Telegraph Improved) (Suttons, 2008).
Since the HSL has grown ‘organically’, with accessions of unknown provenance added through ad hoc gifts, the collection could be vulnerable to duplication of accessions, particularly if original accession names are not retained. It is therefore unsurprising that in this study a small number of duplicate accessions were identified.
The overall conclusion is that the HSL collection holds a unique and broad spectrum of crop genetic diversity. Many accessions have been maintained by HSL since its beginning in 1975, including both ex-commercial varieties and heirloom varieties which have never been commercially available (Stickland, Reference Stickland2008). Its genetically unique nature confirms the value of the collection as a potential source of traits for crop improvement, and as a valuable resource for those interested in actual production through cultivation of these diverse crop accessions.
Genetic characterization of accessions has implications for the HSL in terms of managing the collection and conserving accessions representing diversity and distinctness. These results are useful for the identification of particularly distinct heritage varieties (e.g. Tall Kale, Rent Payer pea and Windermere lettuce) that could be highlighted to growers. It has also identified potential duplicates, which following further investigation by field trials or expert consultation, could be excluded from the collection or used for comparison when considering genetic drift. In the wider context, the current study contributes to a better understanding of the importance of varieties developed by both small-scale breeders, including local firms (more prominent in the past and responsible for the breeding of many of these heritage varieties) and individual heirloom growers, and thus the importance of maintenance of their varieties, either in situ, with the person/company that developed it, or ex situ (Kell et al., Reference Kell, Maxted, Allender, Astley and Ford-Lloyd2009). The study also highlights the potential importance of those varieties removed from seed catalogues (either due to competition from other varieties, including the emergence of improved varieties or due to small circulation), and their conservation to maintain a broad range of diversity for present and future use.
The wider picture of genetic erosion encompasses the potential replacement of diverse landraces by a small number of elite cultivars (Veteläinen et al., Reference Veteläinen, Maxted, Negri, Veteläinen, Negri and Maxted2009). Heritage varieties are, in the broad definition, landraces (Preston et al., Reference Preston, Maxted, Sherman, Munro, Ford-Lloyd and Maxted2012). In identifying which crops and crop varieties to conserve, it is optimal to conserve as broad a range as possible, with outliers being of particular importance, with representative samples from highly diverse accessions, genetically distant and distinct accessions to allow choice and option value for future challenges and continuing use (Negri and Tiranti, Reference Negri and Tiranti2010). These are exactly the crops and crop varieties shown to be present in the HSL collection and underline its value as a national and global plant genetic resource. This research also serves to highlight the importance of small seed-saving organizations in conservation and scientific research (as suggested by Gepts, Reference Gepts2006), the importance of the collection through its accessibility to members, as well as of home gardens as potential reservoirs of agrobiodiversity, including landraces, relics and heirlooms (Galluzzi et al., Reference Galluzzi, Eyzaguirre and Negri2010), with the role of ex situ collections vital as a complementary measure to in situ, particularly in varieties that are already no longer in agricultural use (Esquinas-Alcazar, Reference Esquinas-Alcazar2005).
Given the unique nature of this research in identifying potential patterns of genetic diversity held in a heritage landrace collection, it is valuable to draw out some recommendations to benefit crop diversity conservation. (1) The exceptional value of heritage landrace collections in maintaining unique, highly diverse crop diversity, which is valuable for use by gardeners, farmers and plant breeders, may have been under-valued previously. These collections should be included alongside more formal gene bank holdings as an important component of national plant genetic resources for food and agriculture (PGRFA) collections. (2) The exceptional value of heritage landrace collections justifies conservation support by government in the same way as other more formal genetic resource collections. (3) Heritage landrace collections harbour unique allelic diversity that is not represented in more formal genebanks; yet they do not have the equivalent long-term resource commitment to sustain the collections. It is therefore advisable that this unique diversity is represented in new or existing genebanks. (4) Although recognizing the difficulty for heritage landrace collections in raising resource for genetic characterization, the value of such analysis to the collection should be stressed: in terms of (a) identifying unique diversity not duplicated in other genebanks, (b) establishing a core collection for external utilization and duplication, (c) identifying duplicate accessions or duplicates of commercially available varieties within the collection and (d) providing characterization and evaluation to aid collection users to select accessions for cultivation. (5) Garden hobbyists maintain and populate heritage collections; they are often the last refuge of crop varieties lost from commercial production or landraces whose commercial value is not significant nationally. This means that they have a unique place in crop conservation and there is potential for further inclusion of novel heritage varieties into collections to help ensure systematic maintenance and preservation of an inimitable genetic resource for humankind.
Supplementary material
The supplementary material for this article can be found at https://doi.org/10.1017/S1479262118000448
Acknowledgements
This work was funded by The Lillian Goldman Charitable Trust. AFLP laboratory work was carried out by Kirsten Skot at Aberystwyth University Institute of Biological, Environmental & Rural Sciences (IBERS). The corresponding author would also like to thank Mr Damian Ballam for assistance and editorial comments during the course of this research and the preparation of this manuscript.