The methods applied in this project to characterize raw clays and to determine pottery-production technology have already been successfully employed for ancient ceramics in several areas, including the Mediterranean (De Bonis et al., Reference De Bonis, Cultrone, Grifa, Langella and Morra2014; Rodríguez et al., Reference Rodríguez, Bermúdez Coronel-Prats, Barone, Cultrone, Mazzoleni and Tanasi2015). Previous studies on ceramic firing techniques have assessed the direct relationship between heating rate and changes in mineral assemblages (Maritan et al., Reference Maritan, Nodari, Mazzoli, Milano and Russo2006; El Ouahabi et al., Reference El Ouahabi, Daoudi, Hatert and Fagel2015). Carbonate and silicate phase reactions during ceramic firing have also been explored widely (Dondi et al., Reference Dondi, Ercolani, Fabbri and Marsigli1998; Rathossi & Pontikes, Reference Rathossi and Pontikes2010a,Reference Rathossi and Pontikesb). The presence of pottery kilns also poses questions about the use of local Ca-rich or Ca-poor raw clay materials for different products (Eramo & Maggetti, Reference Eramo and Maggetti2013).
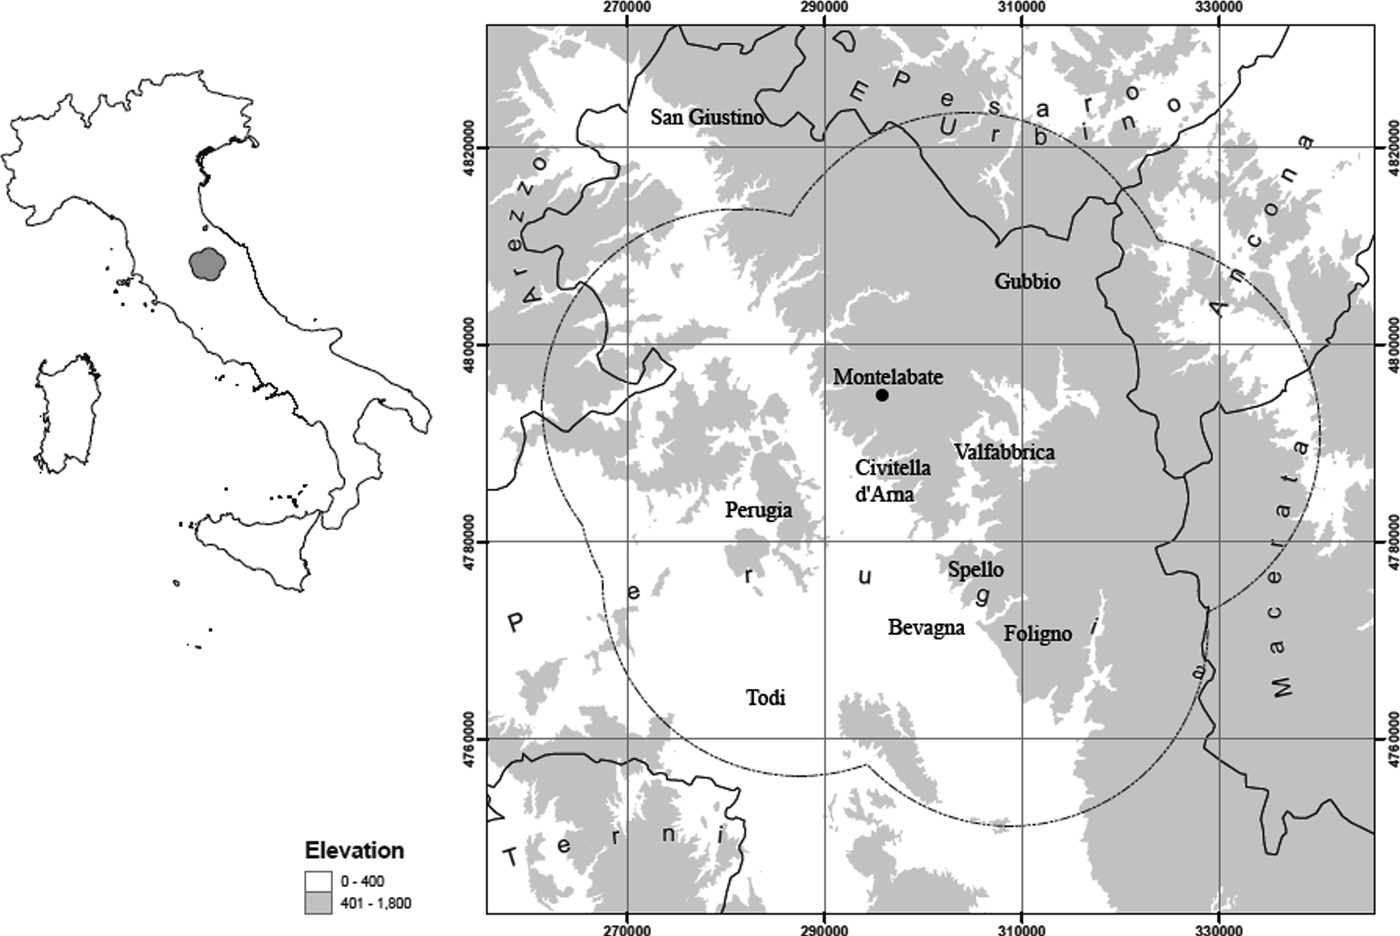
A recent excavation at Montelabate (Perugia, Umbria, Italy) uncovered five Roman kilns (Ceccarelli, Reference Ceccarelli2017). The site is situated 30 km northeast of Perugia, in a valley characterized by a series of gentle hills, 250–300 m above sea level (Fig. 1). The valley is overlooked by the Benedictine Abbey of S. Maria di Valdiponte, today owned by the Gaslini Foundation. The complex is a rare discovery in the Upper Tiber valley as it is the only pottery-production site in the area that has been stratigraphically excavated. Therefore, the site offers a unique opportunity to study the manufacturing technical processes and offers new insights into the technology of production and circulation of ceramics in Regio VI (Umbria) for over five centuries. Based on the chronology of the ceramics produced at the site, especially the amphorae, the kilns were in use at least from the late 1st century BC to the late-4th to 5th centuries AD (Ceccarelli, Reference Ceccarelli2017).

Fig. 1. Map of the location of Montelabate (Italy; base map courtesy of David Redhouse).
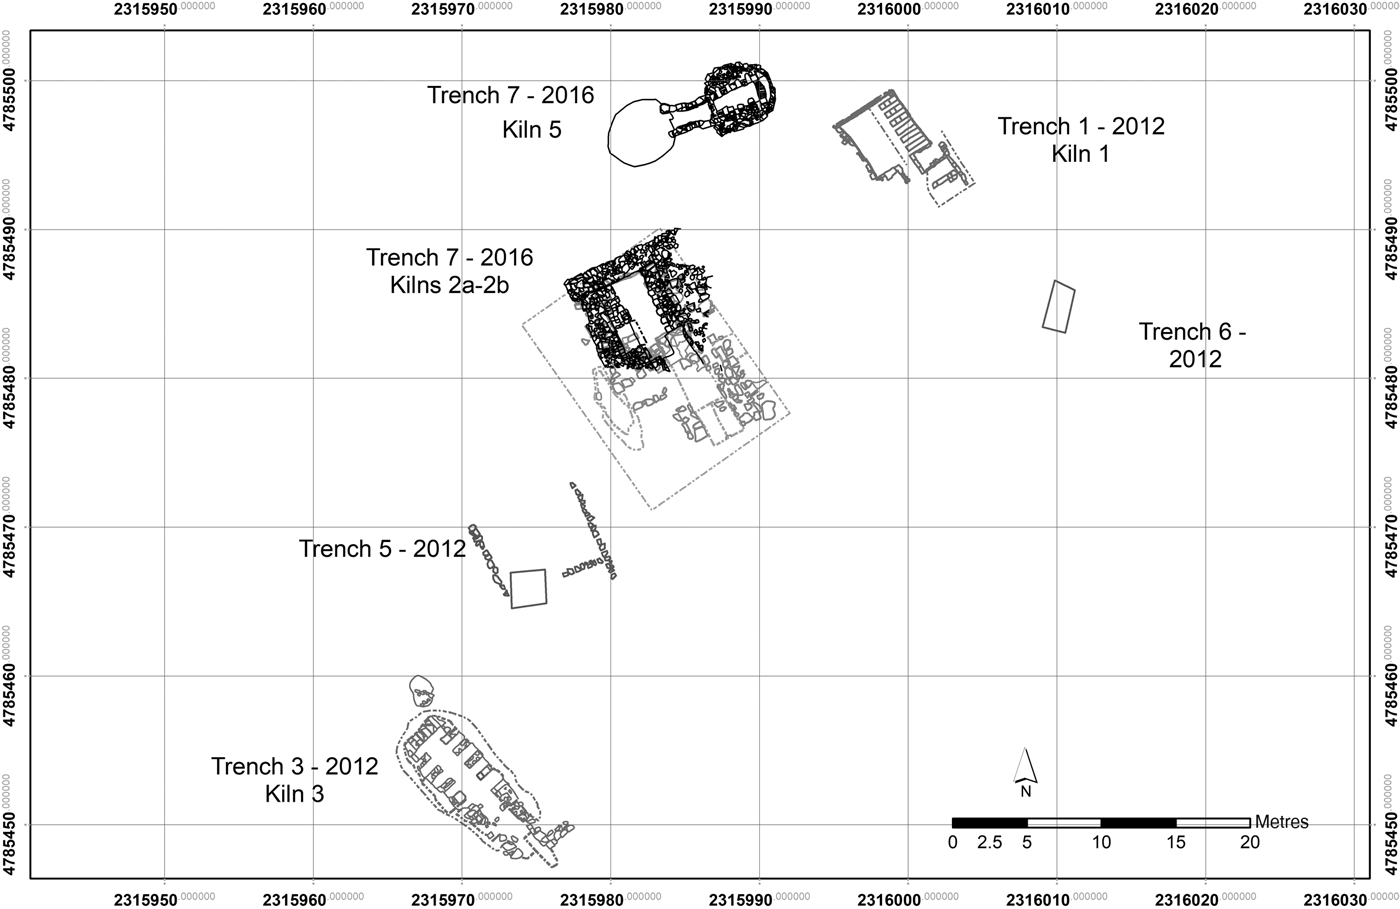
The most important aspect of this pottery workshop is the spatial distribution of the kilns and other manufacturing facilities, constructed around a substantial clay bed, sampled extensively for the analyses presented here.
Three of the kilns (kilns 1, 2a and 2b; Fig. 2) were located on the summit of the hill in a north–south orientation, probably to create an updraft favourable to the firing process. On the top of the hill there was also a round kiln (kiln 5; Fig. 2) with a west–east orientation. Another kiln (kiln 3; Fig. 2) was located further down the hill with a north–south orientation and an elongated combustion chamber, which was probably used to increase the draft. Only the underground part of the excavated kilns is preserved, due to the shallow overburden (~30–40 cm) and their past exposure to regular ploughing. The combustion chambers consisted of external walls built with fired bricks and mortar, whilst the construction of the arches supporting the perforated floor and firing chambers made extensive use of mud-bricks. The stocking-hole (or praefurnium) of each kiln was also preserved: it was constructed from low brick walls covered by a brick arch that led to the combustion chamber where the fuel was placed. Outside of the kilns, there were several associated work surfaces made of flat limestone blocks. Three pottery dumps were also excavated, the most relevant for this contribution being the dump in front of kiln 5 and dump 6 excavated along the road (Ceccarelli, Reference Ceccarelli2017).

Fig. 2. Spatial distribution of the kilns in the pottery workshop of Montelabate (Italy).
This paper focuses mainly on the clays used for the production of flat-bottomed amphorae, known as Spello-type, Ostia III, 369-70/II, 521 or Altotiberine, which were generally produced from the Tiberian–Claudian period to the end of the 2nd century AD and perhaps also in the early 3rd century AD. The shape of these small wine containers was ideal for medium-range overland and, in particular, river transport (Panella, Reference Panella1989). Moreover, the morphology met the short-term needs of wine consumption without the need for decanting; these amphorae were thus the final containers of the product, the preferential markets of which appear to have been Rome and Ostia.
MATERIALS
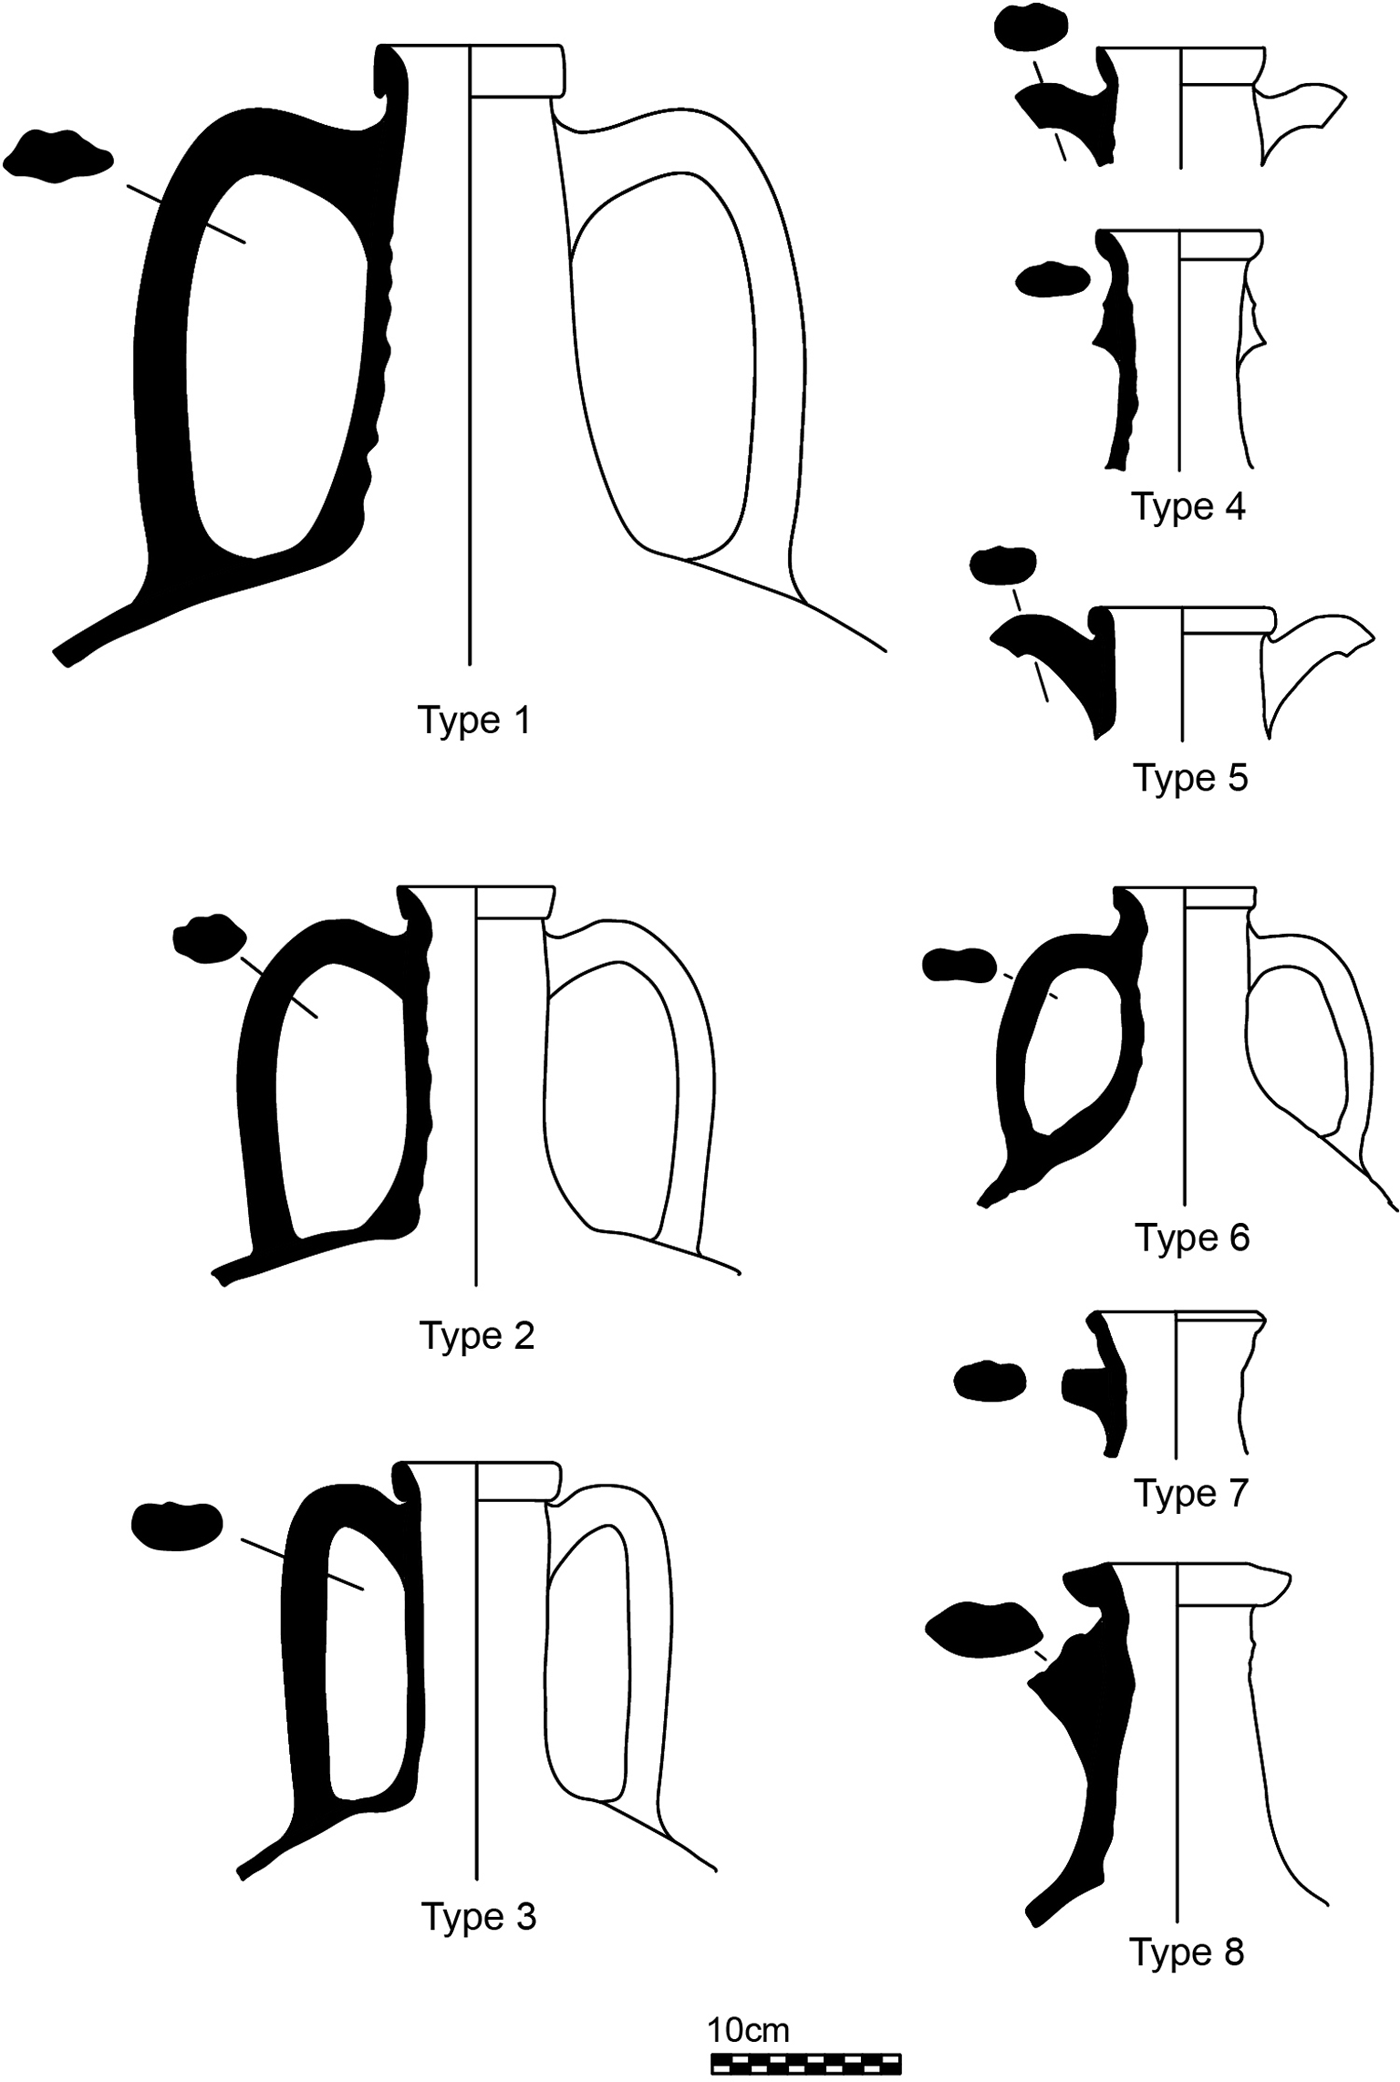
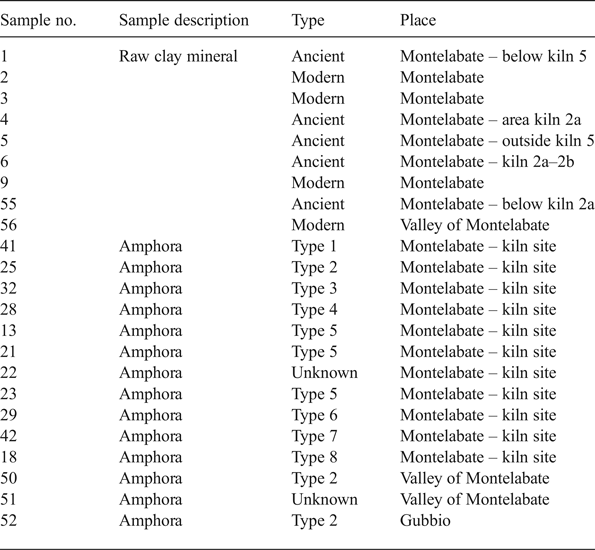
Nine raw clays and a selection of 11 fired, discarded samples were analysed, representing the full diagnostic group of all the amphorae produced at Montelabate. The samples are listed in Table 1, where the sample number (used throughout the text) and information on the area of discovery are also reported, whilst the amphorae typology in Fig. 3 follows Ceccarelli (Reference Ceccarelli2017).

Fig. 3. The typology of amphorae produced at Montelabate.
Table 1. Description of the samples analysed.

Samples 1–6, 9, 55 and 56 correspond to ancient and modern raw clays sampled near to the site to verify the hypothesis of the exploitation of a rich local clay source that allowed a continuity of production. The following samples represent all the amphorae types shown in Fig. 3: sample 41 is a type 1 amphora with a vertical band rim and a cylindrical neck. Sample 25 is a type 2 amphora with everted rounded band rim and a cylindrical neck that thickens where the handles attach. Sample 32 is a type 3 amphora with an everted band rim, tapered at the lip with a groove inside. Sample 28 is a type 4 amphora with an everted band rim and a tapered lip with the upper attachments of the handles below the rim. Samples 13, 21 and 23 are type 5 amphorae with a slightly thickened oval rim and the upper attachments of the handle just beneath the rim. Sample 29 is a type 6 amphora with an everted band rim and a handle with an unusual single longitudinal groove and a flattened oval section. Sample 42 is a type 7 amphora with a very short rounded rim and a squared section. Sample 18 is a type 8 amphora with an unusual triangular rim and flattened handles with two longitudinal grooves. In addition to these groups, three samples of the same type of amphorae from other sites, dated from the mid-first to the end of the second centuries AD, were included to compare discarded samples with good-quality vessels. These include samples 50 and 51 that come from the survey of a Roman farm located 4 km from the production site (Stoddart et al., Reference Stoddart, Barone, Bennett, Ceccarelli, Cifani, Clackson, della Giovampaola, Ferrara, Fulminante, Licence, Malone, Matacchioni, Mullen, Nomi, Pettinelli, Redhouse and Whitehead2012) and sample 52 from the excavation of San Marco Romano at Gubbio (Whitehead, Reference Whitehead, Stoddart and Malone1994), located 30 km northwest of Montelabate.
METHODS
Both unfired (raw clays) and fired (amphorae) samples were analysed using X-ray powder diffraction (XRD), X-ray fluorescence (XRF), thermogravimetric and differential thermogravimetric analysis (TG-DTG) and Fourier-transform infrared (FTIR) spectroscopy.
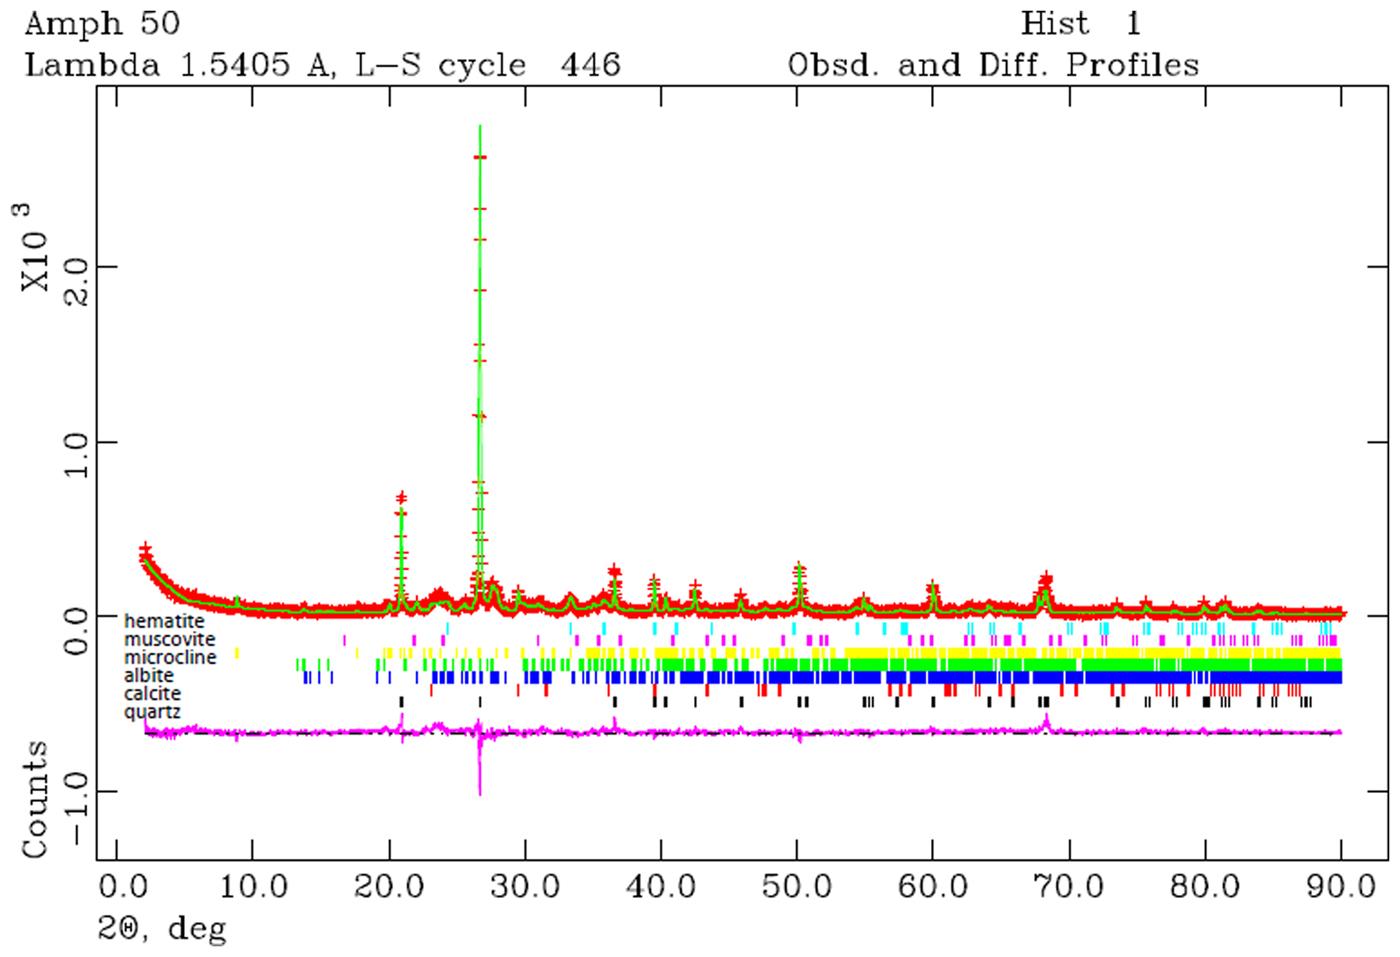
The XRD patterns were recorded with a Bruker D8 Advance diffractometer using graphite-monochromated Cu-Kα radiation, a scan step of 0.02°2θ and a scanning time of 12 s per step. Qualitative analysis of the XRD traces was performed with the program X'Pert High Score Plus (PANalytical BV) and quantitative analysis was performed with Rietveld refinement using the GSAS code (Larson & von Dreele, Reference Larson and von Dreele1994). The refined variables included the background, scale factor, lattice parameters and two profile parameters for each phase, with the exception of quartz, where the lattice parameters were kept constant throughout the refinements in order to act as an internal reference. The Gaussian profile parameters were fixed for all phases and all refinements, and only two Lorentzian profile parameters for each phase were allowed to describe the line shapes. The refinements resulted in average values of χ2 = 2.59 and of Rwp = 0.22, with limited variation of values. An example of the goodness of fit is reported in Fig. 4.

Fig. 4. Example of Rietveld refinement of an amphora.
In situ XRF spectra were collected with a portable Bruker Tracer III-SD spectrometer. All spectra were collected at 40 keV and 10.70 μA with a collection time of 30 s following preliminary optimization. Quantitative data were obtained with a customized calibration (Ceccarelli et al., Reference Ceccarelli, Rossetti, Primavesi and Stoddart2016). The sampling strategy consisted of analysis of sections prepared by making a fresh break to avoid any chemical contamination (cf. Hunt & Speakman, Reference Hunt and Speakman2015). The effective measured spot size was 8 mm and the analysis was conducted with six readings on different spots to overcome the heterogeneity limits of the fabric, clay and temper. Compositional analysis was performed on the calculated average net counts and calibrated. Thermal analysis measurements (TG-DTG) were performed with a DTA-TG SEIKO 6300 thermal analyser, using air in the temperature range of 25–1000°C and a heating rate of 10°C/min. The FTIR spectra were recorded with a Jasco mod. 615 Spectrometer, using the KBr pressed-disk technique in the spectral range 1600 to 500 cm–1. The samples were ground in an agate mortar and mixed with spectroscopic-grade KBr (Aldrich) at a 1:350 sample:KBr ratio. The mixture was pressed using a uniaxial press (10 tons) under vacuum for 5 min.
Geotechnical soil analyses of the natural clays were performed to evaluate critical factors in the production of ceramics such as particle-size distribution, plasticity and shrinkage behaviour during the drying process. In particular, the particle-size distribution was analysed to provide information about the discrete classes of particle sizes in the soil. The size of the different fractions was obtained by sieve or hydrometer (sedimentation) analysis depending on the particle dimensions. Sieve analysis, applicable for grains retained by the ASTM No. 200 sieve (0.075 mm), was performed by passing a representative soil sample through a nest of sieves of decreasing aperture (with a mesh size starting from 2 mm) (ASTM D422, 2007). The hydrometer was used to estimate the distribution of finer grains down to 0.01 mm by application of the Stokes’ law to analyse the different settlement velocities of grains after mechanical dispersion of the sample in water. The sieve and hydrometer tests were executed in accordance with ASTM D422 (2007), using hexametaphosphate to disperse the particles thoroughly. The grain density (i.e. the mass per volume unit of solid soil components excluding voids and water) provides key information for the hydrometer test. The grain density depends heavily on the mineral and organic soil components and may complete the information about soil composition and origin. Grain density was determined by the Pycnometer method (ASTM D854, 2014). The Atterberg limits provide a measure of the plasticity range of a fine-grained soil. The index of plasticity (IP) is defined as the difference between the liquid limit (LL) and the plastic limit (PL). The LL identifies the moisture content above which the soil starts to behave as a viscous liquid, while the PL corresponds to the water content below which the system shows little plasticity and becomes brittle. The LL of the selected clays was determined by the Casagrande method, whilst the PL was determined by evaluating the breakage occurrence in rolling a soil worm on a ground glass plate, using the heel of the hand, to a thickness of 3 mm (ASTM D4318, 2017). Both the LL and PL were evaluated for a specific soil size fraction by passing them through a no. 40 sieve (0.425 μm). The moisture content in each test was measured by the oven method (ASTM D2216, 2010).
RESULTS AND DISCUSSION
Unfired materials
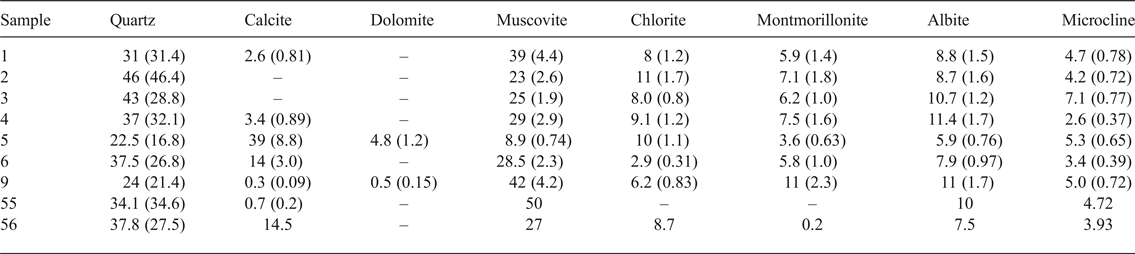
The raw clays consist of quartz, phyllosilicates (muscovite, chlorite and montmorillonite), plagioclase and K-feldspars (Table 2). Calcite and dolomite are present in some samples. The actual assemblage of clay minerals may be more complex due to the presence of interstratified clays that were not included in the Rietveld fitting. In addition to the phase abundance (wt. %) obtained from the Rietveld analysis under the assumption that the samples consisted entirely of crystalline phases, Table 2 also reports the scale factor determined for each phase. For samples with similar elemental compositions and absorption coefficients, the scale factor is proportional to the phase abundance even in the presence of variable amounts of amorphous phases, or in the case of minor crystalline phases not accounted for, which would affect the quantitative results (Klug & Alexander, Reference Klug and Leroy1974).
Table 2. Phase compositions as determined by XRD Rietveld refinement of raw materials (wt.%). Scale factors in parentheses.

The lack of correlation between chlorite and muscovite and the absence or scarcity of montmorillonite in samples 55 and 56 suggest the exploitation of different raw clays, both calcareous and non-calcareous. Carbonates, mainly calcite (14–39%), are noticeable in clay samples 5, 6 and 56 (Table 2).
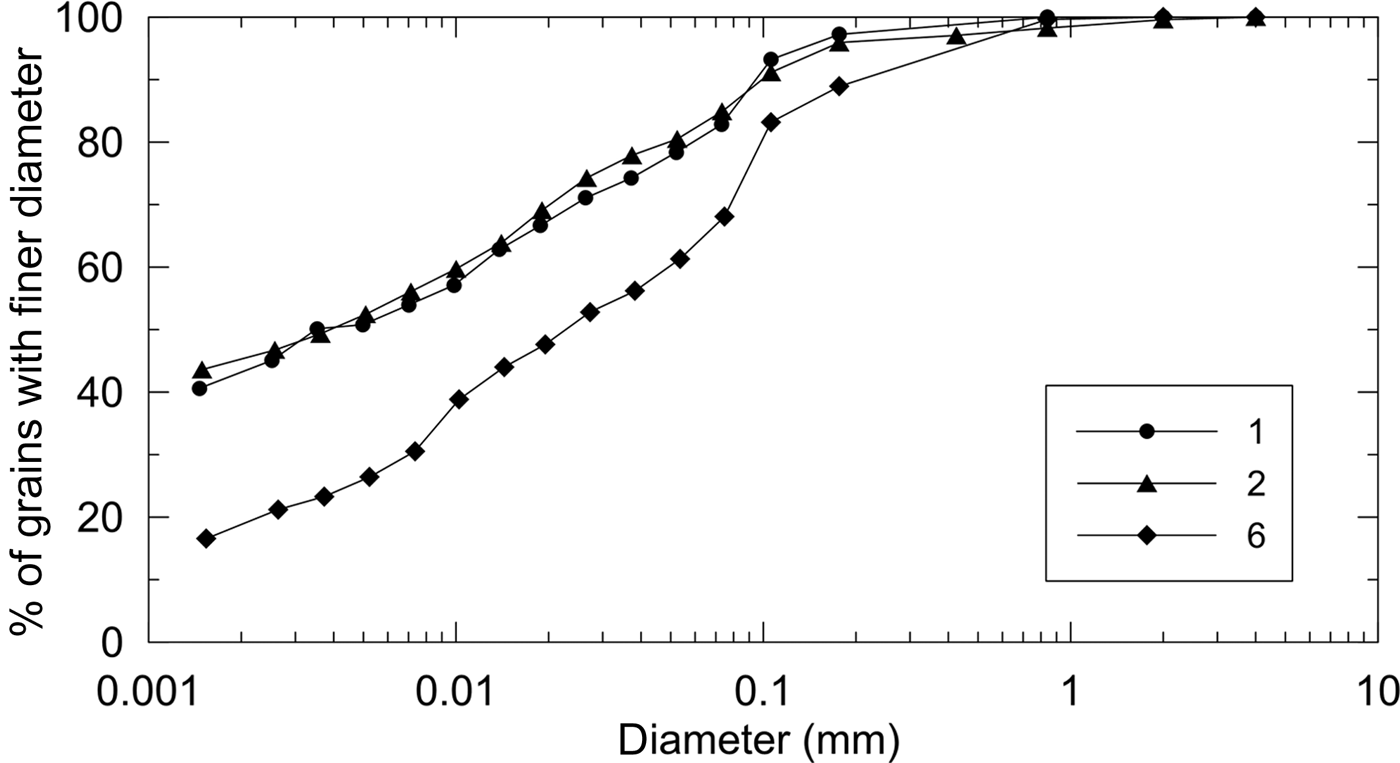
A first comparison of grain-size distributions reported in Fig. 5 shows that samples 1 and 2 are very similar, whilst sample 6 is significantly different mostly due to a major sand percentage at the expense of a minor clay content. The silt fraction is comparable for all three samples, differing from one to another by no more than 5%.

Fig. 5. Grain-size distribution of samples 1, 2 and 6.
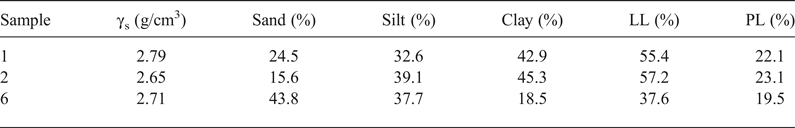
The sand, silt and clay fractions (Table 3) were evaluated following United States Department of Agriculture (USDA) approach: sand fraction between 2 and 0.075 mm, silt fraction between 0.075 and 0.002 mm and clay fraction below a diameter of 0.002 mm. This leads to a sample classification following the USDA textural triangle (Fig. 6; Table 3). Samples 1 and 2 plot in clayey classes, while sample 6 is identified as loam (i.e. a soil that contains different percentages of sand, silt or clay, but none of them definitely influences the aggregate physical properties and behaviour).
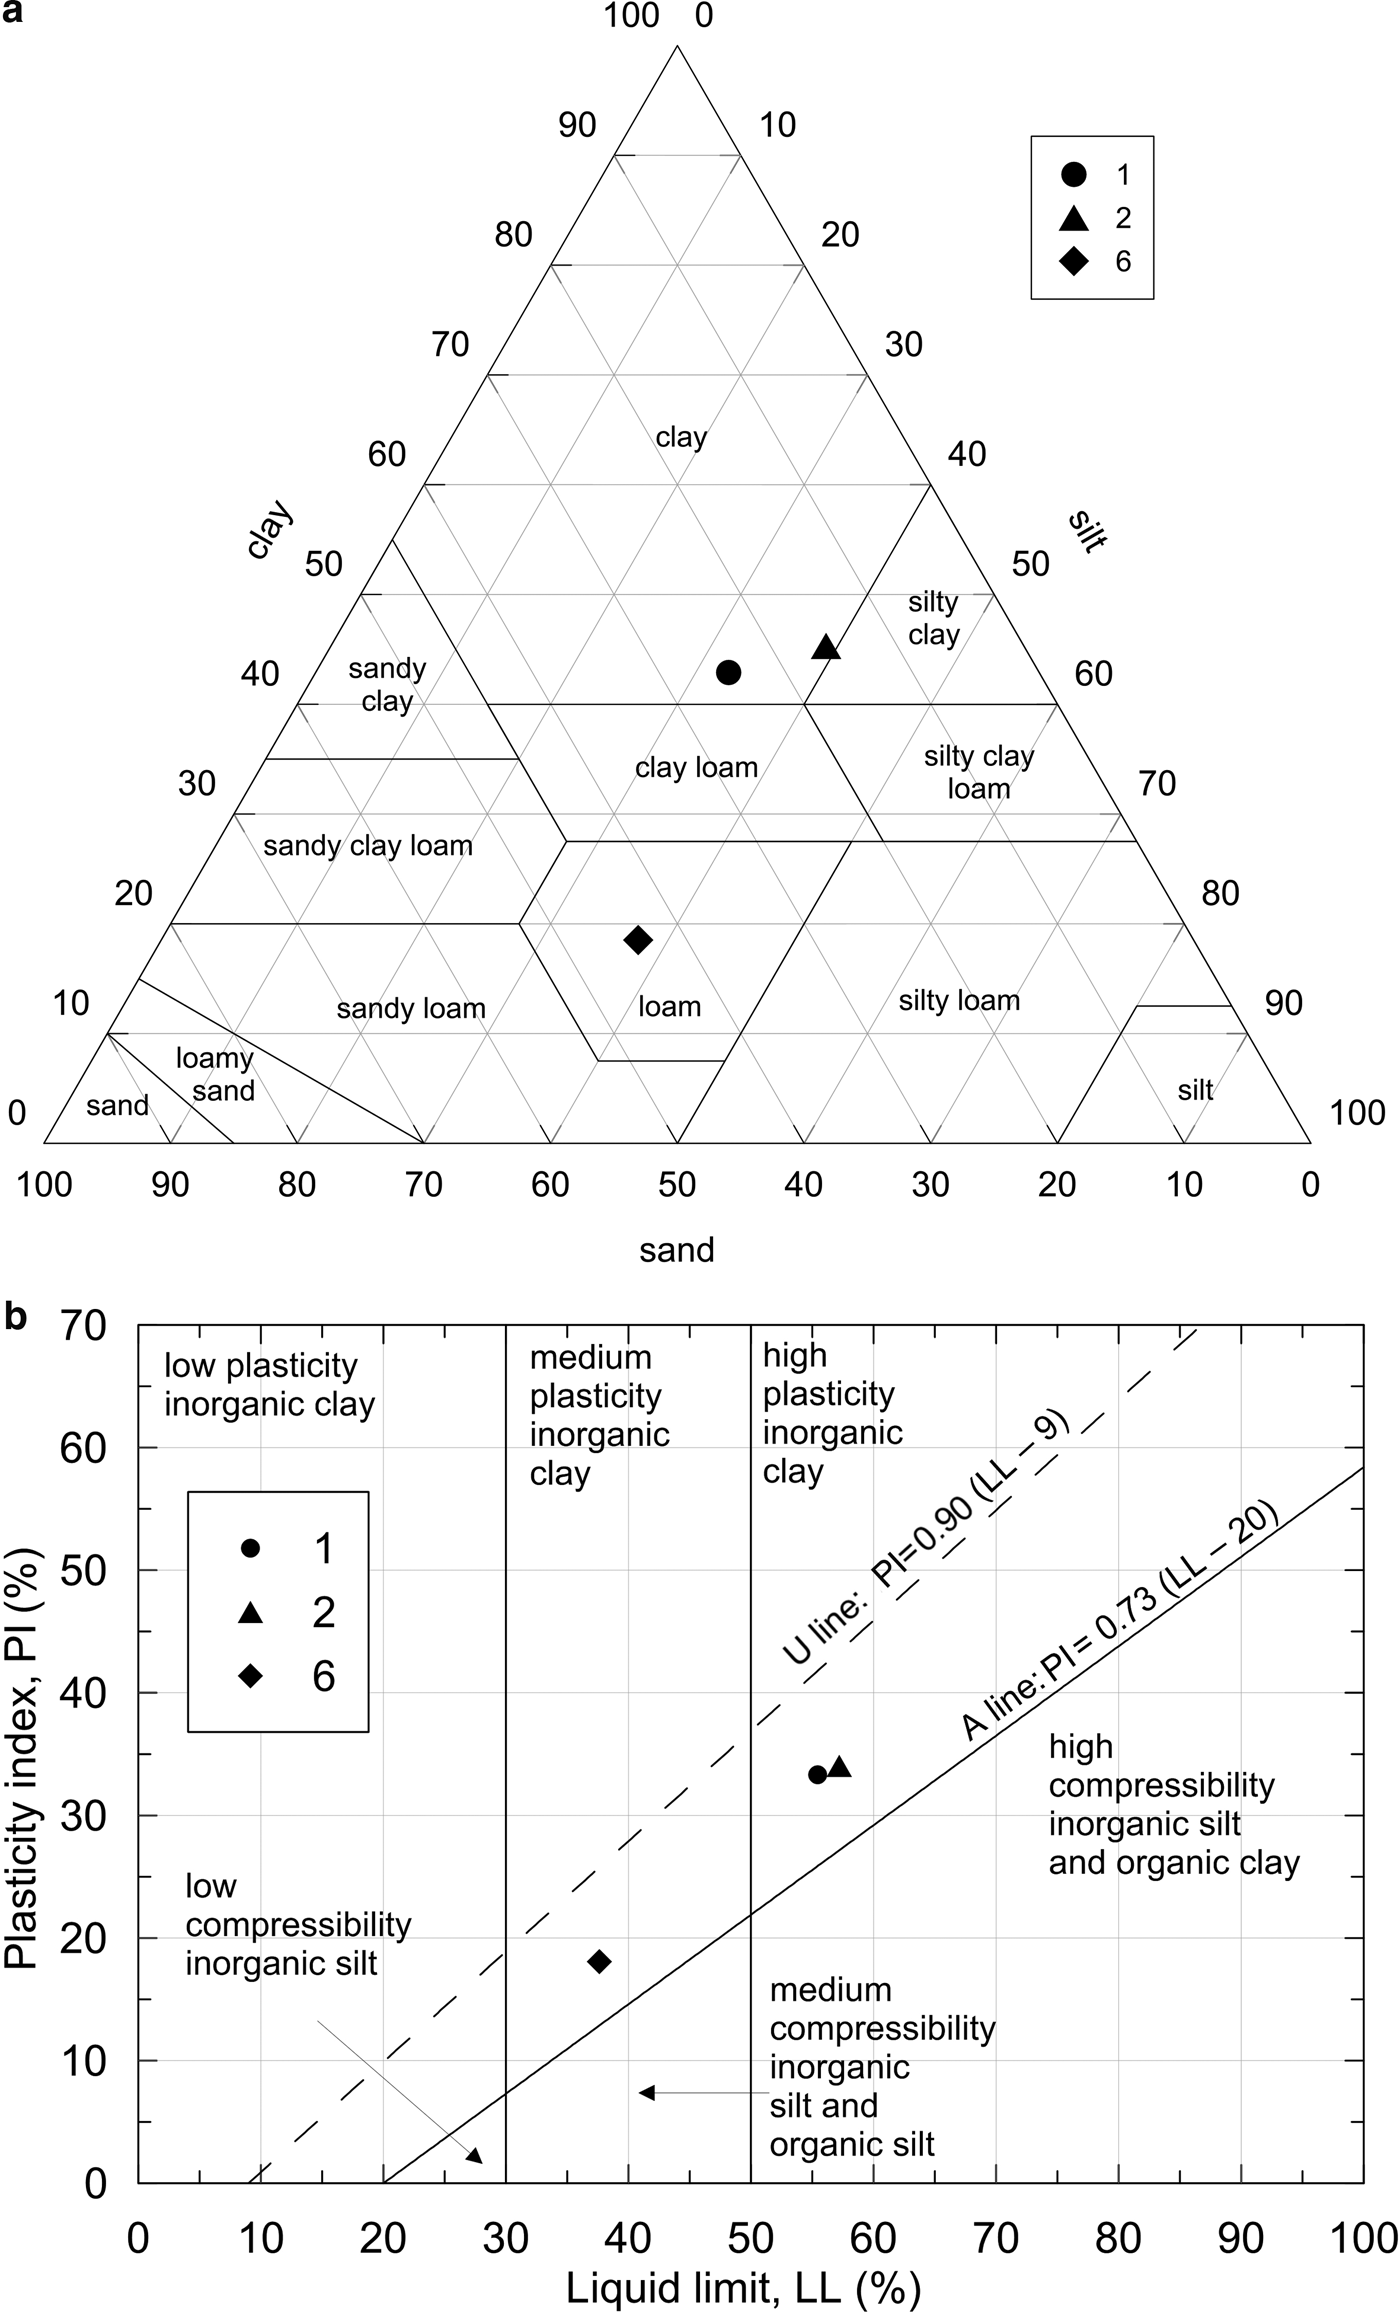
Fig. 6. (a) Soil classification according to the United States Department of Agriculture texture triangle. (b) Soil classification based upon a plasticity chart (b).
Table 3. Sample classification reference properties. Sand, silt and clay fractions are considered with reference to ASTM D422 (2007).

LL = liquid limit; PL = plastic limit.
The comparison of grain density, γs (Table 3), also points to a difference in the mineralogical composition of the samples, as confirmed by the XRD results. Sample 2 has a γs of 2.65 g/cm3, a value that is less than that for the other samples: it is a modern clay collected from the surface and a weathered soil; therefore, the sand percentage is smaller than in the other samples of clays collected from underneath the Roman structures.
As expected, and as frequently observed, there is no quantitative relation between the amounts of clay minerals measured by XRD (Table 2) and clay content defined by the grain-size analysis as the fraction of particles of <2 µm. Not all of the clay mineral particles are necessarily <2 µm, and other crystalline or amorphous phases may be fine-grained. However, sample 6 shows a smaller amount of clays according to geotechnical analysis and also contains fewer clay minerals. Similarly, there is no correlation between the amount of sand and the abundance of quartz. Some quartz particles may be smaller than 75 µm, and sand may also be of a calcareous nature.
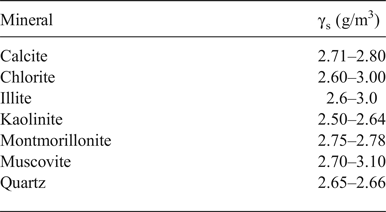
Better agreement is observed when relating grain-density data to XRD results. Samples for grain density, γs, were selected from a <2 mm soil fraction containing a mixture of grains each with a different density, according to the composition of the minerals present. Therefore, the value obtained may be considered to be a pounded weighted average of pure mineral densities on volume fractions (Table 4). The grain density of sample 1, γs = 2.79 g/cm3, appears to be consistent with calcite (particle density of pure calcite is ~2.75 g/cm3) and the abundance of muscovite (particle density of ~2.85 g/cm3), together with montmorillonite and chlorite (particle density of up to 3 g/cm3).
Table 4. Reference densities for pure mineral grains (after Mitchell & Soga, Reference Mitchel and Soga2005; Rowe, Reference Rowe2012).

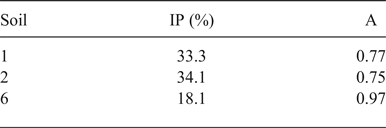
Furthermore, sample 6 has a grain density of 2.71 g/cm3, compatible with the greater presence of calcite compared with other minerals, as it contains less quartz than sand. This may suggest that the large calcite content of this ancient sample is a result of raw-material processing by the addition of limestone sand during the manufacturing of ceramics. The Atterberg limits also confirm these experimental observations, because the greater the carbonate content, the lower the observed LL (Table 3) and IP (Table 5), as reported by Beringen et al. (Reference Beringen, Kolk, Windle, Demars and Chaney1982).
Table 5. Index of plasticity (IP) and activity (A) of tested samples.

The flow curves, showing the linear interpolation for each sample in a semi-logarithmic chart of the points, having moisture content as the ordinate and the number of blows in the Casagrande apparatus as the abscissa, were also evaluated (see the Supporting Information). The plot highlights the differences between sample 1 and sample 2, which are similar, and sample 6. Based on the Atterberg results, further classification is proposed by means of the plasticity chart, based on the plasticity of the samples investigated (Fig. 6). Finally, the activity ‘A’ (the ratio between IP and clay content) of the clay has also been estimated (Table 5). ‘A’ can be considered as representative of the soil volumetric expansion as a consequence of moisture changes (Skempton, Reference Skempton1953; Rao et al., Reference Rao, Phanikumar and Sharma2004): an active soil (A >1.25) tends to show greater volumetric expansion when water is added and greater shrinkage upon drying. All of the samples fall in the normal activity range; therefore, modest volume change is associated with changes in water content. The plasticity and activity characteristics of the soils suggest that they may be suitable for pottery production, especially sample 1.
The local raw material is mostly a non-calcareous clay, as both the ancient and modern materials contain a maximum of 3.3% calcite; samples 6 and 56 are richer in calcite (~14%), while sample 5 has 39% calcite. The presence of calcite is not surprising considering that it is a plasticity modifier and shape stabilizer. Indeed, during the firing process, calcite decomposes and reacts with alkalis, SiO2 and Al2O3 from the decomposition of clays to form feldspars (Fabbri et al., Reference Fabbri, Gualtieri and Shoval2014; El Ouahabi et al., Reference El Ouahabi, Daoudi, Hatert and Fagel2015). Hence, the presence of different amounts of calcite in some of the samples can be explained by intentional addition (e.g. in samples 5 and 6) or with the exploitation of other, carbonate-rich clays, as might be the case for sample 56, which originates 4 km away from the kilns, and which, along with sample 55, has a different clay-mineral composition, poor in montmorillonite.
The extremely high calcite content of sample 5 suggests temper addition, as is evidenced by the association of dolomite and the very low abundance of phyllosilicate (cf. Table 2). This clay is rich in calcite and poor in quartz and clay minerals, making it difficult to use in ceramic production. Therefore, it might be suggested that it was a processed raw material for blending with other clays. The calcite content has been proposed as a valid tool for obtaining information on raw materials, firing processes and manufacturing technologies in ceramic production (Fabbri et al., Reference Fabbri, Gualtieri and Shoval2014). It is part of the process and functions to reduce fuel consumption by reducing the firing temperature.
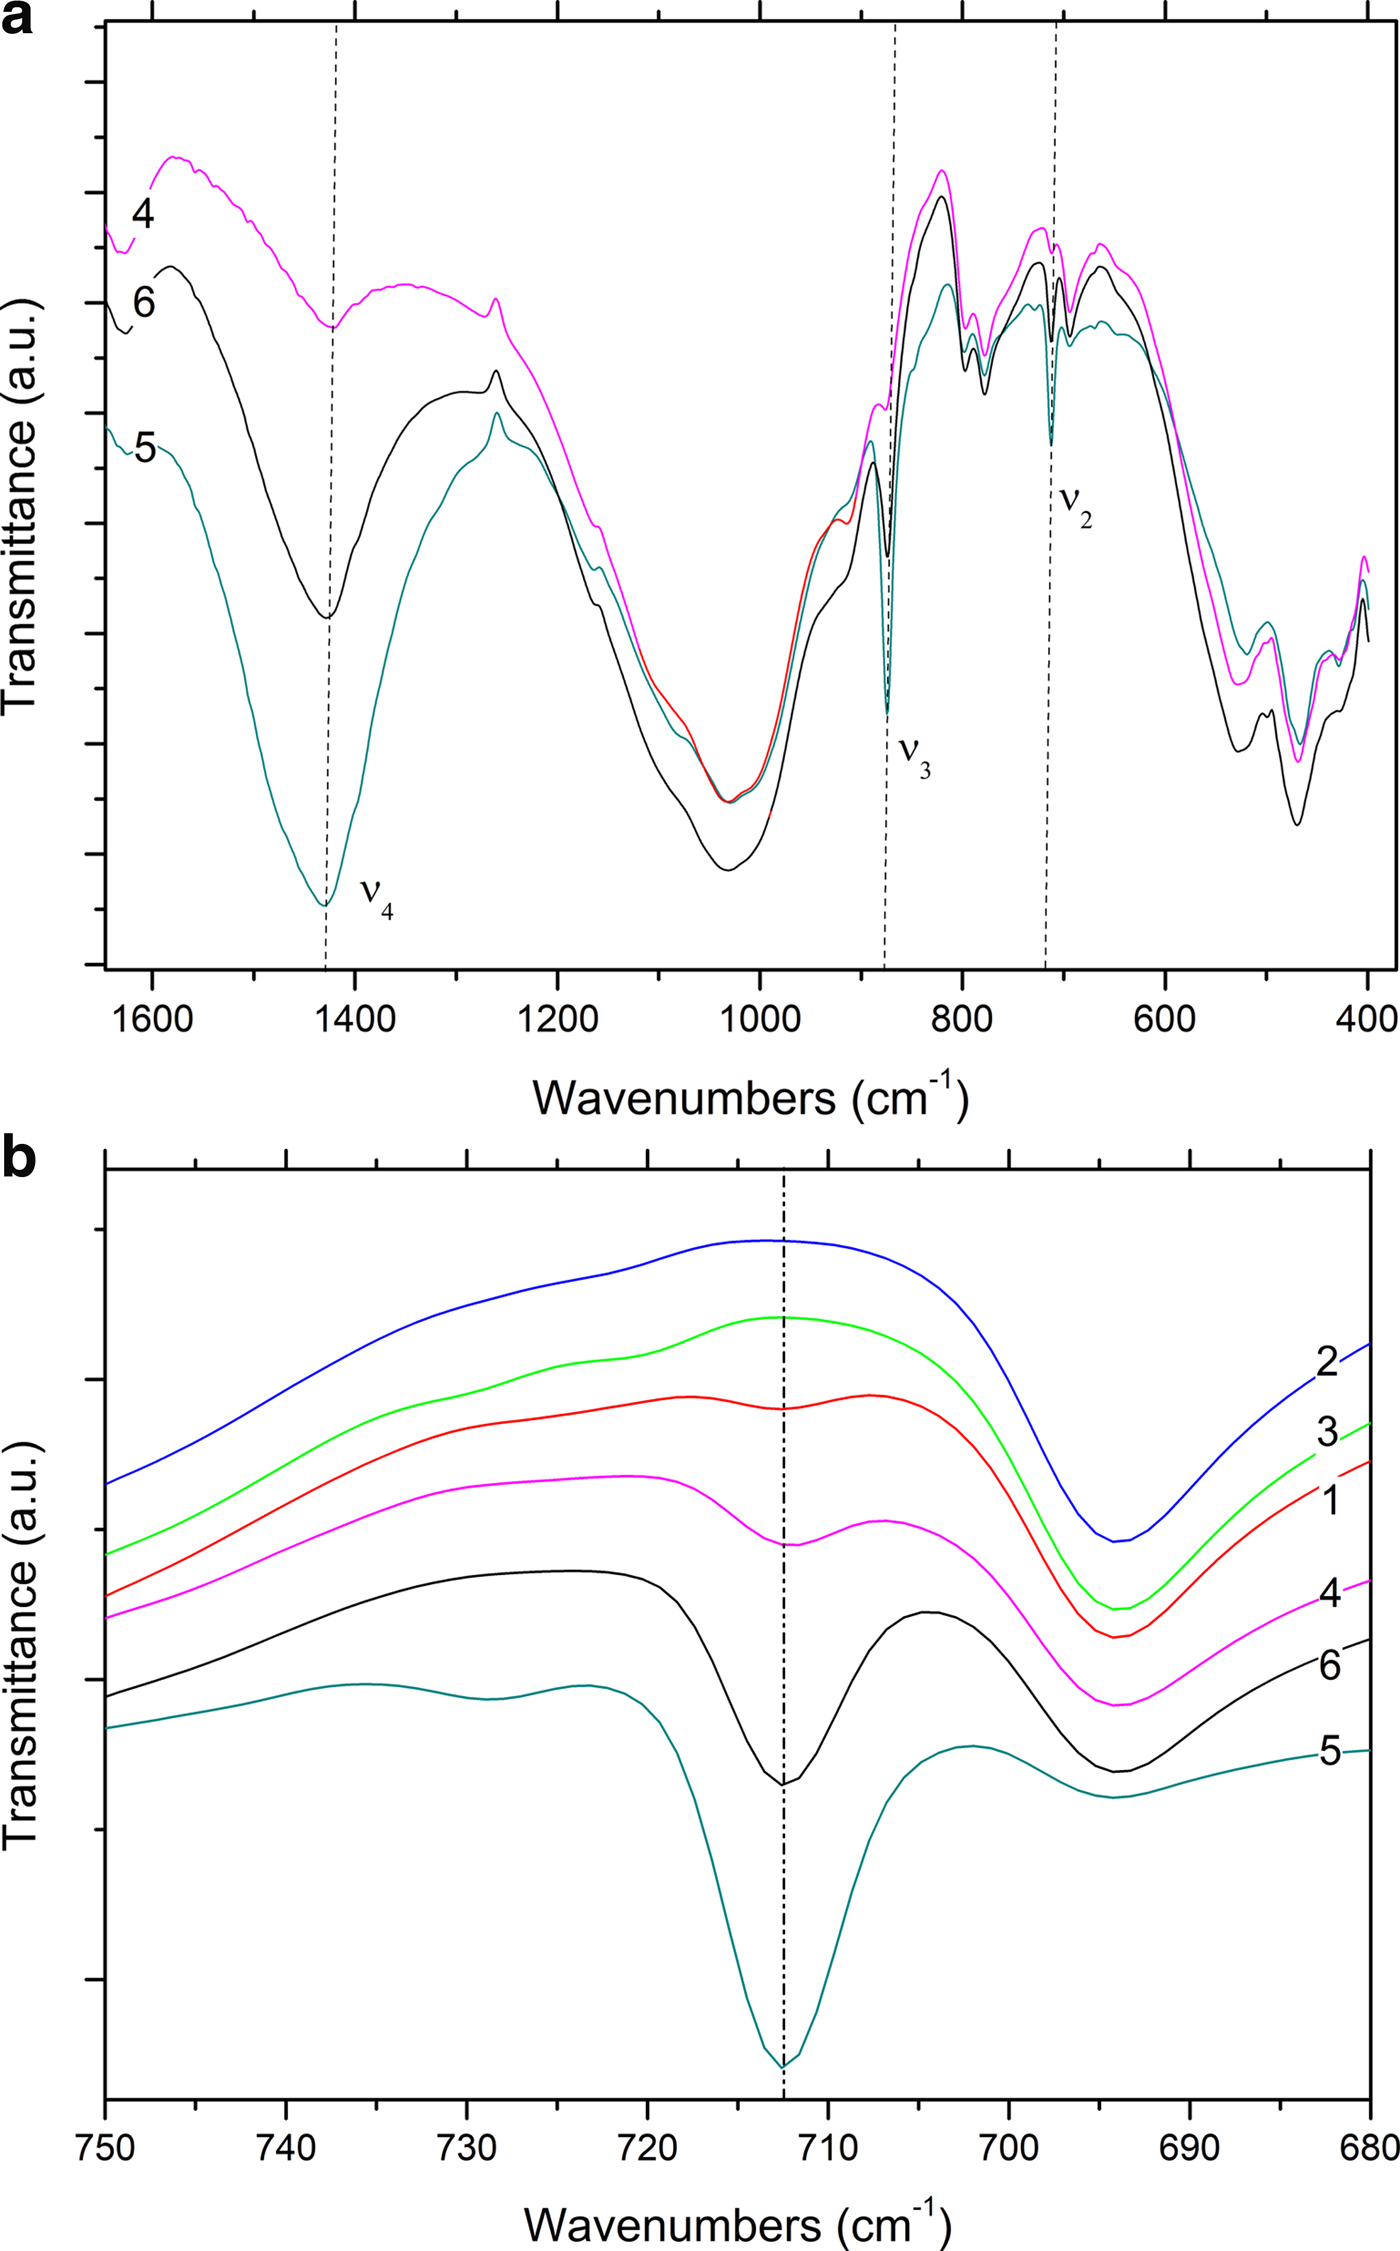
The presence of calcite is confirmed by FTIR and TG analysis, as has been discussed extensively in the literature (Vagenas, Reference Vagenas2003; Rodriguez-Blanco et al., Reference Rodriguez-Blanco, Shaw and Benning2011; Fabbri et al., Reference Fabbri, Gualtieri and Shoval2014; Ihli et al., Reference Ihli, Wong, Noel, Kim, Kulak, Christenson, Duer and Meldrum2014; Li et al., Reference Li, Lv, Ma, Wang and Jian2017). FTIR spectra of the Montelabate raw clay samples 1–6 in the range of interest (1600?400 cm−1) show ν 2, ν 3 and ν 4 absorption bands characteristic of carbonate (Fig. 7a).

Fig. 7. FTIR spectra (a, b) of unfired clay materials (dotted lines: calcite bands).
Depending on the sample composition, a well-defined, single band is detected at 713 cm–1 that may be attributed to calcite. The FTIR spectra are in accord, in general, with the XRD results where a very low calcite content was calculated in samples 1 and 4 (2.5% and 3.5%, respectively), whilst amounts between 14% and 39% were recorded in samples 6, 56 and 5. Calcite is absent from samples 2, 3 and 55.
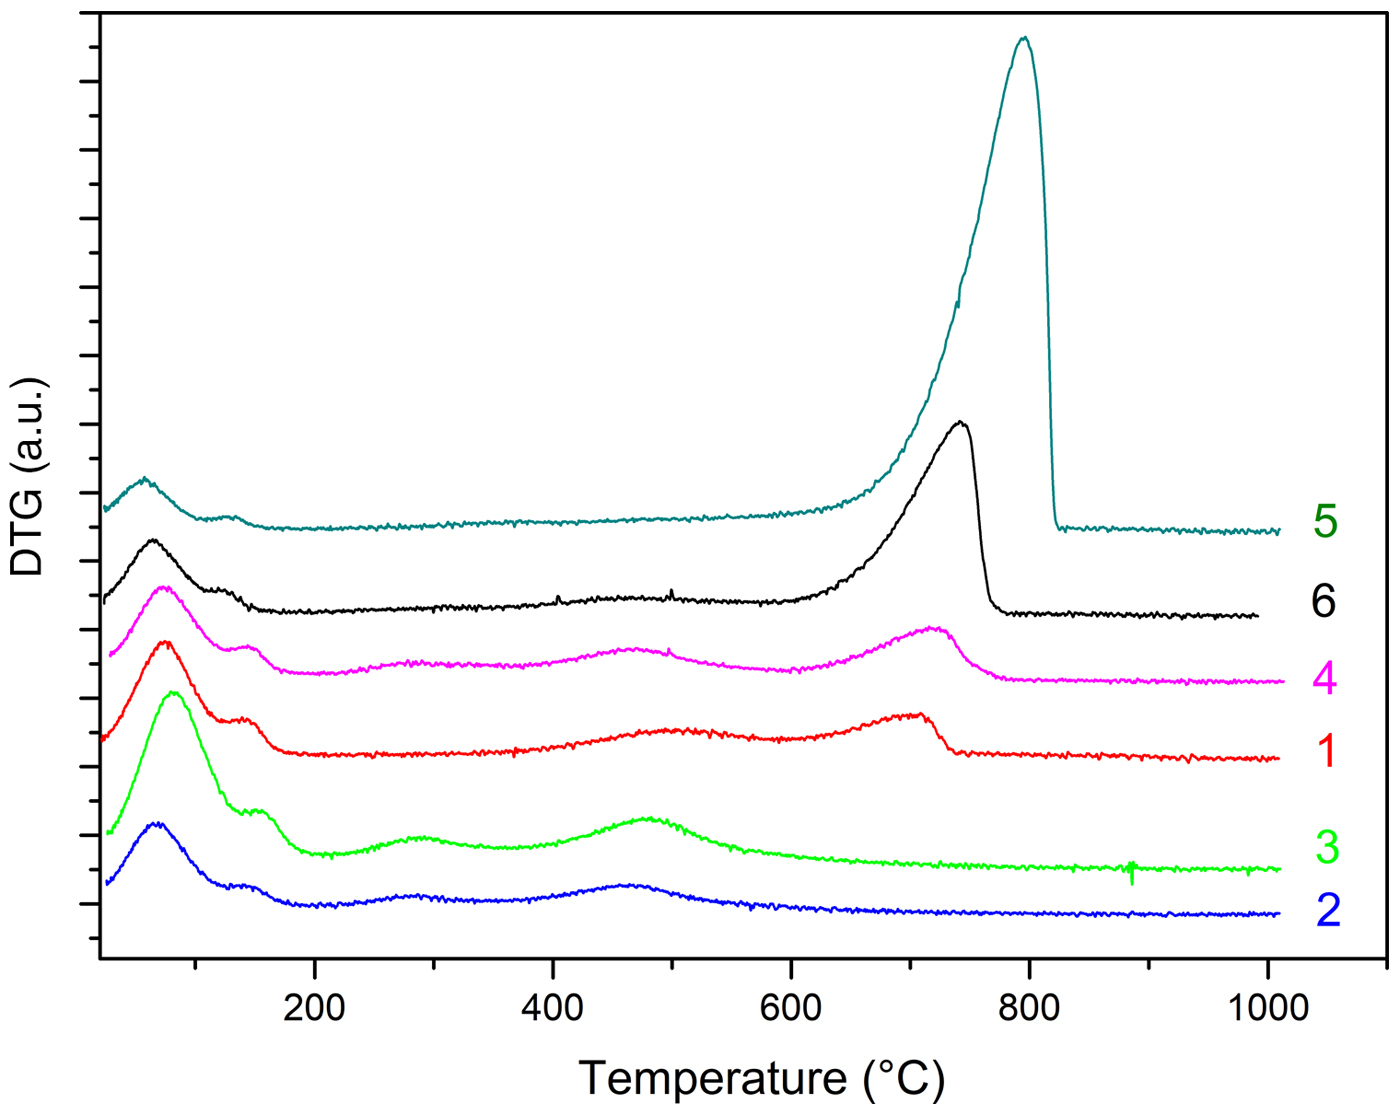
The DTG curves of samples 1–6 are shown in Fig. 8. Samples 1, 4, 5 and 6 display weight losses in the temperature range 25–800°C with the loss being greatest in the case of sample 5 (~25%) and decreasing progressively from sample 6 (~15%) to sample 1. Three different temperature ranges of thermal reactions may be considered: 25–200°C, 200–600°C and 600–850°C (Fig. 8). In the first temperature range, the samples behave similarly: a complex decomposition attributed to the evolution of physisorbed water occurs, which is characterized by a low-temperature main peak accompanied by a shoulder at a higher temperature. The second decomposition range is typical of the evolution of structural water (dehydroxylation). Accordingly, the scarcely evident peaks in the region 200–600°C may be related to clay-mineral interlayer dehydration (Zampori et al., Reference Zampori, Dotelli, Gallo Stampino, Cristiani, Zorzi and Finocchio2012).

Fig. 8. DTG analysis of unfired clay materials.
In terms of the latter temperature range, the presence of carbonate phases again has to be inferred. Indeed, the strong decomposition phenomenon detected at 800°C has been attributed to calcite decomposition to give CaO (Rodriguez-Blanco et al., Reference Rodriguez-Blanco, Shaw and Benning2011; Fabbri et al., Reference Fabbri, Gualtieri and Shoval2014; Ihli et al., Reference Ihli, Wong, Noel, Kim, Kulak, Christenson, Duer and Meldrum2014). Such decomposition is clearly evident in samples 1, 4, 5 and 6, where both XRD (Table 2) and FTIR analyses (Fig. 7a,b) revealed the presence of calcite. The shift of the decomposition temperature from sample 5 to sample 1 (740°C, 720°C and 710°C in samples 6, 4 and 1, respectively) may account for the spread of the crystal-size dimensions or the low purity of calcite in samples with a lower calcite content. Again, in samples 2 and 3, no trace of calcite was noted due to the lack of decomposition event at 600–800°C.
When considering the compositional distribution of the Montelebate clays, it may be concluded that both non-calcareous and calcareous clays were used, while in samples 5 and 6, calcite may have been added intentionally for blending with other non-calcareous clays, confirming the hypothesis already formulated on the basis of XRD, FTIR and geotechnical analyses.
Fired samples
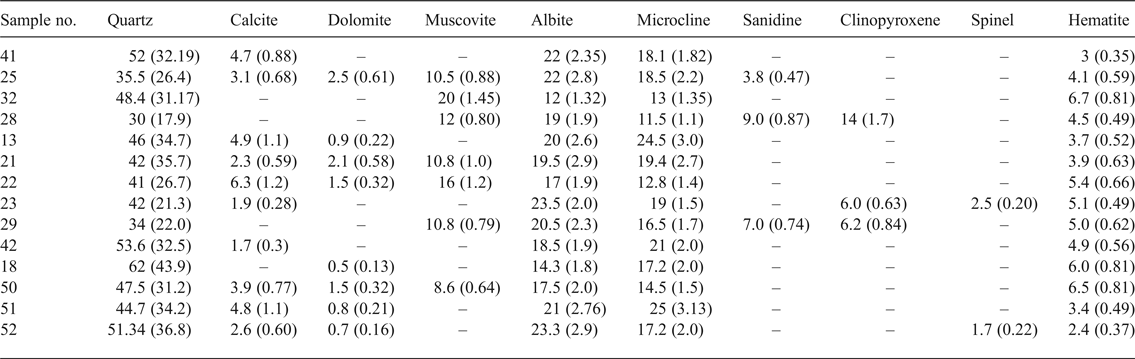
The quantitative XRD analyses of the fired amphorae samples are listed in Table 6. The fired ceramics consist mainly of quartz, feldspars, hematite, clinopyroxene, spinel, often carbonates and sometimes sanidine. The phyllosilicates are decomposed, except for muscovite, which decreases in amount and shows evidence of partial dehydroxylation. There is statistically no difference in the abundance of quartz (or equivalently in the scale factor of quartz) between the unfired (Table 2) and the fired materials (Table 6). This indicates that quartz is not affected by the firing process. However, there is a systematic increase in the amount of feldspars as a result of thermal treatment. The statistical significance has been verified with the Student t-test with a degree of confidence of 95%. Accordingly, firing calcareous clays at temperatures above 700°C causes partial dehydroxylation and decomposition of the clay minerals, which react to form hematite and feldspars. Newly formed hematite may have resulted from dehydroxylation of an Fe-rich clay, as the phase is absent from the unfired material, indicating that ferric oxide may have formed during the decomposition of Fe-bearing clay minerals (~7% Fe2O3 in XRF). The presence of sanidine suggests that the firing temperature was <900°C. In particular, the spinel phase, which originated from decomposed chlorite, is an indicator of high temperature (~950°C) (El Ouahabi et al., Reference El Ouahabi, Daoudi, Hatert and Fagel2015). Nevertheless, it occurs only in samples 23 and 52, the latter being a good-quality amphora from Gubbio and the former being a type 5 amphora from the kilns at Montelabate, suggesting the possibility of temperature variations of as much as hundreds of degrees inside a kiln.
Table 6. Phase compositions as determined by XRD Rietveld refinement of fired samples (wt.%). Scale factors in parentheses.

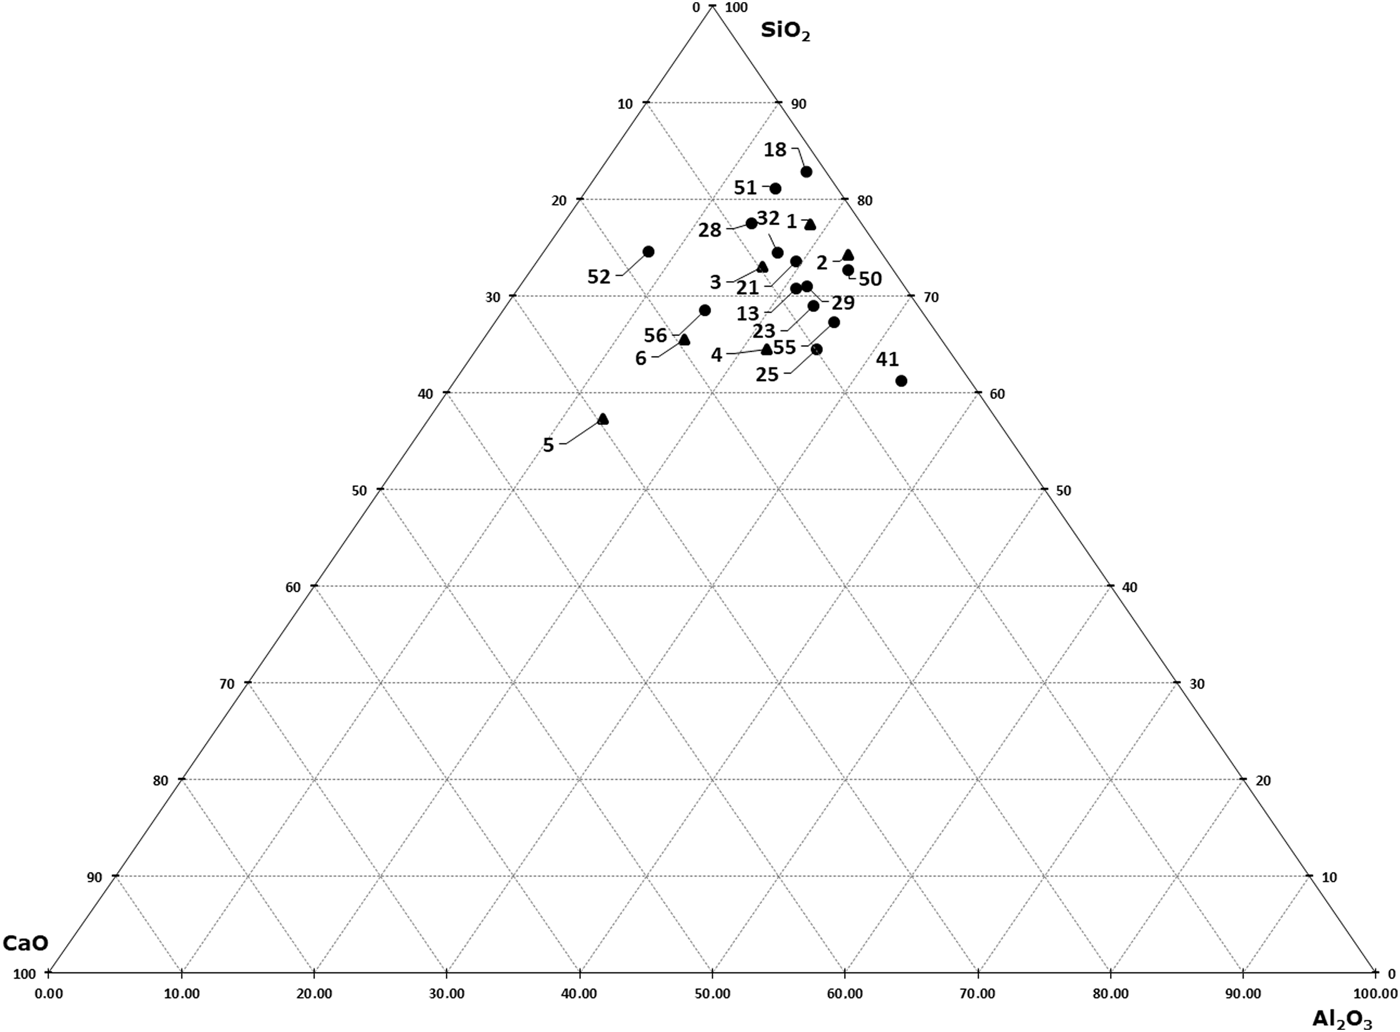
To visualize the elemental composition of the various raw and fired samples, a series of ternary (SiO2-CaO-Al2O3) diagrams was constructed based on XRF data (Fig. 9). Except for clay samples 5, 6 and 56, which are characterized by the highest Ca content, the other clay samples and the fired materials have similar Ca contents (2–8%). The Si contents display greater scatter among the samples (e.g. sample 18, which contained a larger amount of quartz as detected by XRD).

Fig. 9. CaO?Al2O3?SiO2 diagram of raw clays (black triangles) and fired amphorae (black dots).
Similarly to the raw clays, the fired samples were also analysed by FTIR spectroscopy. In Fig. 10, the spectra of fired samples are plotted alongside sample 4, a raw clay that was selected as representative of the material used to produce the amphorae. This selection was decided by the composition (see ternary diagram of the XRF results in Fig. 9), where clays 1–4 are grouped in the same area, thus presenting very similar compositions and a calcite content of ~2–3%, as shown by XRD.
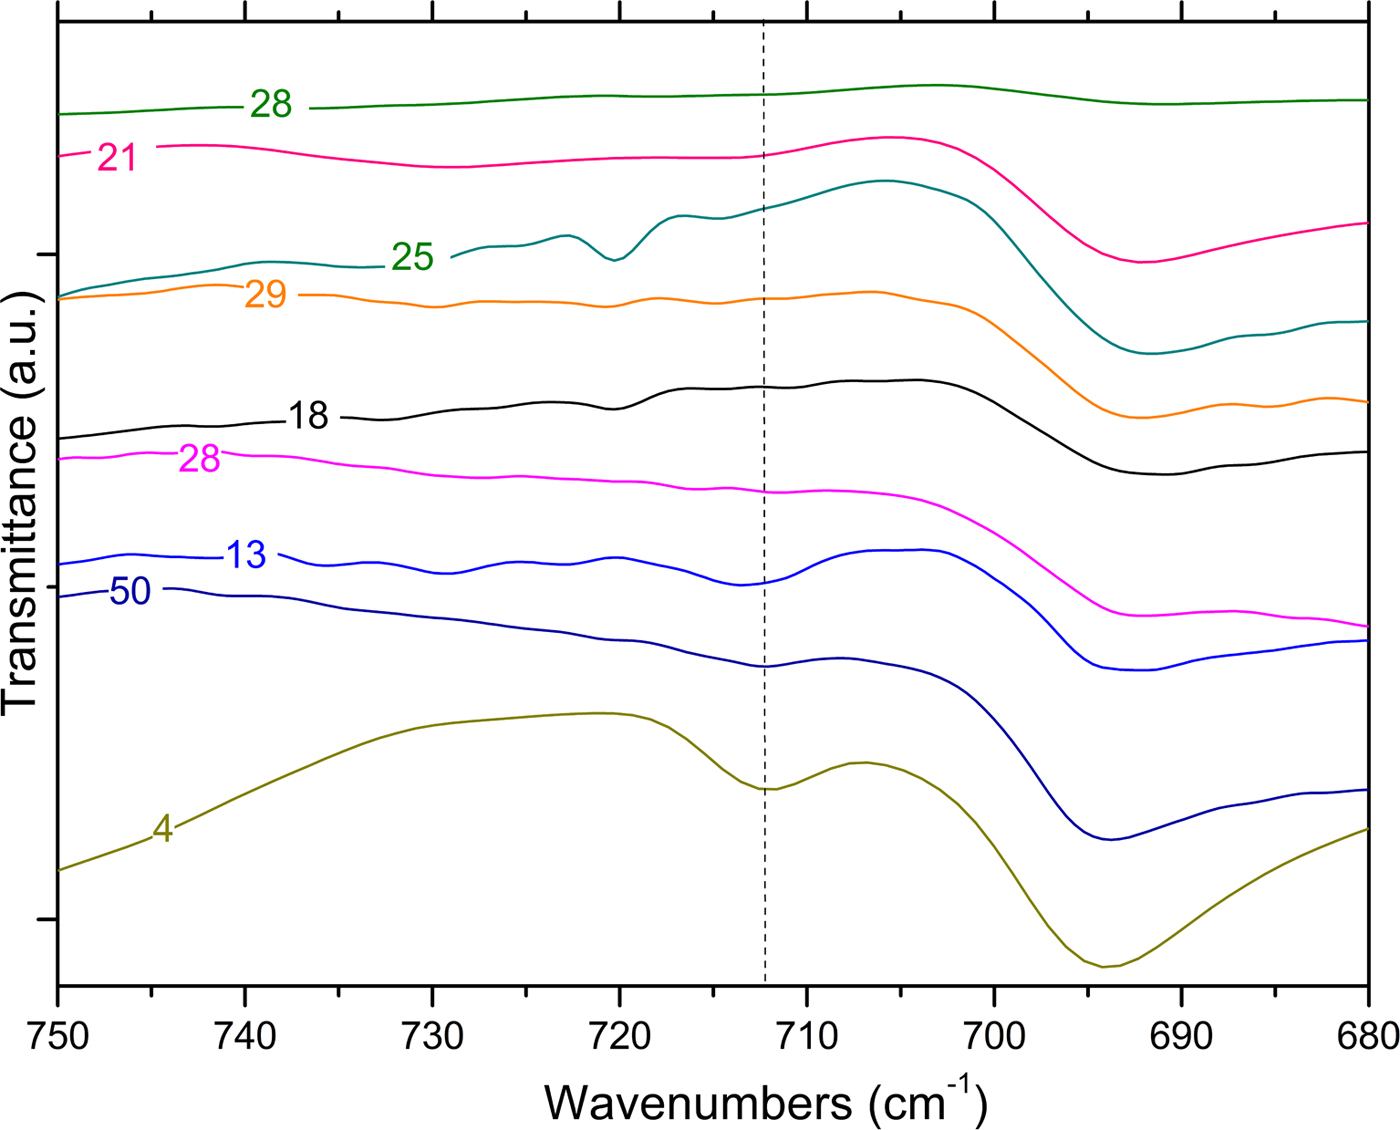
Fig. 10. FTIR spectra of fired samples (dotted line: calcite band).
In most of the fired samples, the calcite (1.7–6.0%) and dolomite (1.0–2.5%) may have been derived from carbonate-rich clays. The thermal treatment should in fact result in calcite decomposition. However, the presence of the calcite phase (Fig. 10) in samples fired at high temperatures (by which it should have been completely decomposed) can be interpreted as the formation of secondary calcite via other means, as has been observed previously (Fabbri et al., Reference Fabbri, Gualtieri and Shoval2014). Therefore, a combined analytical approach allows the identification of the calcite genesis and may provide information about the technology used in pottery production.
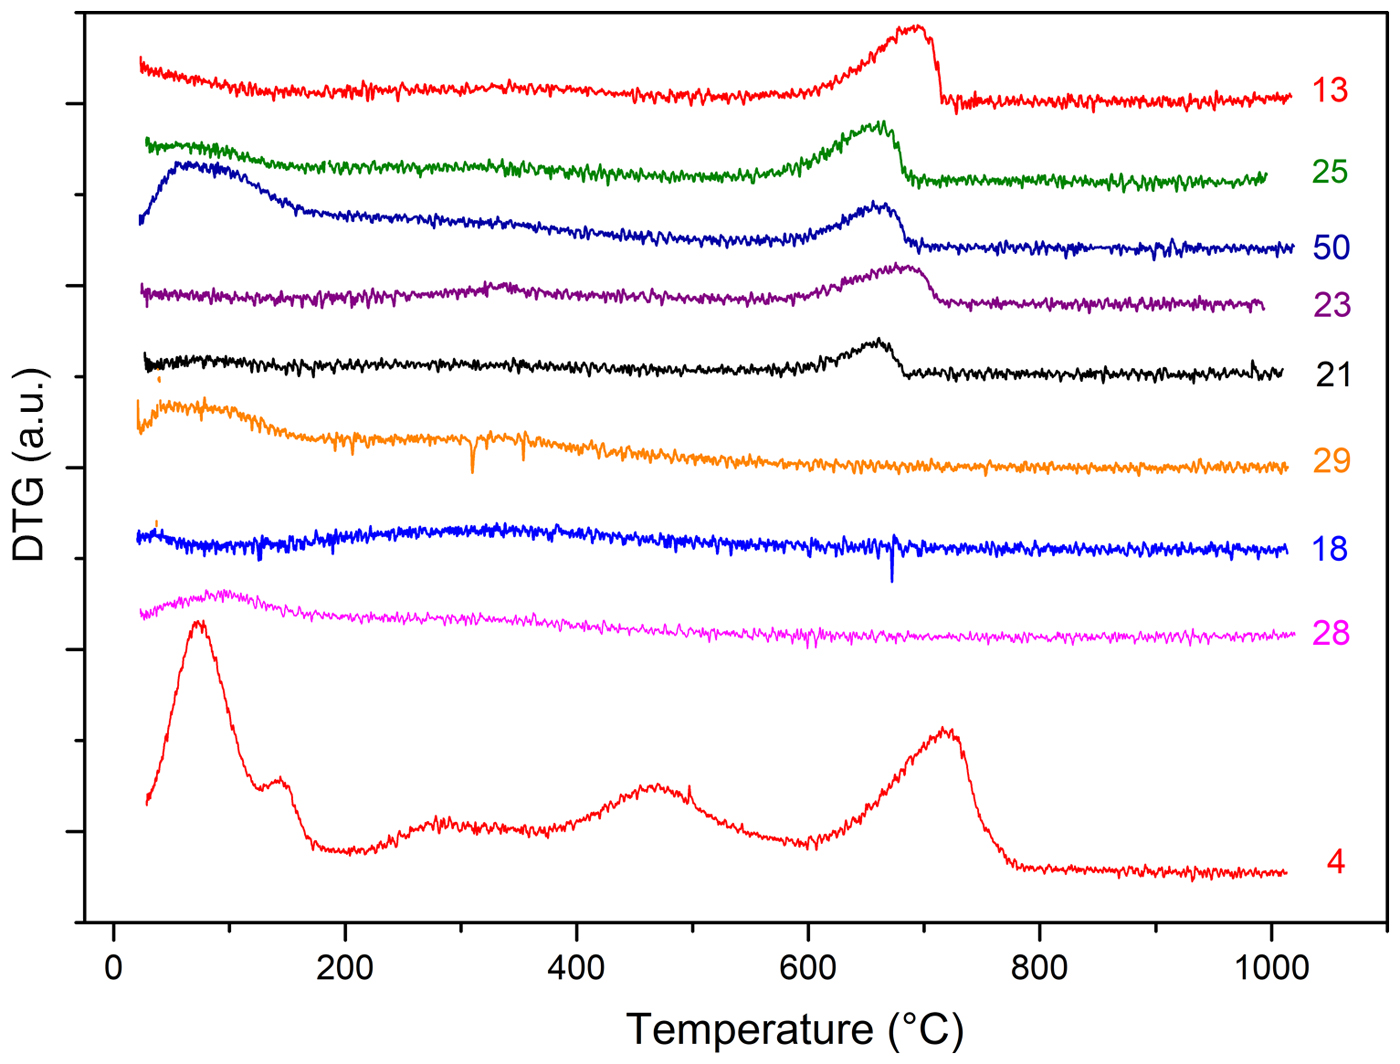
In order to further this investigation, TG-DTG analysis was also performed on the fired samples. Thermograms are plotted in Fig. 11. All of the samples present very limited weight loss over the temperature range 25–800°C (~7.5%) when compared to the unfired samples. Some differences in the decomposition behaviour may be better analysed by DTG curves (Fig. 11). Samples 28 and 29 were fired at a very high temperature, as only small amounts of physisorbed water evolution was observed at ~100–120°C. Sample 18 does not display weight loss in the TG-DTG analysis, which could be attributed to calcite decomposition. Because the XRD results indicate that there are no high-temperature phases, it is concluded that the ceramic was produced with a non-calcareous clay.

Fig. 11. DTG analysis of fired samples.
In the fired samples, the lack of notable thermal events between 200 and 600°C (the temperature range for dehydration of clay minerals interlayer) suggests that the clay mineral layer structure has been destroyed due to interlayer collapse (Zampori et al., Reference Zampori, Dotelli, Gallo Stampino, Cristiani, Zorzi and Finocchio2012). In the remaining samples, the typical calcite decomposition peak is present, although to varying extents. In the presence of calcite, however, it is possible to suggest two hypotheses. Firstly, partial or no calcite decomposition occurred because of a firing temperature of <600°C. Secondly, the decomposition noted in the TG-DTG curves in samples fired at ~700–750°C is reformed calcite. The original carbonate content, due to calcination, was decomposed completely to CaO (free-lime), which, in turn, reacted with atmospheric moisture and thus was rehydrated to form Ca(OH)2. Subsequently, calcium hydroxide can react with atmospheric CO2 and the reformed calcite crystallized (Fabbri et al., Reference Fabbri, Gualtieri and Shoval2014). The latter interpretation appears to be more plausible because: (1) firing at temperatures <600°C is not feasible because of hematite that, in Ca-rich clay, appears at 700°C following iron oxidation (De Bonis et al., Reference De Bonis, Cultrone, Grifa, Langella, Leone, Mercurio and Morra2017); and (2) the presence of limited interlayer hydroxyls (see modulation of DTG signals at 200–600°C in Fig. 11) indicates a firing temperature of ~800°C, hence calcite and re-hydroxylation are due to reaction with atmosphere over time. The formation of secondary calcite is also consistent with a firing process at a temperature of ~800°C, because at that temperature, Ca-silicate may form via reaction between free-lime and clay. Ca sequestration would result in a lower degree of re-carbonation in the sample. In firing replicas of ceramics, it was noted that, in Ca-rich samples, a small amount of calcite resisted at temperatures higher than expected (i.e. ~850°C; De Bonis et al., Reference De Bonis, Cultrone, Grifa, Langella, Leone, Mercurio and Morra2017). This is explained as being due to both the relatively short firing cycle and the presence of coarse calcite grains. The absence of Ca-silicates such as gehlenite (which occurs at ~850°C) suggests that not only the raw material composition, but also a combination of time and temperature of firing may affect structural and mineralogical transformations. Similarly, the absence of other calcium silicates, such as Al-rich diopside, which had already formed beginning at ~800°C (De Bonis et al., Reference De Bonis, Cultrone, Grifa, Langella and Morra2014), may be considered a firing-temperature marker.
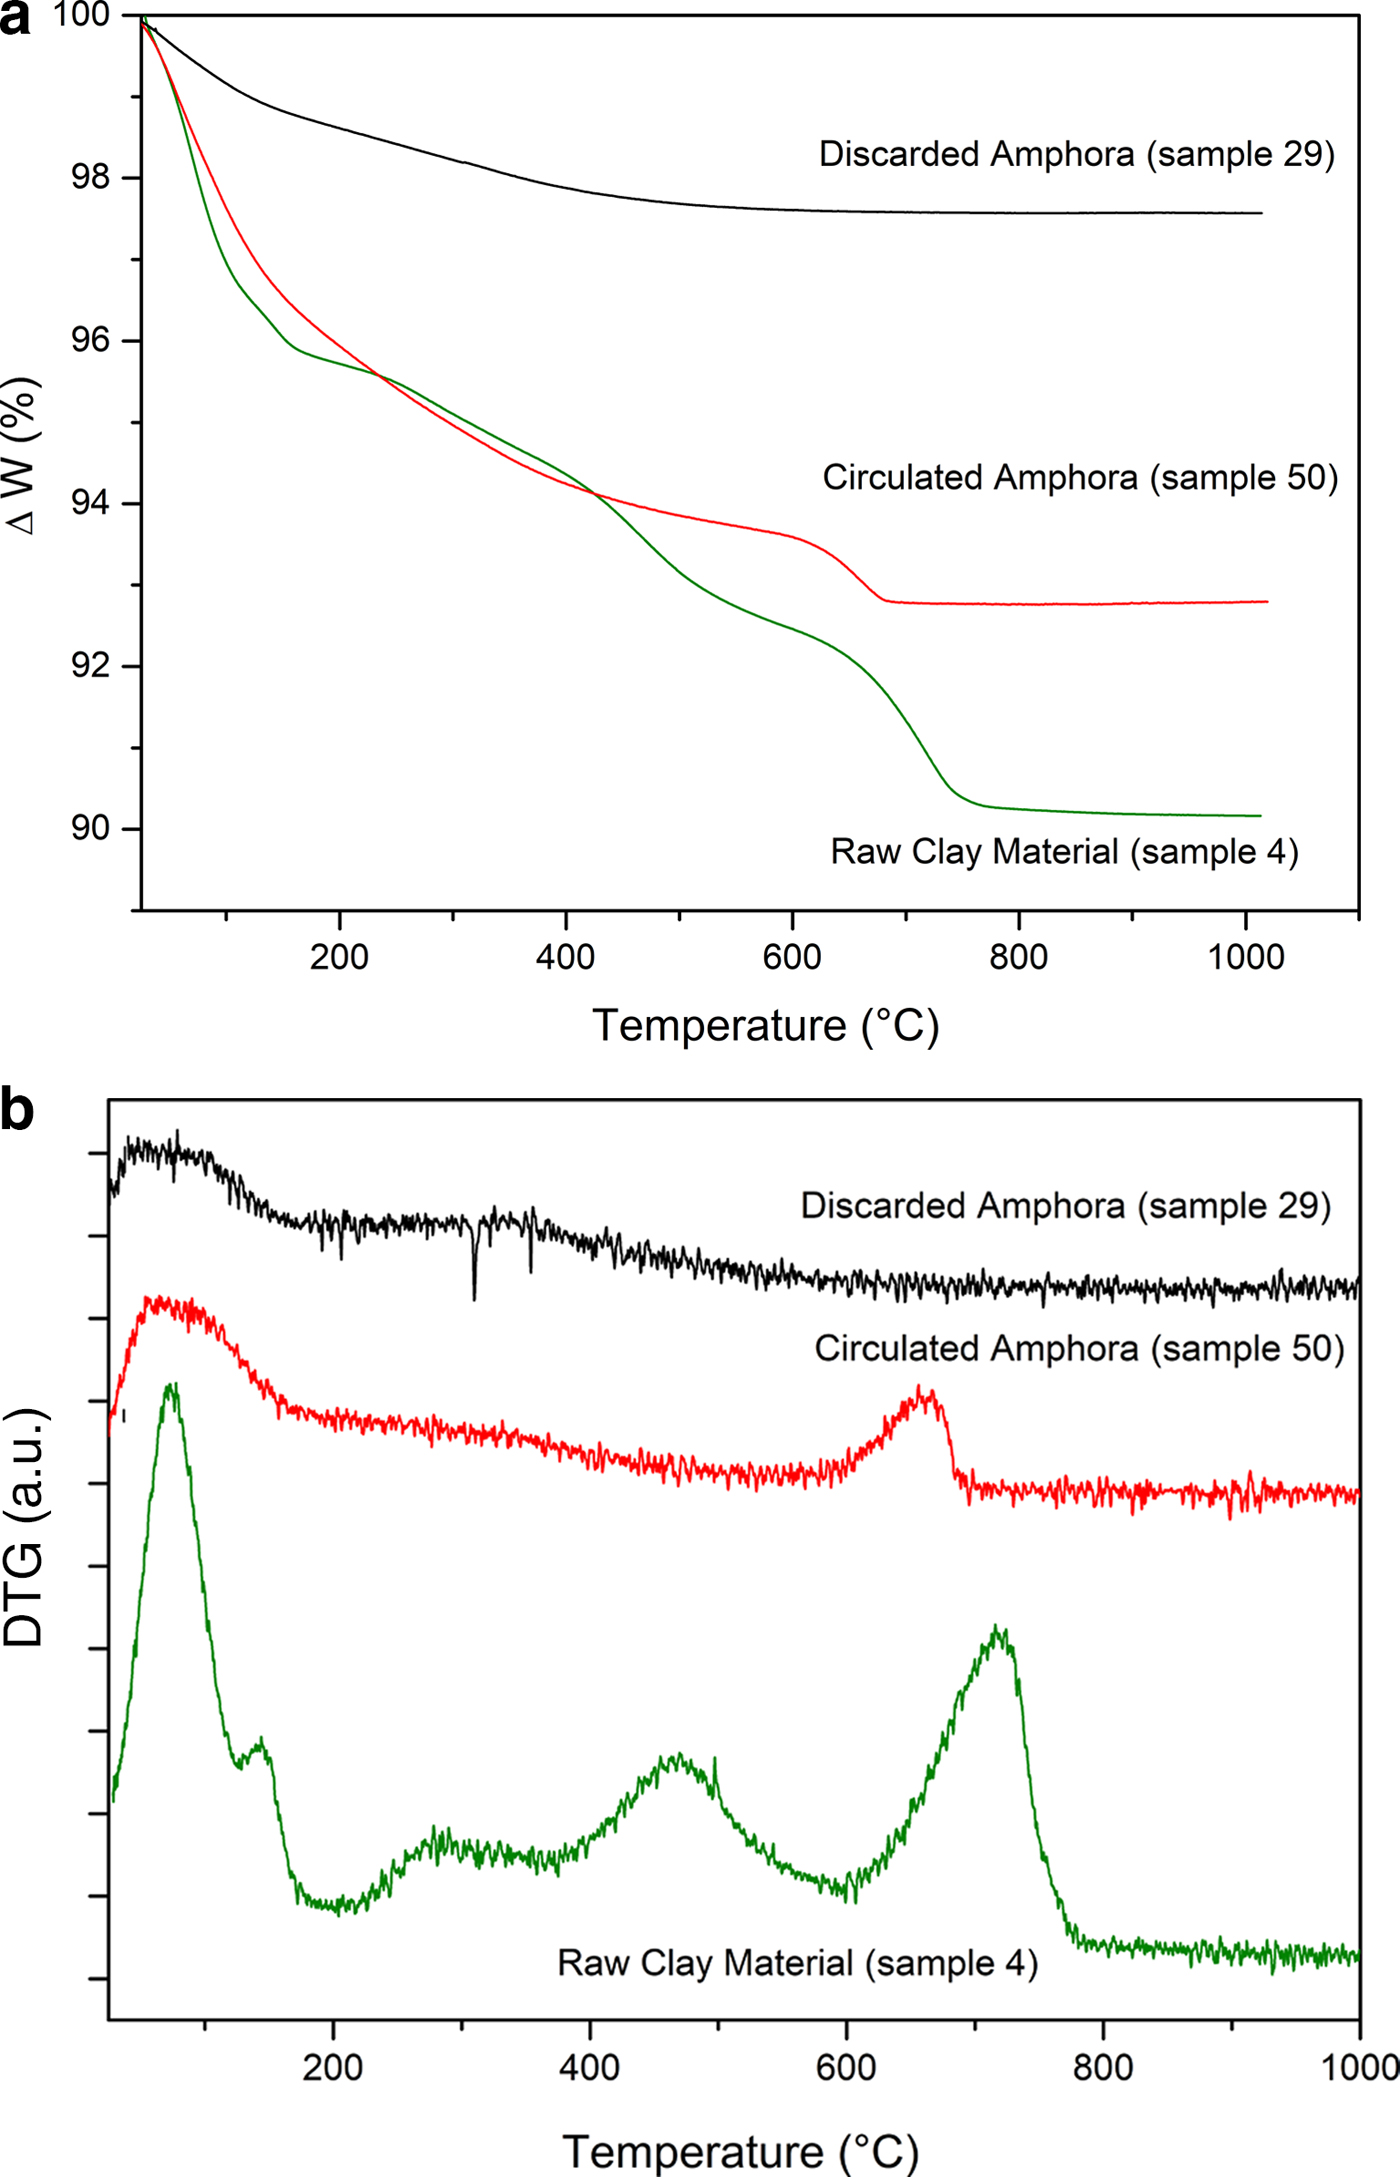
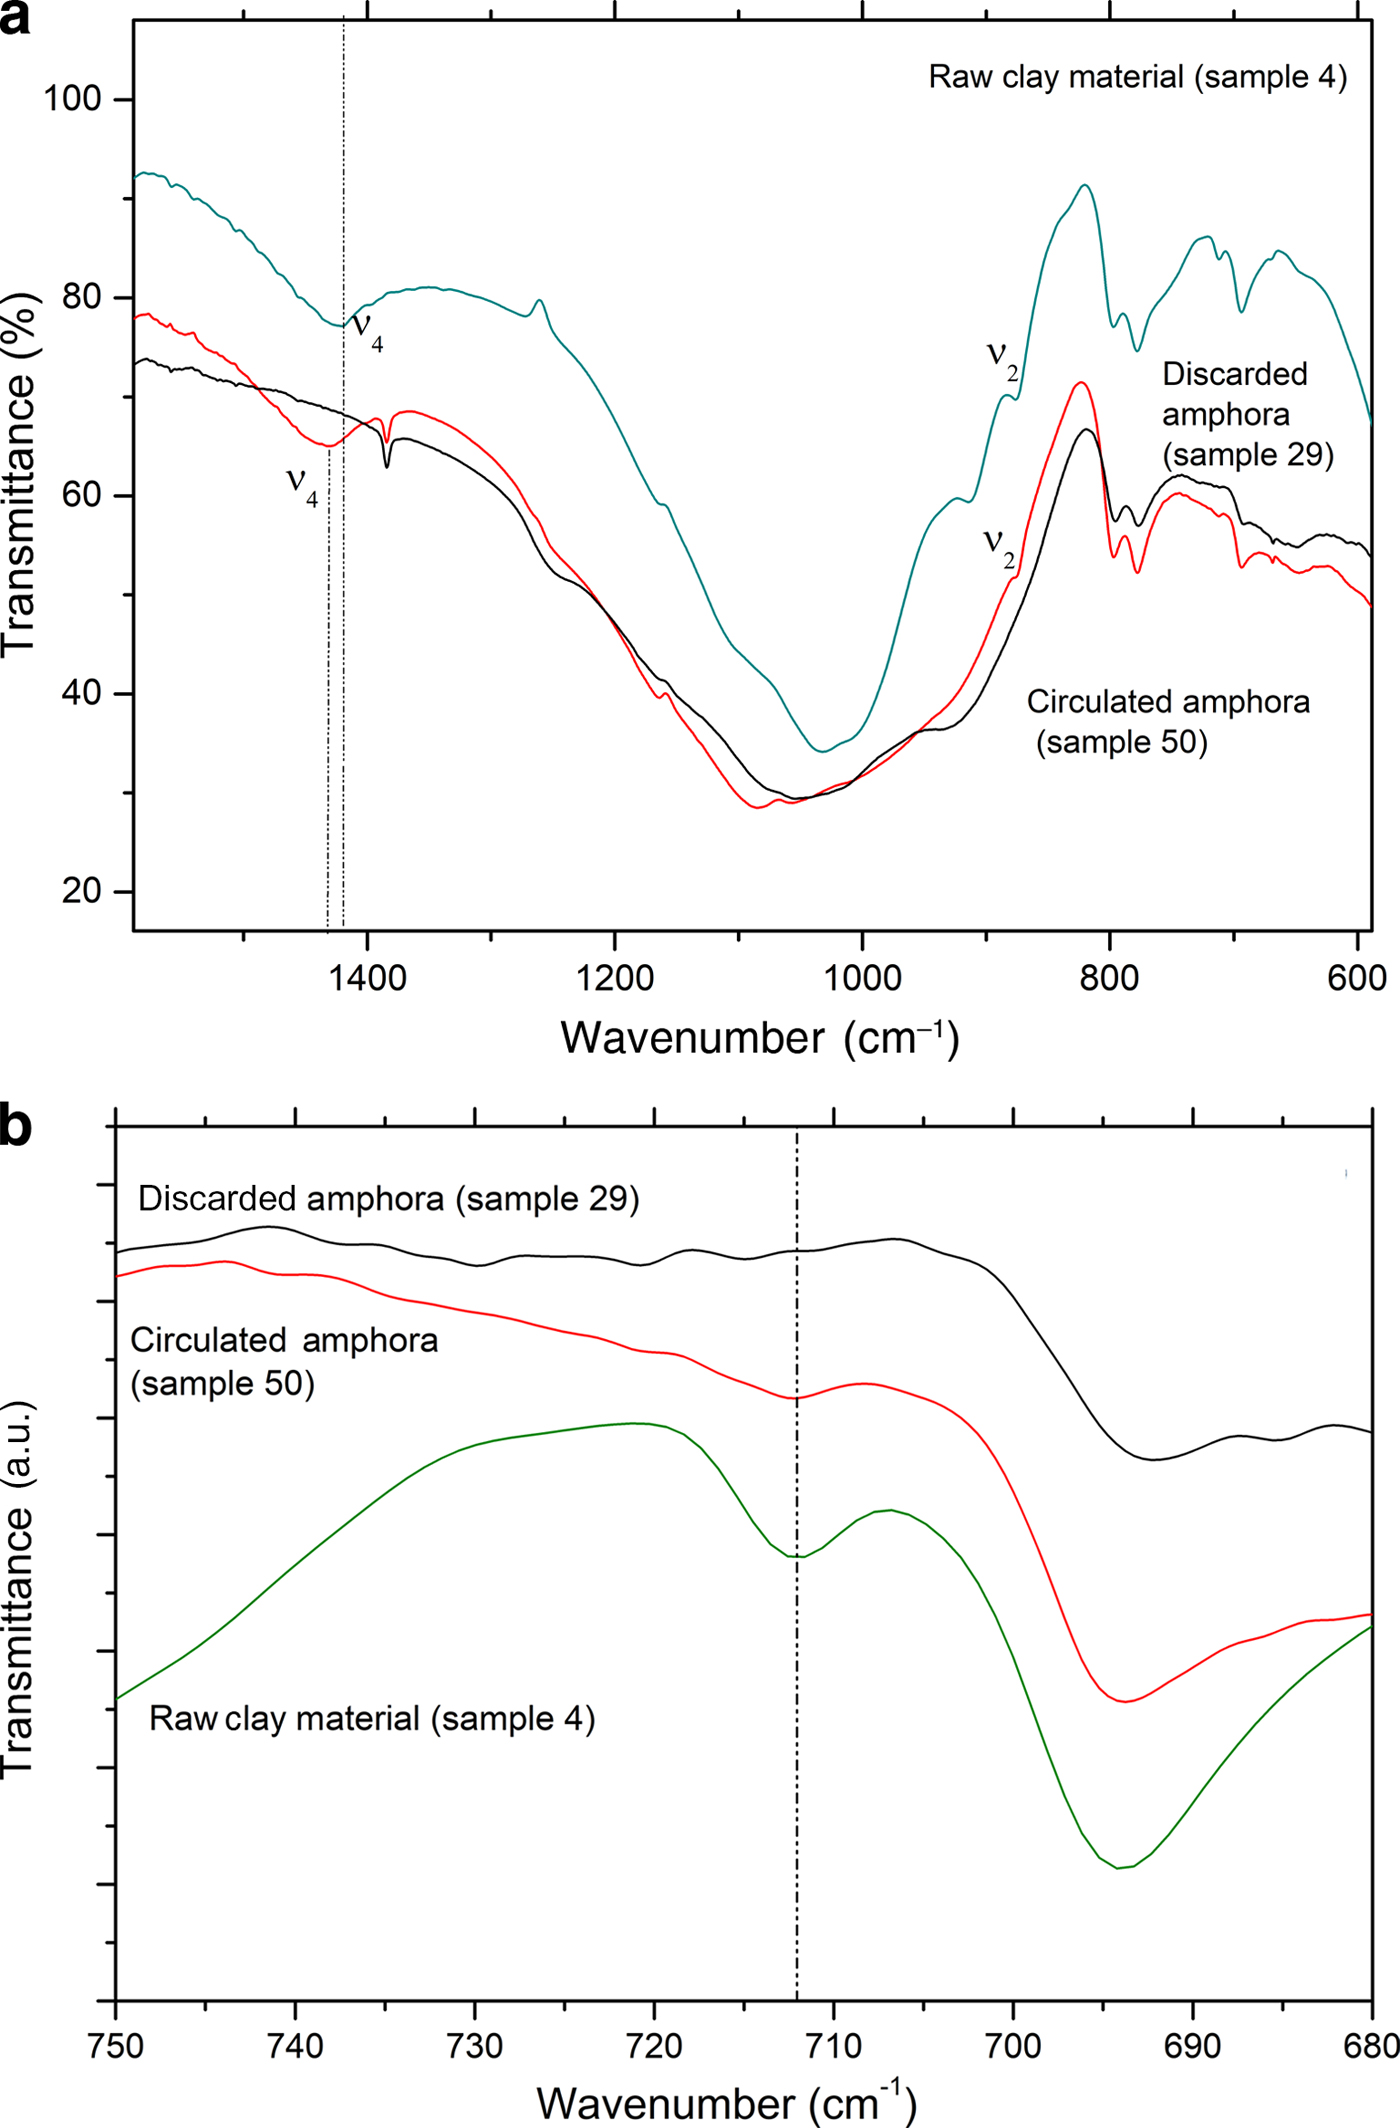
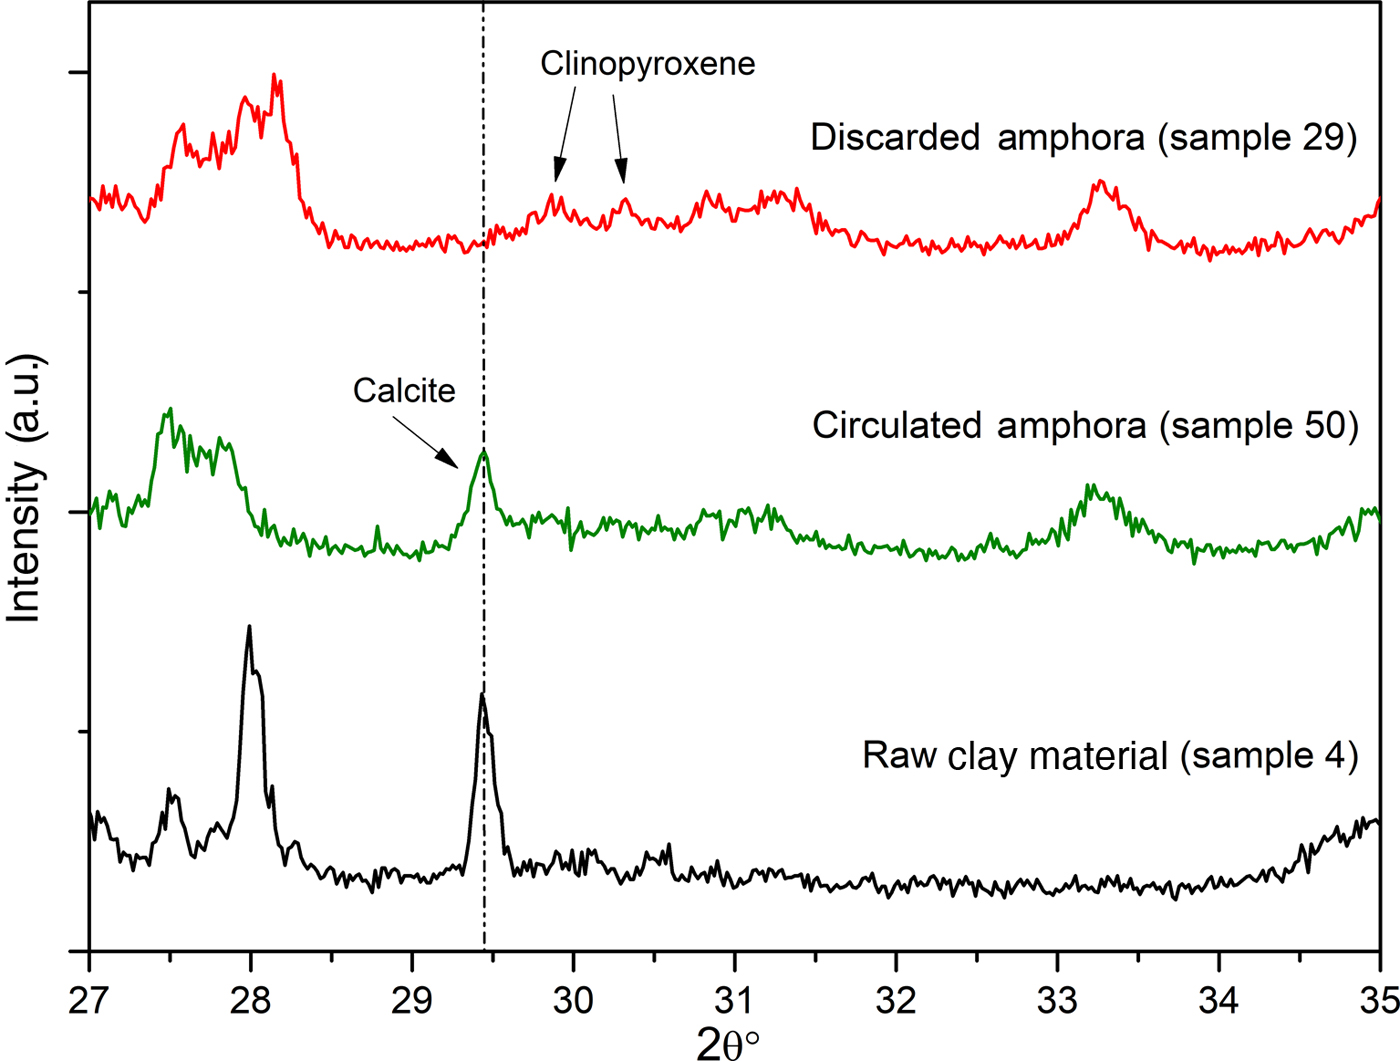
To support the assumption of reformed carbonates, selected samples were compared: one (calcite-free) from the production waste (sample 29) and another that is a good-quality product (sample 50), plotted against sample 4, a raw clay containing calcite. Their thermal analysis curves, FTIR spectra and XRD traces are compared in Figs 12, 13 and 14, respectively.

Fig. 12. (a) Thermogravimetric analysis and (b) differential thermogravimetric analysis (DTG) curves of raw clay material, a circulated amphora and a discarded amphora.

Fig. 13. Comparison of FTIR spectra of raw clay material, a circulated amphora and a discarded amphora: (a) 600–1600 cm–1 region and (b) 680–750 cm–1 region.

Fig. 14. Comparison of the XRD spectra of raw clay material, circulated amphora and a discarded amphora.
Sample 50 has a weight loss that is less than that of sample 4 (raw clay), but greater than that of sample 29 (production waste), as also observed by Comodi et al. (Reference Comodi, Nazzareni, Perugini and Bergamini2006) (Fig. 13a,b). The decomposition, better displayed in the DTG curves (Fig. 13b), is consistent with the decomposition of a carbonate phase that is not associated with a pure calcite phase. Indeed, this phenomenon occurs in the temperature range typical of carbonate decomposition, but is lower with respect to primary calcite. Such decomposition may be due to a secondary calcite-like structure rather than a residual amount of undecomposed calcite from the original sample. The presence of a secondary calcite phase has also been confirmed by the FTIR analysis in the region 1420–1450 cm–1 corresponding to the ν4 of carbonate species (Fig. 13a).
The very limited weight loss of sample 29 clearly confirms that this object was an over-fired waste, as no thermal phenomena are visible in the TG-DTG curves: the firing temperature was high enough that all of the CaO reacted with the clay, thus hampering the formation of Ca(OH)2 and its subsequent re-carbonation. The FTIR spectra in the region 680–750 cm–1 (Fig. 13b) and the XRD (Fig. 14) analyses confirm this hypothesis.
Furthermore, in the FTIR spectrum of sample 29, no bands of calcite were detected; such bands were visible in samples 50 and 4 in increasing amounts, as expected (Fig. 13b). Moreover, the overheating of sample 29 is confirmed by the XRD analysis (Fig. 14), which does not indicate calcite, but rather clinopyroxene, a high-temperature phase that occurs frequently during the firing of carbonate-rich clays, has been identified instead.
SUMMARY AND CONCLUSIONS
Nine raw clays and a selection of samples representing the main diagnostic group of amphorae produced in the Montelabate area in Italy were analysed following a multi-technique approach that, combined with geotechnical characterizations, provides new insight into ceramic-production technologies and their evolution over time. This integrated methodology might also be applied to a wide range of ceramics over various periods and areas.
The results are as follows:
1) At Montelabate, the potters exploited at least two different sources of raw material. The kilns were built around clay beds poor in calcite and rich in quartz (42–45%), plagioclase (9–10%), K-feldspar (4–7%) and phyllosilicates (muscovite 25%, montomorillonite 6–7% and chlorite 8–10%). Therefore, the non-calcareous clays were mixed with carbonate-rich clays. However, further processing of the raw material occurred with the addition of calcite. This clayey material was used to produce the local amphorae.
2) The addition of calcite underlines the manufacturing technology whilst the presence of carbonates in ceramics may be used as an indicator of the firing technology.
3) Calcite (natural or re-formed) provides information about the success of the firing process, thus helping to discriminate between good-quality and discarded amphorae. Indeed, different types of calcite may be identified depending on their genesis, such as an erroneous firing process (too high or too a low temperature) or re-carbonation due to post-firing reactions. Similarly, the presence of dolomite in the fired products suggests the use of a clay rich in chlorite.
To summarize, the firing temperature of the Montelabate amphorae was ~800°C, resulting in the formation of secondary carbonates from the carbonate-rich clay and the calcite added. Not only the raw material composition, but also a combination of the duration and temperature of firing may affect structural and mineralogical transformations. For instance, hematite and high-temperature phases like spinel may also provide information about the firing temperature, which might have exceeded 950°C, but the latter phase occurred only in one sample from Montelabate. Therefore, these reactions do not exclude temperature variations of hundreds of degrees inside the kilns. The presence of phyllosilicates and the absence of mineral decomposition and phase reactions between carbonates and silicates leading to the formation of gehlenite suggest that the firing process for the amphorae did not exceed 800°C. This study contributes to the understanding of the technical processes in ceramics production, leading to significant conclusions on the use of raw materials, the firing process and the manufacturing technology.
SUPPLEMENTARY MATERIAL
The supplementary material for this article can be found at https://doi.org/10.1180/clm.2018.30.
ACKNOWLEDGMENTS
The research was conducted through the support of the Montelabate Project, conducted and financed by the McDonald Institute of Archaeological Research and the Department of Archaeology, University of Cambridge, directed by Dr Simon Stoddart (University of Cambridge), Professor Caroline Malone (Queen's University Belfast) and Dr Letizia Ceccarelli, undertaken in collaboration with the Soprintendenza Archeologia Belle Arti e Paesaggio dell'Umbria. Special thanks to the Fondazione Gerolamo Gaslini and to the McDonald Institute for the loan of the portable XRF equipment. Dr Gabriele Cifani (University of Rome ‘Tor Vergata’) undertook the initial survey of the Montelabate area. The Roman Kilns Project is directed by Dr Letizia Ceccarelli (University of Cambridge).