


Introduction
The atmospheric concentration of CO2 ([CO2]) has grown exponentially since the Industrial Revolution and now exceeds 410 ppm, about 30% greater than 50 years ago (Mauna Loa Observatory, 2016). Burning fossil fuels and changing land use are the major causes of increased greenhouse gas emissions (IPCC, Reference Field, Barros, Dokken, Mach, Mastrandrea, Bilir, Chatterjee, Ebi, Estrada, Genova, Girma, Kissel, Levy, MacCracken, Mastrandrea and White2014) followed by an increase in the atmospheric temperature (Lacis et al., Reference Lacis, Schmidt, Rind and Ruedy2010). Along with increases in the global, seasonal, and daily average atmospheric temperature (Bloom, Reference Bloom2010), there will be increment in frequency and intensity of extreme climatic events, such as heat waves and changes in rainfall patterns causing drought or flooding in many regions of the Earth (Boers et al., Reference Boers, Goswami, Rheinwalt, Bookhagen, Hoskins and Kurths2019).
The current atmospheric CO2 available is lower than that for saturating C3 photosynthesis (Bloom, Reference Bloom2010; Bowes, Reference Bowes1993). Concentrations of 600 ppm of CO2 could increase C3 photosynthesis by 40% (Long et al., Reference Long, Ainsworth, Rogers and Ort2004). Stylosanthes hamata, a C3 legume, produced 85% more fresh and dry biomass under 650 ppm of CO2 growing in consortium with Panicum maximum, a C4 grass, in open-top chambers (Bhatt et al., Reference Bhatt, Baig, Tiwari and Roy2010). Raised [CO2] increased 30% the dry biomass production in a pasture containing C3 forage species Lolium perenne and Trifolium repens grown in experimental enclosures (Newton, Reference Newton1991; Newton et al., Reference Newton, Clarck, Bell, Galsgow and Campbell1994). These increments involved not only physiological adaptations but also leaf anatomical alterations, such as the increased number of chloroplasts per cell and mesophyll size (Pritchard et al., Reference Pritchard, Rogers, Prior and Peterson1999).
Field experiments conducted with free-air carbon dioxide enrichment (FACE) facility showed lesser stimulation of photosynthesis in C3 species than in enclosure ambient (Ainsworth and Long, Reference Ainsworth and Long2005; Leakey et al., Reference Leakey, Ainsworth, Bernacchi, Rogers, Long and Ort2009). FACE results are near to those in natural settings because the concentration of CO2 is usually lower than in open-top chambers (Long et al., Reference Long, Ainsworth, Rogers and Ort2004), and there is a direct influence of external factors (Ainsworth and Long, Reference Ainsworth and Long2005; Mauri, Reference Mauri2010). Regardless the approach for measuring the effect of [CO2] on plants, elevated CO2 concentration usually alleviates the harmful effects of warming on C3 plants by increasing carbon uptake via photosynthesis and better water use (Albert et al., Reference Albert, Ro-Poulsen, Mikkelsen, Michelsen, Van Der Linden and Beier2011). Nevertheless, for each 1.0 °C increment in seasonal temperature, a reduction of between 3 and 16% in crop yield is expected (Battisti and Naylor, Reference Battisti and Naylor2009) due to increased respiration and photorespiration in C3 species. Also, growth temperature above a finely tuned threshold can trigger flowering, bypassing the need for other inductive stimuli (Balasubramanian et al., Reference Balasubramanian, Sureshkumar, Lempe and Weigel2006).
Increased temperature may decline the impact of CO2 by augmenting the water demand (Easterling et al., Reference Easterling, Aggarwal, Batime, Brander, Erda, Howden, Tubiello, Parry, Canzani, Palutikof, van der Linden and Hanson2007). The combination of 450 ppm CO2 and 0.8 °C temperature increment enlarged yield by approximately 5.3% in rain-fed spring wheat, but the combination of 450 ppm and 1.8 °C above ambient reduced yield by roughly 5.7% (Xiao et al., Reference Xiao, Liu, Xu, Sun and Wang2005). Knowing how C3 forage species will respond in the field to a warmer, carbon-enriched atmosphere is necessary for predicting the foliage availability for livestock. According to the Ministry of Agriculture, Livestock, and Supply, Brazil has the second-largest livestock population in the world, with about 200 million head (MAPA, 2015) being a leading exporter responsible for 20% of all internationally traded meat involving over 180 countries since 2004. Despite the great importance of pastures on the food industry, there is no sufficient information to estimate the impact of the future climate change on tropical grasslands. As most Brazilian pastures are rain-fed, their production probably will be impaired by the predicted changes in rainfall patterns in the tropics, such as poorly and unevenly distributed rainfall with long periods of drought (Carter et al., Reference Carter, Jones, Lu, Bhadwal, Conde, Mearns, O’Neill, Rounsevell, Zurek, Parry, Canziani, Palutikof, van der Linden and Hanson2007).
The C3 legume forage S. capitata is similar to that of other species in the genus, such as Stylosanthes macrocephala, Stylosanthes bracteata, and Stylosanthes pilosa being highly resistant to the anthracnose and free of compounds interfering in cattle health (EMBRAPA, 2007). Also, S. capitata is perennial and responded positively to 2 °C temperature increase when grown in monoculture free of water shortage and nutritional impairments during vegetative stage (Martinez et al., Reference Martinez, Bianconi, Silva, Approbato, Lemos, Santos and Manchon2014). Our experiment was conducted during the early autumn at the beginning of the dry season in a rain-fed field in the southeast of Brazil when S. capitata was about to flower (Fortuna-Perez et al., Reference Fortuna-Perez, Silva and Tozzi2011) simulating a heat event based on the RCP6 climate scenario outlined by the Intergovernmental Panel on Climate Change (IPCC) for the year 2050 (rain-fed, 600 ppm CO2, and +2 °C). We employed a free-air temperature-controlled enhancement combined with a FACE system named Trop-T-FACE to simulate future climate change conditions of warming and elevated [CO2], respectively, in S. capitata pasture.
It was hypothesized that plants of S. capitata grown under 600 ppm of [CO2] would increase biomass production (Ainsworth and Rogers, Reference Ainsworth and Rogers2007; Albert et al., 2011; Bowes, Reference Bowes1993), enlarge leaf thickness (Miyazawa et al., Reference Miyazawa, Warren, Turpin and Livingston2011; Xu et al., Reference Xu, Salih, Ghannoum and Tissue2012), and intensify flowering by short-term changes in plant development (Ahuja et al., Reference Ahuja, de Vos, Bones and Hall2010). Under the increase of 2 °C, severe impairment of the vegetative and reproductive growth of S. capitata was expected because of the synergism between drought and elevated temperature causing low stomatal conductance to CO2 and a reduction in photosynthetic capacity by decreasing CO2/O2 specificity of Rubisco (Jordan and Ogren, Reference Jordan and Ogren1984). Although S. capitata is adapted to an elevated temperature (Martinez et al., Reference Martinez, Bianconi, Silva, Approbato, Lemos, Santos and Manchon2014), the combination of +2 °C increase and drought in the rain-fed field probably requires leaf modification to mitigate this stressful situation (Tomás et al., Reference Tomás, Medrano, Brugnoli, Escalona, Martorell, Pou and Flexas2014). Under treatment with both 600 ppm CO2 and warming, the increase in air temperature may cancel the benefits of elevated CO2 for photosynthesis (Battisti and Naylor, Reference Battisti and Naylor2009). However, because high atmospheric CO2 concentration is related to stomatal closure and further reduces transpiration (Bowes, Reference Bowes1993), enriched atmosphere effects can mitigate water stress by increasing water use efficiency. Thus, under 600 ppm and +2 °C, some aspects of initial regrowth in S. capitata probably will be similar to the Control, while still being hampered by the reduced water in the soil and by heating. By testing these hypotheses, we aimed to demonstrate how the leaf anatomy, early vegetative regrowth, and flowering of S. capitata could be affected in short term by a heat event and atmospheric CO2 enrichment in monoculture without irrigation. Studies of climate impacts on forage productivity are pivotal to support pasture management, particularly in areas where livestock production makes a significant contribution to the economy, as it does in Brazil.
Materials and Methods
Experimental area, species, planting, and standardization
The experiment was carried out at the Trop-T-FACE facility located on the campus of the University of São Paulo (USP) in Ribeirão Preto, São Paulo State, Brazil (21°10′08.0″S and 47°51′49.5″W, 546 m.a.s.l.) showing an Aw climate, tropical with rainy summers (Köppen and Geiger, Reference Köppen and Geiger1928). Historical data from 1982 to 2012 showed 21.9 °C as the average annual temperature, with minimum and maximum between 13.8 and 26.8 °C (Climate-Data.org, 2016). The soil in the experimental area is an Oxisol, dystrophic Red Latosol (Soil Survey Staff, 1999). After soil analysis, we performed land liming to correct the pH from the initial average values of 4.0–4.5 to 5.0–5.5 and chemical fertilization with NPK 4-14-8 fertilizer at a dose of 1 t ha–1.
On the 14th and 15th of January 2015, the C3 subshrub S. capitata was sown by rows surrounding and in the center of the plots of every treatment. Seeds of S. capitata were placed into holes 30 cm apart in 12 m × 12 m plots. We maintained only three plants per hole after germination. The genus Stylosanthes Sw. (Leguminosae) comprises 48 species with a pantropical distribution (Fortuna-Perez et al., Reference Fortuna-Perez, Silva and Tozzi2011). S. capitata Vogel is a perennial, 12–25 cm tall, with trifoliate leaves. Inflorescences are terminal or axillary, simple or composed of two to four stalks, with 11–20 flowers each (Fortuna-Perez et al., Reference Fortuna-Perez, Silva and Tozzi2011).
On 17 March 2015, 62 days after planting, we fertilized the area with urea in doses of 150 kg ha–1 on the soil surface. On 10 April 2015, we cut the plants 35 cm above the ground and began the CO2 fumigation and warming treatments. Irrigation occurred only on 2 days during seedling growth, on 24 and 29 April 2015, to stimulate early growth. Subsequently, the plantation was rain-fed, with the most significant rains occurring on 4, 7, 10, and 19 May 2015 with 41, 14, 21, and 16 mm, respectively.
Treatments in the Trop-T-FACE facility
The Trop-T-FACE facility is a combined free-air temperature-controlled enhancement (T-FACE) and mini-free-air carbon dioxide enrichment (miniFACE) system used to evaluate the performance of tropical pastures under future climate-change scenarios of elevated [CO2] and warming (Prado et al., Reference Prado, Camargo-Bortolin, Castro and Martinez2016). The treatments were the current atmospheric conditions (Control), CO2 enrichment (600 ppm, eC), warming (2 °C above ambient canopy temperature, eT), and a combination of eC + eT, with four replications. We established 16 plots, each taking the form of a 2-m diameter ring.
The miniFACE component for simulating high CO2 climate scenarios under field conditions was a modification of the POPFACE sonic injection system of pure CO2 designed by Miglietta et al. (Reference Miglietta, Peressotti, Vaccari, Zaldei, Scarascia-mugnozza, Cascine and Scienze2001). The miniFACE provided the treatment of elevated CO2 on eight of these plots. The eight miniFACE plots were placed randomly in the experimental area and located 10 m away from each other to minimize cross-contamination (Prado et al., Reference Prado, Camargo-Bortolin, Castro and Martinez2016). An air pump sampled the CO2 concentration at canopy height in the center of each miniFACE plot. Each plot contained a CO2 transmitter sensor model GMT222 (Vaisala, Helsinki, Finland) to measure [CO2] for manipulating the supply of pure CO2 gas in each plot. Individual valves using an ITV series automatic pressure regulator (SMC Corporation, Japan) controlled the amount of CO2 released in the plant canopy. A Proportional Integration Device (PID algorithm) controlled the CO2 supply to maintain automatically the ~600 ppm set point of elevated [CO2] in each fumigated plot.
An anemometer located 2 m above the ground in the center of the Trop-T-FACE facility determined the wind speed to assist in calculating the amount of CO2 to be injected into the plots. The CO2 supplementation began on 24 April 2015 at sunrise and ended at sunset on each day, until 17 June 2015. A protected computer on the site recorded all the variables (CO2 concentration, valve voltage, and wind speed) every 5 s during the experiment. Four of the eight miniFACE plots were also placed under high canopy temperature treatment (2 °C above the ambient) by using the free-air temperature-controlled enhancement (T-FACE) as a component of the Trop-T-FACE facility. Ceramic infrared heaters (model FTE-750-240 Salamander, Mor Eletric Heating, Alpine Ave NW, Comstock Park, MI 49321, USA) suspended above the ground of the warmed plots increased canopy temperature as described by Kimball et al. (Reference Kimball, Conley, Wang, Lin, Luo, Morgan and Smith2008). Salamander ALEX-F reflectors (Mor Electric) were mounted with the heaters on a triangular aluminum pole system. There were six heater units per plot, with a heater at each point of the hexagon. To produce a consistent amount of shade between the warmed and reference plots, we installed a similar array of dummy heaters in the reference plots consisting of aluminum reflectors without a heating element.
We established eight warmed plots keeping the heaters at 0.8 m above the canopy and eight reference plots (Controls). Infrared thermometers (model SI-1H1-L20, Apogee Instruments, Logan, UT, USA) measured the canopy temperature. A PID system installed in a Model CR1000 data logger with AM25T multiplexors (Campbell Scientific, Logan, UT, USA) controlled the heater voltage as recommended by Kimball et al. (Reference Kimball, Conley, Wang, Lin, Luo, Morgan and Smith2008). The LoggerNet software (Campbell Scientific) collected the data. For communication, an NL201 network link interface (Campbell, Scientific) and a wired Ethernet network connection with the data logger were used. The Trop-T-FACE system provided, continuously and automatically, an elevated temperature up to 2 °C above the ambient canopy temperature (Control) in the warmed plots.
Theta Probe soil moisture (ML2x) and temperature (ST2) sensors connected to a DL2e data logger (Delta-T Devices, Cambridge, UK) monitored, respectively, the soil water content and the soil temperature in each plot. An automatic microclimatic station (WS-HP1) monitored and stored continuously climatic data (air temperature, relative humidity, total irradiance) using specific sensors. A rain sensor located 5 km from the Trop-T-FACE area provided the precipitation data.
In summary, we designed the experiment to evaluate S. capitata leaf anatomy, initial regrowth, and biomass yield under an atmosphere enriched with CO2 (600 ppm, eC), a warming level 2 °C above the ambient temperature (eT), and under the combination of both CO2 enriched atmosphere and warming (eC + eT), for a total of 16 plots.
Measurements of the shoots
Measurements of vegetative and reproductive structures occurred weekly during the Brazilian autumn, from 30 April 2015 to 17 June 2015. The sample unit, a shoot, was defined as the central stalk and its ramifications, leaves, and inflorescences from the same marked initial lateral bud. Unfolded shoots were selected on five randomly chosen individuals of S. capitata in one quadrant of each plot per treatment. We chose three unfolded shoots with a maximum length of 2 cm on each of five individuals, resulting in 15 selected unfolded shoots per plot, totaling 60 marked shoots per treatment.
The number of flowering ramifications and the number of flowers on each ramification on the marked shoots were recorded to analyze the reproductive growth. The total number of flowers divided by the total number of marked shoots resulted in the number of flowers per shoot, indicating the flowering intensity in each atmospheric regime. The total number of flowers divided by the total number of ramifications with flowers resulted in the number of flowers per flowered ramification in each treatment indicating the intensity of flowering in the flower-bearing ramifications. We also recorded the shoot length, the number of leaves, and the number of ramifications per shoot. The number of leaves and the number of ramifications were also expressed per centimeter of the shoot, representing their distribution along with the shoot.
On 17 June 2015, the individuals with marked shoots were collected by cutting at the ground level identifying each marked shoot and its corresponding ramifications with stalk, foliage, and, eventually, inflorescences. We scanned the leaves to obtain the leaf area with ImageJ open-source software. The foliage and stalk of each shoot were separated in paper bags and dried in a forced-air circulation oven at 60 °C. The data of leaf and stalk dry biomass per shoot resulted in total shoot biomass. Thus, shoot biomass did not include the reproductive portion, that is, the inflorescences. Leaf and stalk biomass were also expressed per centimeter of the shoot, representing their distribution along with the shoot. The numbers of dead and living marked shoots were counted throughout the experimental period to determine their survivorship, calculated as the number of living shoots divided by the total number of marked shoots in each treatment.
Leaf anatomy measurements
It was possible to determine the thickness of the entire leaf and tissue layers in cross-sections from three central leaflets of sun leaves in each plot. The first leaf below the inflorescence was sampled between 13:00 h and 14:00 h on 17 June 2016, fixed in FAA for 24 h (Johansen, Reference Johansen1940), washed with 50% ethanol for 2 h, and stored in 70% ethanol. Samples 5 mm in diameter from the middle of each leaf were kept in terpineol oil for 2 days and embedded in glycol methacrylate (Leica Instruments, Heidelberg, Germany) (Kraus and Arduin, Reference Kraus and Arduin1997). Cross-sections (6 µm) were prepared with a microtome (Leica RM2245), stained with 1% toluidine blue for 5 min (O’Brien et al., Reference O’Brien, Feder and McCully1964), mounted on glass slides, and then digitally photographed (Leica DFC 500) with a light microscope (Leica DM4000 B) at 400× magnification. It was possible to determine the distance between the secondary vascular bundles as well as the thickness of different tissues always at the same points in the cross-sections. From each sample, we evaluated five sections and measured five cross-section points in each of them. The images analyzed with ImageJ software made possible to determine the thickness of the following leaf tissues: adaxial and abaxial cuticle and mucilage layer, adaxial and abaxial epidermis, palisade parenchyma, spongy parenchyma, and total leaf thickness. We also calculated the proportion of each tissue proportionally to the total leaf thickness.
Statistics
The XLStat software Version 2014.5.03 (Addinsoft® 1995–2014) performed the data analysis. We used at p < 0.1 a Chi-square test to compare the percentage of survivorship of shoots and the Mann–Whitney test to compare the average values for the growth parameters between atmospheric regimes. The discriminant analysis (multivariate) was applied to demonstrate the overall growth differences at p = 0.05 among atmospheric regimes. Each measured parameter related to vegetative and reproductive growth was graphically represented and considered together in the discriminant analysis. The leaf anatomical data were analyzed according to a randomized blocks design with an analysis of variance (ANOVA) to compare the effects of CO2 enrichment (eC), warming (eT), and the combined treatments (eC + eT) at p < 0.10. ANOVA analyses were performed using R software (R Core Team, 2013). In situations where there were outliers (detected by a residue analysis), we estimated a new value with the ANOVA statistical model used.
Results
Climate, canopy temperature, soil water content, and CO2 concentration
The experimental period was usually free of clouds with solar irradiance between 0.70 and 0.90 kW m–2 at midday, whereas cloudy or rainy days showed 0.50–0.20 kW m–2 at noon on 7 May and 2 June (Figure 1a). The highest (0.89 kW m–2) and lowest (0.20 kW m–2) irradiances at noon happened on 5 May and 2 June, respectively. The reduced relative humidity typically occurred with peaks of soil temperature and solar irradiance around midday, mainly after 2 June when the rainy period ended (Figure 1a, Figure 1b and Figure 2). The minimum relative humidity at noon was 33.0% on 13 June (Figure 1b), and the average of the experimental period was 85.1%. Wind speed rarely exceeded 1.5 m s–1 and only once reached 2.0 m s–1 on 14 June (Figure 1c). The maximum canopy temperature on 17 June in the warmed plot (33.5 °C, Figure 2) was not stressful for S. capitata because its optimum temperature for growth is between 30 and 40 °C (Date, Reference Date1989). Soil temperature varied between 16.5 and 24.0 °C under Control and warmed regimes (Figure 1d). The maximum soil temperature (24 °C) on 3 May was below the 30/40 °C night/day root temperature for optimal growth and nitrogen fixation in Stylosanthes (Date, Reference Date1989). Under the heated regimes, the soil temperature was 1.5 °C higher, especially during the night (Figure 1d). The T-FACE system successfully maintained the warmed plots near the set point of +2 °C most of the time (Figure 2). The canopy temperature varied between 8.4 and 33.5 °C with the lowest and the highest values recorded at night and day, respectively (Figure 2).
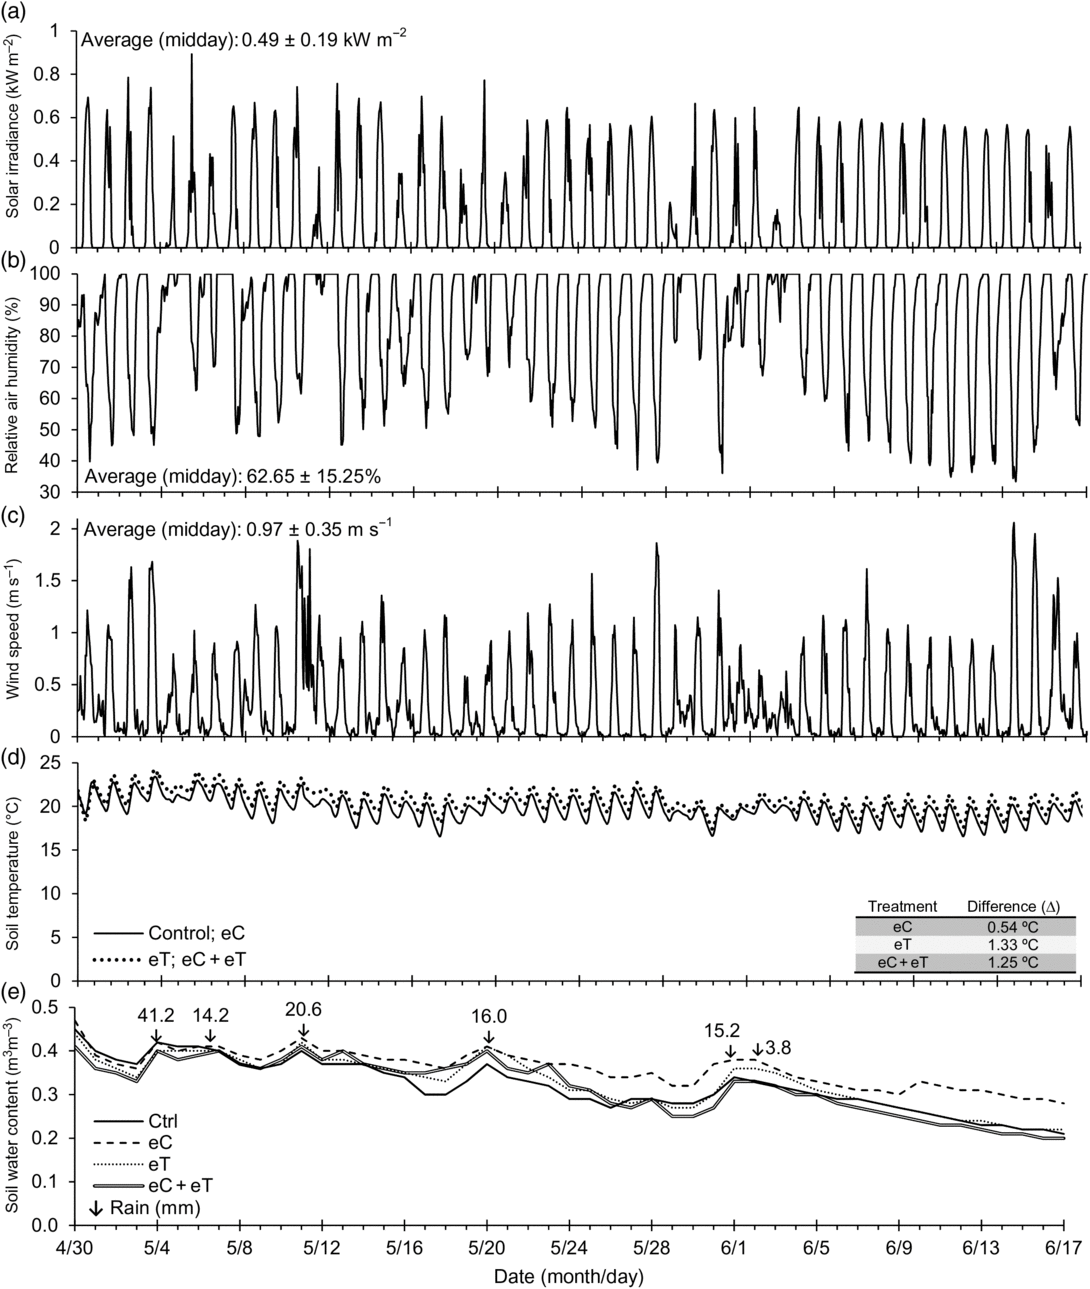
Figure 1. The daily and midday average values (±standard deviation) of total solar irradiance (a), relative air humidity (b), and wind speed (c) from 30 April to 17 June 2015 at the center of the experimental area. The soil temperature in heated and non-heated treatments (d), with the average of the differences (Δ) between those treatments and the Control. The continuous line represents the averages in plots with natural conditions of CO2 and temperature (Control) and enriched CO2 at 600 ppm (eC). The dotted line represents the averages of enhanced temperature +2 °C above ambient (eT), and the combined treatments (eC + eT). The soil water content (e) was obtained in Control (Ctrl), eC, eT, and eC + eT. The arrows with numeric values in (e) indicate rainfalls (mm) during the experimental period.

Figure 2. Daily canopy temperatures recorded from 30 April to 17 June 2015. The averages of the plots with ambient CO2 and temperature (Control), and with 600 ppm of CO2 (eC), are represented by a continuous line. The averages of the plots with the temperature at 2 °C above ambient (eT), and with the combined treatments (eC + eT), are represented by a dotted line. The average of the differences between the treatments and the Control are shown as the Δ values.
Peaks of soil water content were recorded in rainy events not exceeding 0.43 m3 m–3 (Figure 1e). Accumulated rainfall from 30 April to 17 July was 113 mm. High values of soil water content were obtained under the eC treatment most of the time, especially from 22 May to the end of the experiment (Figure 1e). On 28 May, the soil water content in the Control, eT, and eC + eT treatments reached 0.30 m3 m–3, while under eC it was close to 0.40 m3 m–3 (Figure 1e). Immediately after 1 June 2015, under the control and warming treatments, soil water content markedly declined and by the end of the experimental period reached close to 0.20 m3 m–3. Nevertheless, under eC, soil water content values never fell below 0.30 m3 m–3 (Figure 1e).
The average ± standard deviation of [CO2] in the enriched plots was 595 ± 20 ppm during the daytime. The daily average [CO2] in Control plots was 395 ± 15 and 584 ± 15 ppm during the day and night, respectively. The higher [CO2] during the night was associated with nocturnal heterotrophic soil respiration.
Vegetative and reproductive growth
There were no differences in stalk biomass per shoot or total shoot biomass across atmospheric regimes (Table 1). However, leaf biomass per shoot was 39 and 32% lower than Control in eC and eT, respectively. Leaf area per shoot and leaf area by a centimeter of the shoot was 20–37% inferior under all treatments except for eC + eT that did not change the leaf area per shoot significantly compared to Control (Table 1). Single eT was more unfavorable to leaf biomass per shoot and leaf area per shoot than the combined eC + eT treatment. Also, the survivorship of shoots decreased only in heated plots (eT and eC + eT). The flowering was more intense under eC than Control expressed as the number of flowers per shoot (+23%) or by the number of flowers per flowered ramification (+33%, Table 1). Contrastingly, the number of flowers per flowered ramification decreased under eT (−32%, Table 1). The flowering stimulation of rising [CO2] and the flowering impairment by warming was evident with the similar and low average values regarding the number of flowers per flowered ramification in eC + eT and eT, respectively.
Table 1. Percentage of shoot survivorship and average ± standard error of vegetative and reproductive growth parameters of Stylosanthes capitata grown under different atmospheric regimes: ambient CO2 and temperature (Control), 600 ppm of CO2 (eC), canopy temperature 2 °C above (eT), and eC + eT. Different letters after percentage of survivorship or ± standard error indicate significant differences at p < 0.1 by Chi-square test for shoot survivorship and Mann–Whitney test for the other parameters. Values in brackets indicate the percentage of increasing (+) or decreasing (−) about Control

The discriminant analysis confirms those results of vegetative and reproductive growth by outputting differences among atmospheric regimes at p = 0.05 (Figure 3). There are four sets of symbols representing the three treatments and the Control with arrows pointing to the centroids of each set. The symbols representing eT stand out to the right of the others, indicating a more differentiated plant response. It corroborates with results described earlier in Table 1 being warming harmful to some vegetative and reproductive growth. The set of symbols representing eC + eT appeared between those referring to eC and eT and overlapping some Control symbols. This intermediate position of eC + eT symbols is consistent with the mitigation by eC of some adverse eT on vegetative (leaf biomass and area per shoot) and reproductive (number of flowers per flowered ramification) growth shown in Table 1. The distinct effects imposed by eC and eT on vegetative and reproductive growths are represented by the great distance of the centroids and the opposition of the areas occupied by the corresponding symbols of both treatments (Figure 3).

Figure 3. Discriminant analysis considering all vegetative and reproductive growth parameters of Stylosanthes capitata grown under ambient CO2 and temperature (Control), under 600 ppm of CO2 (eC), under foliar temperature 2 °C above ambient (eT), and under eC + eT. Symbols represent a synthesis of all parameters measured in each shoot. Different symbols indicate the treatments applied: control ( ), eC (
 ), eT (
 ), and eC + eT (
 ). Arrows point to the centroid of the distribution of observations in each treatment. The proximity of symbols or centroids indicates how close the atmospheric regimes are associated.
In Figure 4 it is possible to identify four periods of flowering (P1–P4). After irrigation at the beginning of the experiment from 30 April to 8 May, the average number of flowers per shoot was similar in all climatic regimes with soil water content (SWC) higher than 0.30 m3 m–3 (P1). The differences of soil temperature (ΔT) and soil water content (ΔSWC) between non-warmed and warmed regimes varied broadly with high soil water moisture due to initial irrigation and rains along P1 (Figure 4c). The average number of flowers per shoot was higher in warming than in non-warming regimes in P2 (Figure 4a). Heated regimes probably favored flowering along P2, when the rains of 20.6 and 16 mm kept SWC above 0.30 m3 m–3. ΔT and ΔSWC showed a broader range of daily variation in high soil moisture between P1 and P2 than in the last P4 period, which was free of rain (Figure 4c). At the beginning of P3, SWC reached 0.30 m3 m–3, but it was 0.35 m3 m–3 in eC, with a new flowering behavior without particular divergence between warming and non-warming regimes (Figure 4a, Figure 4b). From P1 to P4, the SWC was higher than 0.30 m3 m–3 only in eC with flowering increasing or showing slight decreasing resulting at the end of the experiment in the highest average values regarding the number of flowers per shoot (Table 1). In P3 there was a reduced oscillation of ΔT, but ΔSWC increased before the rains displaying that the transient water availability affected more ΔSWC than the soil ΔT. Without rains at P4, the SWC dropped to values lower than 0.30 m3 m–3 in all regimes with an exception in eC. The flowering promotion was evident in eC, probably because of the favorable availability of carbon from the atmosphere and water from the soil.
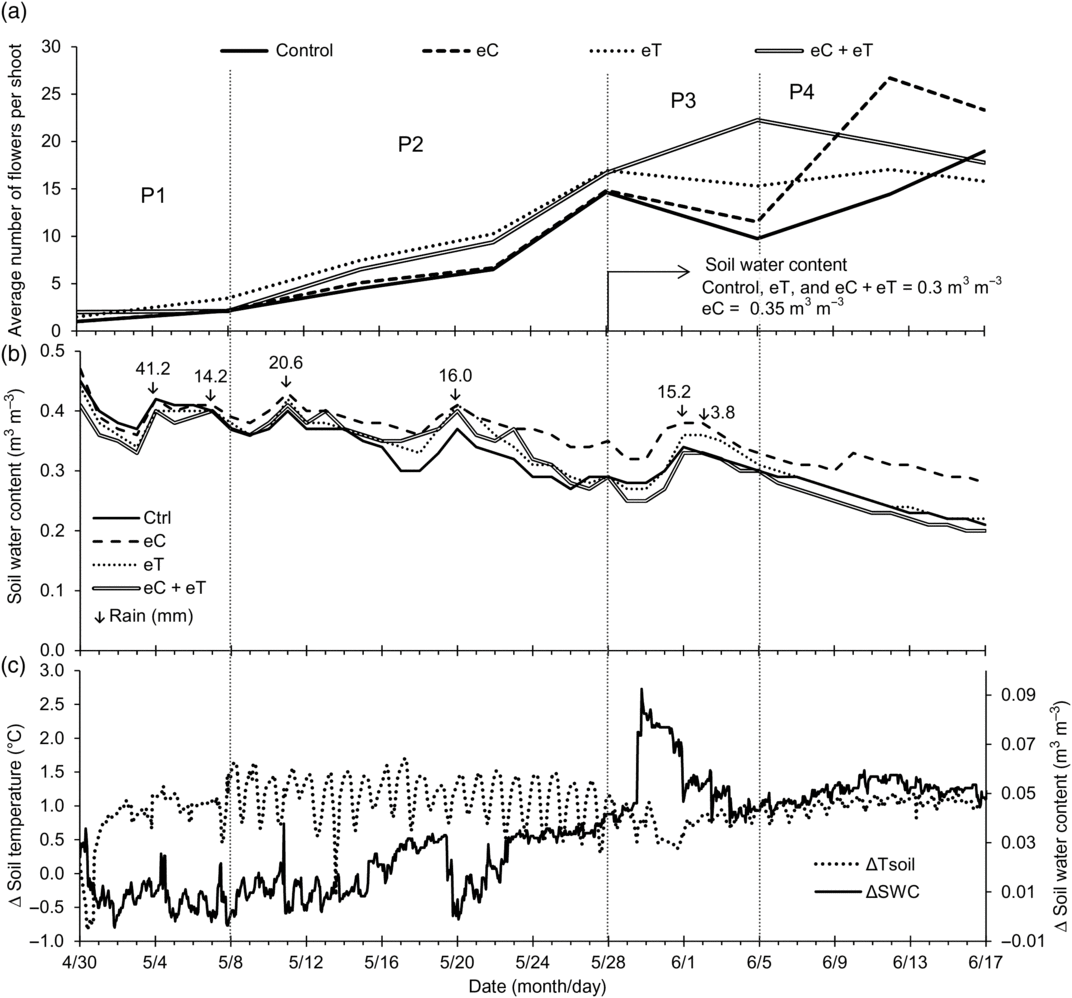
Figure 4. Flowering, daily soil water content, and differences of soil temperature and soil water content during the experimental period from 30 April 2015 to 17 June 2015. Four periods (P1–P4) were depicted according to flowering behavior. (a) Average number of flowers per shoot in Stylosanthes capitata under ambient CO2 and temperature (Control, solid line), under 600 ppm of CO2 (eC, dashed line), under foliar temperature 2 °C above ambient (eT, dotted line), and under both treatments (eC + eT, open line). (b) Soil water content in plots under Control, eC, eT, and under eC + eT. Arrows with numeric values represent the rainfall intensity (mm). (c) Average soil temperature differences (ΔTsoil) between non-warmed (control and eC) and warmed (eT and eC + eT) regimes and the average of the differences in soil water content between eC and the other atmospheric regimes.
Leaf anatomy measurements
The anatomy of the adaxial cuticle and mucilage layer, and the adaxial epidermis in S. capitata, along with total leaf thickness, did not show any alterations under elevated CO2 and warming (Figure 5). However, the leaves grown under elevated CO2 showed a palisade parenchyma 9% thicker than the Control leaves. The eT treatment reduces the spongy mesophyll by 15% and the abaxial cuticle and mucilage layer by 5%, compared with leaves grown under Control. No interaction between CO2 and temperature was detected for any of these leaf anatomical traits.

Figure 5. Isolated and combined effects of elevated CO2 and temperature on leaf anatomical characteristics of Stylosanthes capitata. Each leaf tissue is represented by a different color, and the measurements given (µm) are averages of four replications (n = 4). The percentage (%) of each tissue concerning total leaf thickness is shown for the adaxial and abaxial epidermis and palisade and spongy parenchyma in the columns. The negative bars (−SE) represent the standard error for leaf layer thickness (µm) and the positive bars (+SE) for total leaf thickness (µm). Treatments: Control (ambient CO2 and temperature), eC (600 ppm CO2 concentration and ambient temperature), eT (ambient CO2 concentration and 2 °C above ambient canopy temperature), and eC + eT (600 ppm CO2 concentration and 2 °C above ambient canopy temperature). Significant differences (p < 0.1) between the treatments and the control are indicated by an asterisk (*).
Discussion
The vast majority of studies of growth and biomass accumulation in C3 plants conducted in an atmosphere enriched with CO2 showed enhanced C3 plant growth and yield (Bhatt et al., Reference Bhatt, Baig, Tiwari and Roy2010; Leakey et al., Reference Leakey, Ainsworth, Bernacchi, Rogers, Long and Ort2009; Marabesi, Reference Marabesi2007; Wand et al., Reference Wand, Midgley, Jones and Curtis1999). Commonly, these studies used a different type of growth chambers or open-top chambers to maintain elevated [CO2] besides ample water availability to roots overestimating the C3 plants’ gains (Ainsworth and Long, Reference Ainsworth and Long2005). In such studies, the reported increases in total biomass are approximately 40% (Poorter, Reference Poorter1993; Wand et al., Reference Wand, Midgley, Jones and Curtis1999). Here, despite the investment in palisade parenchyma leading to an increase in leaf thickness, the leaf production was not benefited on mass or area per shoot in eC. Leaf parenchyma is one of the most massive sinks of carbon in a leaf (Bolhar-Nordenkampf, Reference Bolhar-Nordenkampf, Coombs, Hall, Long and Scurlock1985). The larger cells and thicker palisade layer in plants grown under elevated CO2 often exhibit an increase in the number and size of chloroplasts, and this provides more gas exchange area since the number of chloroplasts facing the cell wall also increases (Xu et al., Reference Xu, Salih, Ghannoum and Tissue2012). Beyond these changes, a thicker palisade layer may also be related to an enhanced ability to spread light to internal regions of the mesophyll (Terashima and Hikosaka, Reference Terashima and Hikosaka1995) increasing the photosynthetic rate, decreasing the likelihood of photoinhibition (Nishio and Whitmarsh, Reference Nishio and Whitmarsh1993) and consequently enhancing biomass accumulation. However, stalk and shoot biomass remained similar to the Control besides the foliage production per shoot decreasing in eC. As shoot biomass only included stalk and leaf and did not add the flowers, the more magnificent flowering indicated more photoassimilates allocation in the reproductive organs under eC.
The lack of irrigation probably was not the primary factor in the reduction of leaf production per shoot since there was more favorable soil water availability in eC until the end of the experiment (usually greater than 0.30 m3 m–3). S. capitata reduced the leaf production per shoot despite the potentially increased CO2 uptake capacity by thicker palisade parenchyma and by higher water and CO2 availability, respectively, to roots and leaves, indicating a down-regulation about foliage production per shoot in eC. Also, if eC contributed to higher water use efficiency (Bowes, Reference Bowes1993; Long and Ort, Reference Long and Ort2010), this contribution per se did not result in a gain of autotrophic tissues per shoot. Since the leaf biomass provides the food supply for the cattle, elevated CO2 in the atmosphere would not be favorable for supplying livestock by rain-fed S. capitata even under favorable soil moisture due to the down-regulation of leaf production per shoot.
In general, elevated temperature harms C3 plants (Fagundes et al., Reference Fagundes, Paula, de Lago, Streck and Bisognin2010). However, in a previous study with S. capitata in the same experimental area using irrigation, Martinez et al. (Reference Martinez, Bianconi, Silva, Approbato, Lemos, Santos and Manchon2014) found increased biomass production by 16% under moderate warming (+2 °C) during the vegetative stage. Warming without water and nutritional restrictions were beneficial for the physiological and biophysical processes involved in S. capitata leaves (Habermann et al., Reference Habermann, Dias de Oliveira, Contin, San Martin, Curtarelli, Gonzalez-Meler and Martinez2019; Martinez et al., Reference Martinez, Bianconi, Silva, Approbato, Lemos, Santos and Manchon2014). Our study was conducted under similar temperature and soil nutritional conditions as carried out by Martinez et al. (Reference Martinez, Bianconi, Silva, Approbato, Lemos, Santos and Manchon2014), but rain-fed instead of being irrigated. The leaf water potential at noon and leaf water content at pre-dawn is typically 9% lower in eT than in Control (Habermann et al., Reference Habermann, Dias de Oliveira, Contin, San Martin, Curtarelli, Gonzalez-Meler and Martinez2019). The values of soil water content decreased from 0.45 to 0.25 m3 m–3 at the end of P4 in eT. By comparing our results of foliage production with those of Martinez et al. (Reference Martinez, Bianconi, Silva, Approbato, Lemos, Santos and Manchon2014), it is evident that the lower soil water content under eT was hampering the foliage regrowth of S. capitata since shoot survivorship and the biomass and area of leaves per shoot diminished.
Therefore, when the temperature was moderately elevated, S. capitata invested less in vegetative growth and even in reproduction (lower number of flowers per flowered ramification) in rain-fed conditions. It was the absence of irrigation aggravated by the warming that was responsible for the impairment of the vegetative regrowth and flowering under eT rather than the single warming (LeCain et al., Reference LeCain, Smith, Morgan, Kimball, Pendall and Miglietta2015; Wall et al., Reference Wall, Kimball, White and Ottman2011). The increased foliage temperature and water stress probably nullified the benefits of elevated CO2 concentration for photosynthesis in the rain-fed plantation of S. capitata by increasing respiration, photorespiration, mesophyll resistance to carboxylation and stomatal resistance to CO2 access (Battisti and Naylor, Reference Battisti and Naylor2009; Monteiro and Prado, Reference Monteiro and Prado2006). These stressful conditions resulted in less number of flowers per flowered ramification and inferior area and mass of leaves per shoot in eT. In short, the absence of irrigation nullified the potentially favorable conditions under moderated warming +2 °C, being the effect of eT detrimental to vegetative and reproductive growth in rain-fed circumstances. It is an alarming result for using S. capitata as forage in the future, since its initial regrowth may be impaired by higher temperatures under the heat waves expected to accompany the global climate change in south-eastern Brazil (Andrade, Reference Andrade2013; IPCC, Reference Field, Barros, Dokken, Mach, Mastrandrea, Bilir, Chatterjee, Ebi, Estrada, Genova, Girma, Kissel, Levy, MacCracken, Mastrandrea and White2014).
The thinner spongy parenchyma under moderate warming was related to spongy cell number and volume diminishing (Chabot and Chabot, Reference Chabot and Chabot1977; Tomás et al., Reference Tomás, Medrano, Brugnoli, Escalona, Martorell, Pou and Flexas2014). Due to the relationship between cell wall elasticity and cell size, small cells can support a higher negative turgor pressure than large cells (Chartzoulakis et al., Reference Chartzoulakis, Patakas and Kofidis2002), reducing the probability of cell collapse under drought conditions, a regular adaptation of xeromorphic species (Oertli et al., Reference Oertli, Lips and Agami1990). Total leaf thickness under moderate warming decreased by approximately 10% as expected (Figure 5), with thinner spongy parenchyma contributing to this. This phenomenon is essential in eT because thinner leaves lose more energy by conduction processes due to their higher capacity for thermal conductivity (Chandra, Reference Chandra2004). Moreover, thinner spongy parenchyma provides less resistance to carboxylation because it shortens the path of the CO2 from the atmosphere to the palisade parenchyma. However, these alterations in spongy parenchyma did not avoid the declining of survivorship and the production of foliage in mass or area per shoot in eT.
Therefore, in grazing areas without irrigation and subject to elevated CO2 or warming, S. capitata will experience significant unfavorable conditions for growing as in the future climate changes. Nonetheless, irrigation of an extensive area may cause the loss of water courses, soil salinization, and contamination (Khan and Hanjra, Reference Khan and Hanjra2008). Our results specify a disturbing situation since the future climate will change rainfall patterns in south-eastern Brazil (Marengo, Reference Marengo2006), the region with the second-largest Brazilian cattle herd (MAPA, 2015).
The adverse effects of eC associated with the down-regulation of foliage production and the adverse effect of eT regarding the access and assimilation of CO2 were partially compensated in the combined treatment given that the leaf area and leaf biomass per shoot were similar to the Control in eC + eT. Other compensatory effects in eC + eT are evident by percentage values less negative in combined than in eT treatment. However, foliage production per shoot in eC + eT was also similar to eC and eT. Moreover, the shoot survivorship was the lowest in eC+eT. In the combined treatment, the down-regulation of leaf production and the constraints to CO2 assimilation probably are associated with the decreasing shoot survivorship. Therefore, each atmospheric regime acts differently (p = 0.05) on vegetative and reproductive growth of S. capitata, but neither none of these (eC, eT, and eC + eT) promoted the leaf area or leaf biomass production per shoot.
In conclusion, the elevated [CO2] and leaf temperature associated with decreasing of soil water content in rain-fed plantations of S. capitata will impair foliage production and increase shoot mortality during Brazilian autumn. The effects of high atmospheric CO2 concentrations on the C3 photosynthesis pathway will not be enough to offset the adverse effects of warming and water shortages in autumn in expected future climate change. Despite significant differences in leaf tissue related to drought and elevated temperature, they will not also be sufficient to compensate for the stressful conditions in the field under eC or eT. Single CO2 enrichment (600 ppm) will down-regulate foliage production and promote flowering, especially during the period of favorable soil water content. The eT foliage enhancement (+2 °C) will also decrease leaf production and increase shoot mortality. The combined treatment eC + eT will increase shoot mortality without promoting foliage production in remaining shoots.
Acknowledgements
We thank Bruce Kimball from the USDA; Franco Miglietta, Alessandro Zaldei, and Damiano Gianelli from IBIMET, Italy; and graduate and undergraduate students from the University of São Paulo, Ribeirão Preto Campus, for valuable assistance in installing the miniFACE and T-FACE infrastructure. CAM and CHBAP are fellow researchers from CNPq. We thank SAFRASUL, and Dr. Celso D. Fernandes from EMBRAPA for providing seeds of S. capitata.
Financial support
This work was supported by the Sao Paulo Research Foundation (FAPESP)-Thematic Project (Grant process 2008/58075-8) and CNPq/ANA/MCTI (Grant process 446357/2015-4) to CAM, and FAPESP scholarships grants to LHGCB (Ph.D. scholarship 2012/20847-5), and EH (Master scholarship 2014/26821-3).


