Introduction
Topaz is a F/OH-bearing nesosilicate, Al2SiO4(F,OH)2, that is usually found as an accessory and late-stage crystallization mineral in a wide variety of geological settings, such as F-rich felsic magmatic (rhyolites and granites) rocks, late-magmatic rocks (pegmatites) and post-magmatic rocks (greisens), hydrothermal veins and also in high-temperature and high- to ultrahigh-pressure metamorphic rocks, especially kyanite topaz-bearing quartzites (Zhang et al., Reference Zhang, Liou and Shu2002; Marshall and Walton, Reference Marshall, Walton and Groat2007; Agangi et al., Reference Agangi, Kamenetsky, Hofmann, Przybyłowicz and Vladykin2014, Reference Agangi, Gucsik, Nishido, Ninagawa and Kamenetsky2016).
Topaz crystallizes in the orthorhombic system within the Pbnm space group. Its crystal structure consists of crankshaft chains of edge-sharing [AlO4(F,OH)2]-octahedra connected by isolated [SiO4]-tetrahedra, which run parallel to [001]. It is also characterized by a combination of cubic and hexagonal close packing, perpendicular to [010], in which OH-anion layers alternate with and F-anion layers (Gaines et al., Reference Gaines, Skinner, Foord, Mason, Rosenzweig and King1997; Alberico et al., Reference Alberico, Ferrando, Ivaldi and Ferraris2003; Schott et al., Reference Schott, Rager, Schürmann and Taran2003; Gatta et al., Reference Gatta, Nestola, Bromiley and Loose2006).
The major-element composition of topaz is fairly constant and its variation is only related to the OH/F concentration ratio (Skvortsova et al., Reference Skvortsova, Mironova-Ulmane, Trinkler and Chikvaidze2013). The OH content in topaz does not usually exceed X OH < 0.50 [X OH = OH/(F + OH)], due to the ‘proton-proton avoidance’, observed by Barton (Reference Barton1982). However, the studies carried out by Zhang et al. (Reference Zhang, Liou and Shu2002) with topaz crystals of high- to ultrahigh-pressure metamorphic rocks (kyanite topaz-bearing quartzites) from Sulu terrane (Eastern China), have showed 0.35 ≤ X OH ≤ 0.55. With respect to the trace-element composition of topaz, other studies show significant variations in Ti, V, Cr, Mn, Fe, Cu, Zn, Ga and Ge (Leroy et al., Reference Leroy, Rodríguez-Rios and Dewonck2002; Wasim et al., Reference Wasim, Zafar, Tufail, Arif, Daud and Ahmad2011; Wu et al., Reference Wu, Liu, Gu, Zhang and Lei2011; Breiter et al., Reference Breiter, Gardenová, Vaculovič and Kanický2013; Agangi et al., Reference Agangi, Kamenetsky, Hofmann, Przybyłowicz and Vladykin2014, Reference Agangi, Gucsik, Nishido, Ninagawa and Kamenetsky2016).
Imperial topaz is an orange-yellow to cherry-red variety of topaz that was reported in the Ouro Preto region, Minas Gerais state, Brazil, in the 18th century (Silva and Ferreira, Reference Silva and Ferreira1987). A study on topaz from Ouro Preto, applying EMPA (electron microprobe analyses) and EPR (electron paramagnetic resonance), detected elements such as Ti3+, Ti4+, V4+, Cr3+, Mn3+ and Fe3+ (Schott et al., Reference Schott, Rager, Schürmann and Taran2003). However, the imperial topaz fingerprint has not been determined definitively. In order to characterize it, four samples from Dom Bosco mine (Ouro Preto, Brazil) were analysed with the following techniques: cathodoluminescence (CL), including scanning electron microscope cathodoluminescence (SEM-CL), coloured optical microscope cathodoluminescence (OM-CL), cathodoluminescence spectrometry (CL-spectrometry); EMPA; laser ablation inductively-coupled plasma mass spectrometry (LA-ICP-MS); and Raman spectroscopy. Cathodoluminescence will permit the identification of defects in the structure of topaz. These defects can be related to lattice defects (vacancies, broken bonds, etc.) or to the incorporation of some trace elements in the crystal structure of topaz. Also, CL enables the visualization of textures which are not observed by other methods, such as transmitted light microscopy, and backscattered electron (BSE), secondary electron (SE) and SEM imaging. EMPA and LA-ICP-MS will enable the quantitative elemental analysis of topaz. These techniques will provide the major- and trace-element compositions, respectively. In our study, EMPA will be important to understand the OH/F ratio in imperial topaz and if there is any relation of these elements with the CL-intensity in imperial topaz. LA-ICP-MS will be important to understand whether some trace elements activate CL in topaz, and how the concentrations of these trace elements may relate to high CL-intensity. Raman will enable observation of the molecular structure of topaz, especially the vibrational and stretching modes of [SiO]4-tetrahedra and [AlO6]-octahedra, and the behaviour of the OH stretching mode in imperial topaz.
Geological setting
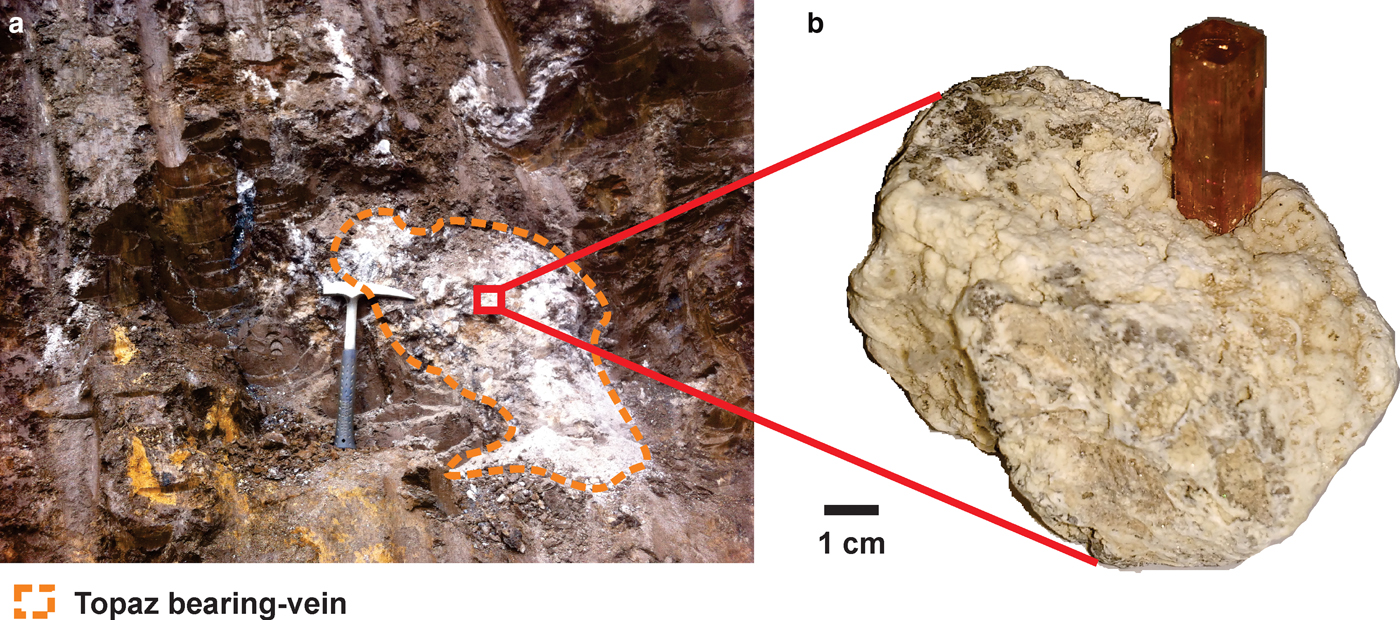
The Ouro Preto region is located in the Southeast of Minas Gerais state, Brazil, and is geologically related to the Quadrilátero Ferrífero District. The Quadrilátero Ferrífero (Iron Quadrangle) is a greenstone terrain, where rocks of predominantly Archaean and Proterozoic age outcrop in a dome-and-keel style (Alkmim and Marshak, Reference Alkmim and Marshak1998). The basement of the supracrustal unit consists of domes of gneissic-granitic-migmatite rocks that formed over a time-span ranging from 3200 to 2900 Ma (Machado and Carneiro, Reference Machado and Carneiro1992; Lana et al., Reference Lana, Alkmim, Armstrong, Scholz, Romano and Nalini2013). The supracrustal rocks are metavolcanic and metasedimentary units of the Supergroup Rio das Velhas and the Minas Supergroup (Machado et al., Reference Machado, Noce, Ladeira and Oliveira1992; Renger et al., Reference Renger, Noce, Romano and Machado1995; Noce et al., Reference Noce, Machado and Teixeira1998). The former is composed mainly of ultramafic-mafic metamorphosed rocks and by metasedimentary units including the Algoma-type Iron Formation and volcanic-clastic rocks. Overlying these Archaean rocks is the Minas Supergroup. The Minas Supergroup is composed of the Caraça, Itabira, Piracicaba and Sabará groups (Dorr II, Reference Dorr II1969; Alkmim and Marshak, Reference Alkmim and Marshak1998; Lana et al., Reference Lana, Alkmim, Armstrong, Scholz, Romano and Nalini2013). The base of this supergroup consists of metasedimentary rocks of clastic and chemical origin. Among them are thick layers of iron formation rocks as well as carbonate units (Renger et al., Reference Renger, Noce, Romano and Machado1995). On the top of this sequence is the Piracicaba Group, which consists typically of 2420 Ma metaquartzites, phyllites, metagraywackes, carbonate-bearing phyllites and dolomitic marbles (Dorr II, Reference Dorr II1969; Gandini, Reference Gandini1994; Babinski et al., Reference Babinski, Chemale and van Schumus1995). These Piracicaba Group rocks hosted the mineralization of imperial topaz which occurs mainly in the Ouro Preto region. The imperial topaz mineralization occurs as topaz-bearing veins which essentially crosscut the altered phyllites of the Piracicaba Group rocks and along the Northeastern area of the Dom Bosco Syncline hinge zone and is associated with the Brasiliano tectonothermal event at ~600 Ma (Dorr II, Reference Dorr II1969; Morteani et al. Reference Morteani, Bello, Gandini and Preinfalk2002). Due to the tropical weathering, the imperial topaz-bearing veins occur within a halo of strongly altered rock (Fig. 1) in the crosscut phyllites, which are intensively altered. This alteration produces a brownish clay-like material, locally designated by the miners as ‘borra de café’ or brown terrena (Olsen, Reference Olsen1971). Due to this very intense alteration, there is no reliable information about the primary country rock related to the imperial topaz mineralization. In addition, topaz-bearing veins are mineralogically composed of kaolinite, quartz, mica, rutile and, rarely, euclase (Gandini, Reference Gandini1994; Morteani et al., Reference Morteani, Bello, Gandini and Preinfalk2002).
Fig. 1. Intensively altered phyllites from the Piracicaba Group rocks, at Dom Bosco mine: (a) an imperial topaz-bearing vein crosscutting the brown terrena; (b) a vein containing a crystal of imperial topaz.
The imperial topaz occurs in hydrothermal veins, whose genesis is assigned to a mineralizing fluid that resulted from a metamorphic tectonothermal event, during the Brasiliano orogeny, at ~600 Ma (Morteani et al., Reference Morteani, Bello, Gandini and Preinfalk2002). In agreement with this study, the imperial topaz would have crystallized from P-T conditions of 3.50–5.00 kbar and 360 ± 7.00°C. The minimum value for pressure was obtained from the temperature of homogenization of CO2–H2O fluid inclusions (Gandini, Reference Gandini1994). The maximum value for pressure was estimated by Wunder et al. (Reference Wunder, Rubie, Ross II, Medenbach, Seifert and Schreyer1993, Reference Wunder, Andrut and Wirth1999), for high-pressure crystallization of OH-topaz. In the study carried out by Morteani et al. (Reference Morteani, Bello, Gandini and Preinfalk2002), the temperature was obtained by oxygen isotope thermometry for the quartz and hematite intergrowth with imperial topaz; the mentioned intergrowth is assumed to be related to equilibrium among the three mineral phases. Also in agreement with the aforementioned authors, the P-T conditions are within the stability field of pyrophyllite and kaolinite, which are both present as inclusions in imperial topaz.
Sample description and preparation
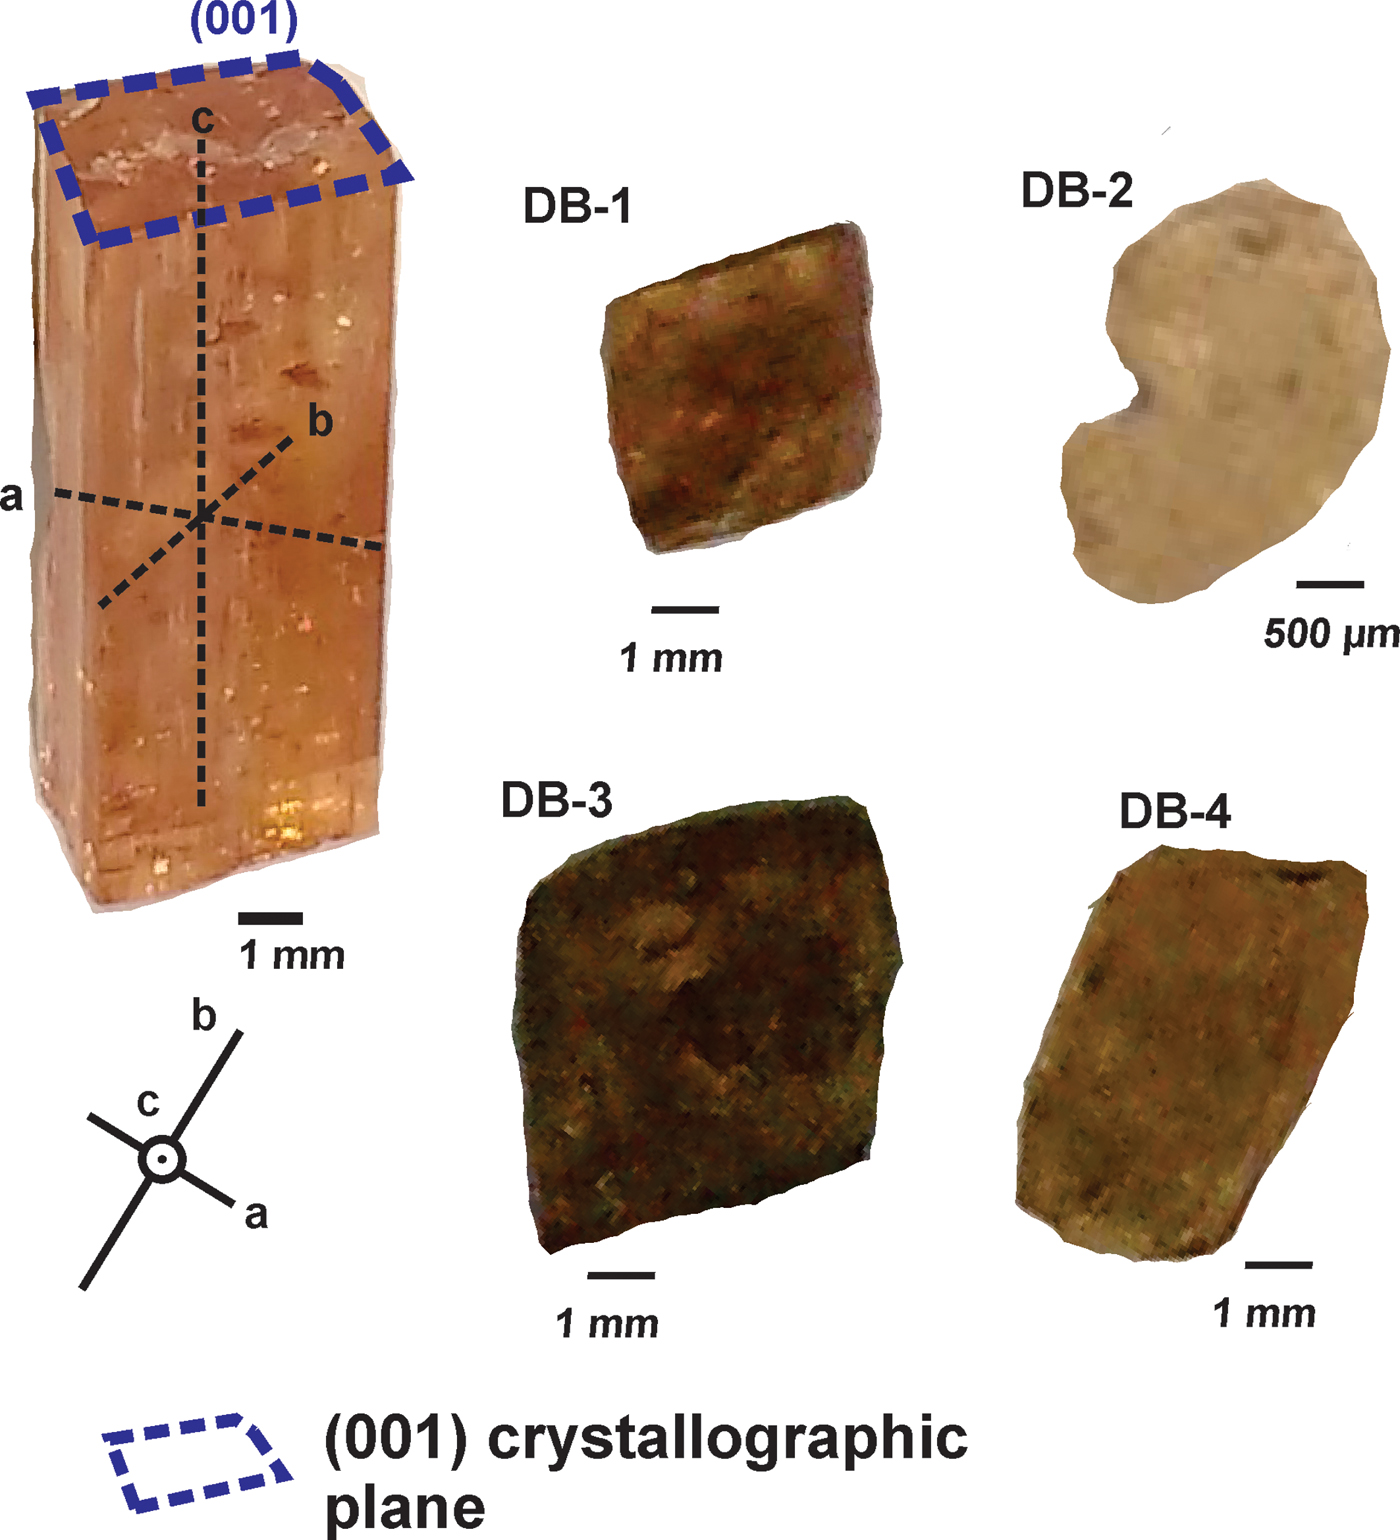
The samples are from the Dom Bosco mine, specifically from the Dom Bosco Syncline area, Ouro Preto region, and were named DB-1, DB-2, DB-3 and DB-4 (Fig. 2). The selected samples showed a prismatic habit, essentially euhedral, and with ‘striae’ along the well preserved lateral faces, parallel to the c axis, and were mainly free of inclusions. The colours and dimensions (width × height in mm) of the samples are: DB-1, orange-pinkish, 6.00 x 10.00; DB-2, yellowish, 2.50 x 4.00; DB-3, orange-pinkish, 11.50 x 15.00; DB-4, orangish, 6.00 x 12.00. All these samples were cut parallel to (001) and perpendicular to the c axis. After this procedure, the samples were mounted in an epoxy resin, then polished using a 0.25 µm diamond powder until the imperial topaz crystals had been exposed. The samples were cleaned with HNO3 before analysis in order to avoid contamination.
Fig. 2. Samples DB-1, DB-2, DB-3 and DB-4, cut parallel to (001). The image on the left hand side shows the orientation of crystallographic axes of euhedral topaz crystals.
Methods
Cathodoluminescence (CL)
Panchromatic SEM-CL images were obtained using a JEOL JSM-6510 equipped with a CL detector, with a wavelength range of 200–800 nm, in the Microanalysis Laboratory of the Department of Geology at the Federal University of Ouro Preto (Brazil). The accelerating voltage was 20 kV.
Colour optical microscope-cathodoluminescence (OM-CL) images were obtained using a CITL Mk2 consisting of a cooled charge-coupled device (CCD) camera, a cold cathode discharge tube and a vacuum chamber at the Technological Characterization Laboratory (SCT) of the Centre of Mineral Technology (CETEM), Rio de Janeiro (Brazil). It was operated at an accelerating voltage of 16 kV and beam current of 344 μA, under high vacuum conditions. A magnet was used to control the diameter of the electron beam spot at 3 µm size on the sample surface. This same equipment provided the CL spectral measurements for this study. This system contains an optical microscope model Zeiss Imager M2 m combined with a refractable parabolic mirror coated with aluminium (collecting efficiency of 75%). CL spectra in the wavelength range of 300–800 nm were recorded by a photon counting method using a photomultiplier tube and converted to digital data. Corrected CL spectra in energy units were deconvoluted into the Gaussian components corresponding to each emission centre. The standard deviation of the detector is 2.5%, fitting error of deconvolution is 5.00–10.00%.
Electron microprobe analyses
The major-element composition of imperial topaz crystals was determined by wavelength-dispersive spectroscopy (WDS), using a JEOL JXA-8230 SuperProbe 8500 at the Microanalysis Laboratory, Department of Geology in the Federal University of Ouro Preto (Brazil). The EMPA work was targeted to distinct luminescent areas identified by SEM-CL images. It used a beam current of 20 nA, an accelerating voltage of 15 kV and a spot size of 10 µm. A set of minerals were used as standards for their respective elements: augite (Si and Ca), gahnite (Al and Fe), fluorite (F), F-apatite (P) and Cr-augite (Cr). Elements were analysed for 10 to 30 s on-peak and off-peak. Relative analytical errors (1σ) of major elements are: below 1.00% for Si and for Al; and 3.00–6.00% for F.
Laser ablation inductively coupled plasma mass spectrometry (LA-ICP-MS)
Trace elements were analysed by (LA-ICP-MS) using a Thermo-Finnigan Element II, single collector sector field (SF) ICL1-MS, coupled to a CETAC UV Nd:YAG 213 nm laser with a Helix ablation cell at the Isotopic Geochemistry Laboratory (LOPAG), Department of Geology in the Federal University of Ouro Preto, Brazil. The spot size was 40 µm. Helium combined with argon was a carrier gas and ablation was carried out with a pulse rate of 10 Hz and an energy density of 3.60 J/cm2. The LA-ICP-MS analyses were targeted to distinct luminescence areas identified by SEM-CL images (Fig. 3), and 20 s of background acquisition was followed by 60 s of ablation. The software GLITTER 4.0 (Macquarie University) was used for data reduction with NIST SRM610 as the primary external standard and Si as the internal standard (using the average SiO2 content for each sample). The secondary external standard was NIST SRM612. Limits of detection (in ppm) were ~ 4.80–5.90 (Ti), 0.04–0.08 (V), 1.60–3.60 (Cr), 0.20–0.40 (Mn), 131.00–330.00 (Fe), 0.06–0.12 (Cu), 0.27–0.50 (Zn), 0.04–0.10 (Ga) and 0.43–0.73 (Ge), and the external reproducibility of results is 2 to 7%.
Raman spectroscopy
Non-destructive Raman analysis was carried out with a confocal laser Raman microscope Senterra Bruker and a cooled charge-coupled device (CCD) Peltier at the Laboratory of the Group of Environmental Technology (GRUTAM), Department of Chemistry in the Federal University of Minas Gerais (Brazil). The spectral range was 40–3700 cm–1. Raman spectra were collected using 50x Olympus BX51 objectives and a frequency doubled Nd:YAG (532) He-Ne ion 20 mW monochromatic, non-polarized laser source. Beam centring and Raman calibration were performed using a Si standard (111). The laser power was set at ~30 mW. The typical spectral resolution was 2.00 cm–1. All spectra were recorded at room temperature and with a light along the c axis of the imperial topaz samples, thus perpendicular to (001). Raman spectra were compared to the spectra from the RRUFF Database (Downs, Reference Downs2006) and the literature.
Results
Cathodoluminescence
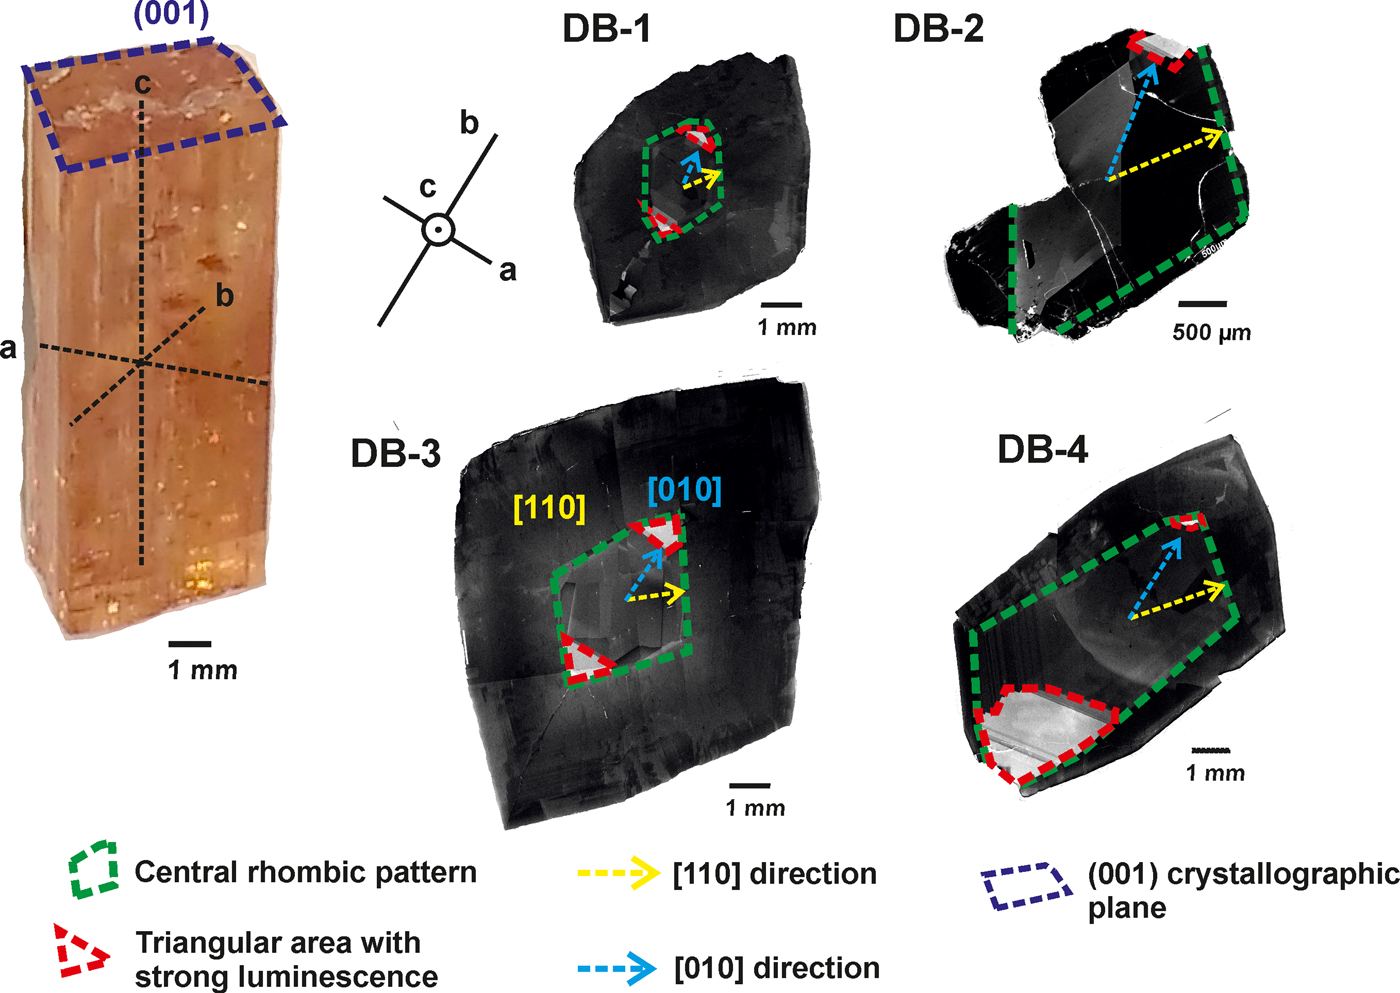
The crystals studied show different intensities of panchromatic CL, with marked brightness variations, and distinct zonation (Fig. 3). The CL-intensities, based on images obtained by SEM-CL, were divided into two categories: low and high.
Fig. 3. SEM-CL panchromatic images of imperial topaz crystals with the following features: central rhombic pattern (green); [110] direction (yellow); triangular high luminescence area (red); and [010] direction (blue).
The CL-panchromatic images of all samples reveal, in the crystal cores, prominent CL-zoning growth boundaries (cf. Isogami and Sunagawa, Reference Isogami and Sunagawa1975; Akizuki et al., Reference Akizuki, Hampar and Zussman1979), specifically a central rhombic pattern. In samples DB-1 and DB-3 this central rhombic pattern can be easily observed and develops along [110]. In samples DB-2 and DB-4, the central rhombic pattern shows some elongation along [010]. In the apices of all central rhombic patterns, especially along [010], there is a common tendency to form a triangular area of very strong luminescence. In the crystal rims, it is possible to observe very dark luminescence areas, in all the samples (Fig. 3).
The OM-CL images of imperial topaz crystals displayed a low intensity blue to violet colour, which is well exemplified by the OM-CL image obtained for the sample DB-4. Due to its more evident marked luminescence area, noticed in SEM-CL images, sample DB-4 showed that the intensity variations of OM-CL and SEM-CL images do not match. The CL spectra showed a broad emission band peak with low intensity at ~417 nm (violet-blue region of the electromagnetic spectrum), and a broad emission band with high intensity and major peaks at 685, 698, 711 and 733 nm (red region of the electromagnetic spectrum; Fig. 4).
Fig. 4. Comparison of SEM-CL and OM-CL images of sample DB-4 and a CL spectrum of the same sample.
EMPA results
All samples show compositional homogeneity, with the following compositional ranges: F = 11.66–13.59 wt.%, SiO2 = 31.41–32.37 wt.% and Al2O3 = 55.00–56.43 wt.% (Table 1). The ranges of Cr2O3, P2O5 and CaO are 0.01–0.15 wt.%, 0.01–0.05 wt.% and 0.01–0.05 wt.%, respectively. The high luminescence areas in panchromatic CL-images are slightly richer in F (average of 12.88 wt.%) compared to the low luminescence ones (average of 12.51 wt.%). The OH/(OH + F) ratio ranges from 0.35–0.43 (0.72 ≤ OH ≤ 0.86 apfu). Recalculation on the basis of two Al atoms indicate a slight enrichment in F (1.18–1.32 apfu) and a lower OH/(OH + F) ratio (0.35–0.41) in high luminescence areas.
Table 1. Representative compositions (EMPA) of imperial topaz crystals (wt.%).
(H) – high luminescence; (L) – low luminescence; n.d. – not detected.
LA-ICP-MS results
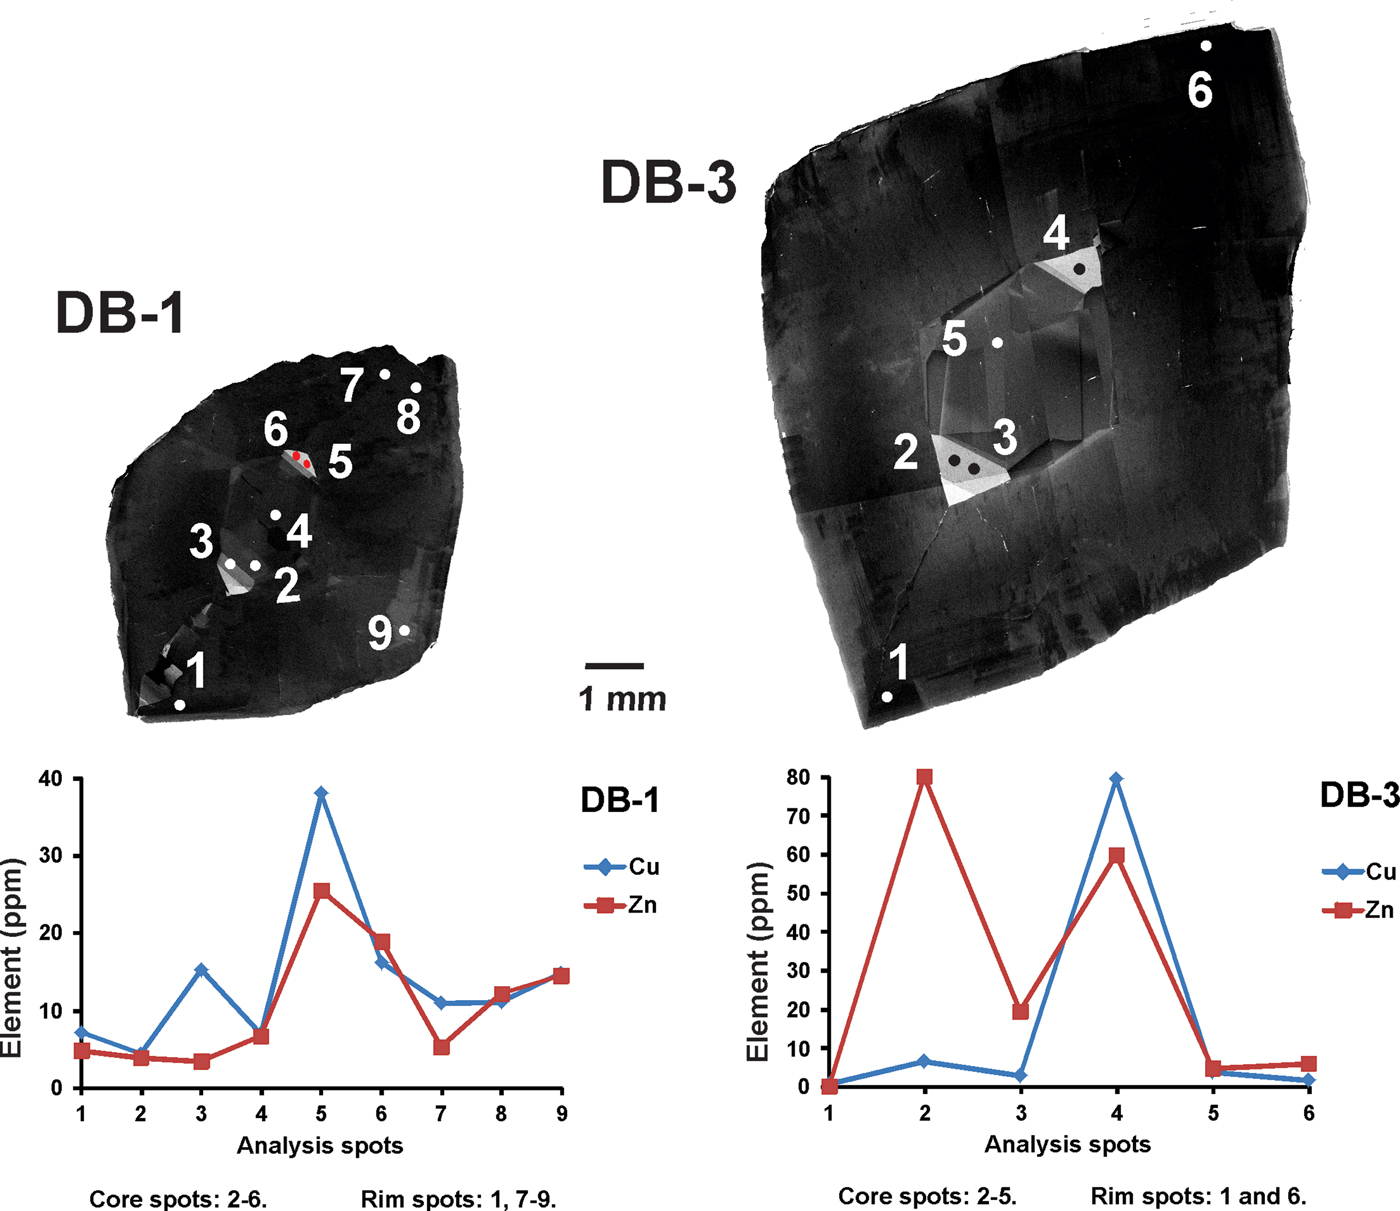
Some variations in the trace elements within crystals can be observed (Table 2). In all samples, Ti, V, Cr, Mn, Fe, Cu, Zn, Ga and Ge have been detected. Titanium and Cr are abundant with compositional ranges of 21.10–643.82 ppm and 21.52–887.82 ppm, respectively. Iron contents can reach thousands of ppm (352.62–1730.69 ppm), whereas other elements such as V (4.86–136.76 ppm), Mn (1.25–15.07 ppm), Cu (0.50–79.46 ppm) and Zn (2.49–79.98 ppm) are mostly of the order of a few to tens of ppm. Gallium ranges from sub-ppm to tens of ppm (0.69–20.66 ppm), but is mostly of the order of a few ppm (average 3.03 ppm). Germanium concentrations can range from a few ppm to tens of ppm (7.65–65.89 ppm), but are mostly at tens of ppm (average 29.45 ppm). Apart from the overall distribution of all these elements in the imperial topaz grains, compositions differ between the core and the rim. Titanium for instance, is slightly richer in the core (average 215.74 ppm) than the rim (average 161.92 ppm). Other elements show a similar pattern in their average concentrations: V (core 28.71 ppm / rim 23.70 ppm); Cr (core 319.42 ppm / rim 300.87 ppm); Mn (core 5.09 ppm / rim 3.65 ppm); Fe (core 799.07 ppm / rim 691.73 ppm); Cu (core 13.73 ppm / rim 10.35 ppm); Zn (core 19.75 ppm / rim 11.33 ppm); and Ge (core 35.44 ppm / rim 24.37 ppm). Gallium is richer in the rim (4.04 ppm) than in the core (1.93 ppm). Moreover, when the distribution of these elements in the core and rims are compared with luminescence characteristics, there is a correspondence with some of the elements analysed. Taking the most common ones such as Cu and Zn, which are considered as activator elements, both are considerably richer in the high luminescence core than in the rim: Cu (core 26.07 ppm / rim 6.05 ppm), Zn (core 33.91 ppm / rim 7.98 ppm) (Fig. 5).
Fig. 5. SEM-CL images and their relation with Cu and Zn concentrations. Those domains with higher CL intensity are associated with higher Cu and Zn concentrations.
Table 2. LA-ICP-MS data for imperial topaz crystals in high (HL) and low luminescence (LL) areas (ppm).
b.d.l. – below detection limit; HL – high luminescence; LL – low luminescence
Raman spectroscopy
In all the samples, Raman spectra were obtained in the range between 40–1600 nm. Raman spectra showed major peaks at 243, 272, 291 and 916 cm–1. Secondary peaks of lower intensities were also detected at 336, 364, 405, 463, 519, 554, 642, 841 and 1160 cm–1 (Fig. 6). These peaks have the following assignments: symmetric Si–O ring deformation (243 cm–1; Skvortsova et al., Reference Skvortsova, Mironova-Ulmane, Trinkler and Chikvaidze2013); various vibrational modes of [SiO4]-tetrahedra (at 272, 291, 554, 841 and 916 cm–1; Beny and Piriou, Reference Beny and Piriou1987; Downs, Reference Downs2006; Skvortsova et al., Reference Skvortsova, Mironova-Ulmane, Trinkler and Chikvaidze2013); stretching and bending modes of [AlO6]-octahedra coupled with the bending modes of [SiO4]-tetrahedra (at 364, 405 and 463 cm–1; Beny and Piriou, Reference Beny and Piriou1987; Skvortsova et al., Reference Skvortsova, Mironova-Ulmane, Trinkler and Chikvaidze2013); stretching modes of Al–F (at 336 cm–1; Agangi et al. Reference Agangi, Gucsik, Nishido, Ninagawa and Kamenetsky2016); in-plane bending OH-groups (at 1160 cm–1; Prasad and Gowd, Reference Prasad and Gowd2003). Even after being observed in other studies, such as Skvortsova et al. (Reference Skvortsova, Mironova-Ulmane, Trinkler and Chikvaidze2013) and Agangi et al. (Reference Agangi, Gucsik, Nishido, Ninagawa and Kamenetsky2016), the interpretation of peaks at 519 and 642 cm–1 remains unclear. In our study, there was not a clear relation between the CL-bright zones and the Raman spectra.
Fig. 6. Representative Raman spectrum of all imperial topaz crystals, ranging between 40–1600 nm. This spectrum was acquired in a section perpendicular to the c axis. The peak assignments: ‘a’ symmetric Si–O ring deformation; ‘b’ vibrational modes of [SiO4] tetrahedra; ‘c’ stretching modes of [AlO6] octahedra; ‘d’ stretching modes of Al–F; ‘e’ in-plane bending OH-groups; ‘u’ non assigned peaks (Beny and Piriou, Reference Beny and Piriou1987; Downs, Reference Downs2006; Skvortsova et al., Reference Skvortsova, Mironova-Ulmane, Trinkler and Chikvaidze2013; Agangi et al., Reference Agangi, Gucsik, Nishido, Ninagawa and Kamenetsky2016).
Discussion
Compositional properties
According to Morteani et al. (Reference Morteani, Bello, Gandini and Preinfalk2002), imperial topaz from Ouro Preto is assumed to be of hydrothermal origin and formed during the tectonothermal events related the Braziliano orogeny (600 Ma). The imperial topaz has a OH/(OH + F) ratio of 0.35–0.43 (0.72 ≤ OH ≤ 0.86 apfu), making it similar to topaz crystals from hydrothermal deposits (OH/(OH + F) > 0.3; Barton, Reference Barton1982), and metamorphic contexts such as Sulu terrane in Eastern China (0.35 ≤ OH/(OH + F) ≤ 0.55; Zhang et al., Reference Zhang, Liou and Shu2002). By contrast, topaz crystals of magmatic origin have a very low OH/(OH + F) ratio. For example, those from S- and A-type granites from the Krušné Hory/Erzgebirge area in Czech Republic/Germany, have a OH/(OH + F) of ~ 0.05 (Breiter et al., Reference Breiter, Gardenová, Vaculovič and Kanický2013). Topaz from F-rich ongonites of the Ary-Bulak massif, Russia, have a OH/(OH + F) of ≤ 0.09 (Agangi et al., Reference Agangi, Kamenetsky, Hofmann, Przybyłowicz and Vladykin2014, Reference Agangi, Gucsik, Nishido, Ninagawa and Kamenetsky2016).
The concentrations of trace elements (Ti, V, Cr, Mn, Fe, Cu, Zn, Ga and Ge) in the imperial topaz crystals studied are here compared with topaz crystals described previously in order to establish the possible fingerprint (Table 3). The comparators are: topaz-bearing rhyolites from San Luis de Potosí, Mexico (Leroy et al., Reference Leroy, Rodríguez-Rios and Dewonck2002); a topaz- and amazonite-bearing leucogranite pluton from Xinjiang, China (Wu et al., Reference Wu, Liu, Gu, Zhang and Lei2011); S- and A-type granites and greisens from Krušné Hory/Erzgebirge area, Czech Republic/Germany (Breiter et al., Reference Breiter, Gardenová, Vaculovič and Kanický2013); and F-rich ongonites from Ary-Bulak massif, Russia (Agangi et al., Reference Agangi, Kamenetsky, Hofmann, Przybyłowicz and Vladykin2014, Reference Agangi, Gucsik, Nishido, Ninagawa and Kamenetsky2016).
Table 3. Comparison between the trace-element composition of imperial topaz and topaz crystals from different geological environments (ppm).
* Average calculated content; n.a. – not analysed; bdl – below detection limit.
The concentrations of Ti, V, Cr, Fe, Cu and Zn in imperial topaz are higher than for topaz crystals from different geological environments (Leroy et al., Reference Leroy, Rodríguez-Rios and Dewonck2002; Wu et al., Reference Wu, Liu, Gu, Zhang and Lei2011; Wasim et al., Reference Wasim, Zafar, Tufail, Arif, Daud and Ahmad2011; Breiter et al., Reference Breiter, Gardenová, Vaculovič and Kanický2013; Agangi et al., Reference Agangi, Kamenetsky, Hofmann, Przybyłowicz and Vladykin2014, Reference Agangi, Gucsik, Nishido, Ninagawa and Kamenetsky2016). In contrast the contents of Mn, Ga and Ge in imperial topaz are lower than for other topaz crystals described previously. The Ge concentrations in the topaz crystals of S-type granite (Breiter et al., Reference Breiter, Gardenová, Vaculovič and Kanický2013) and in the imperial topaz crystals of this study are mostly at tens of ppm. Notwithstanding, the average concentration of this element is more than two times greater in the S-type granites topaz (average concentration 70.52 ppm) than in the imperial topaz (average concentration 30.67 ppm).
Trace-element substitutions in the crystal structure of imperial topaz
The replacement of tetrahedral Si4+ by tetrahedral Ge4+ was demonstrated by Breiter et al. (Reference Breiter, Gardenová, Vaculovič and Kanický2013) and Ge concentrations obtained in the present study were below 65.89 ppm. Ge4+ has the same charge and a similar ionic radius (Ge4+ 0.39 Å; Si4+ 0.26 Å; Shannon, Reference Shannon1976) as the replaced Si4+. Additionally, the crystallochemical similarity between the tetrahedral Ge4+ and Si4+ in a similar topaz structure was described in a study of krieselite [Al2GeO4(F,OH)2], a Ge-analogue of topaz (Schlüter et al., Reference Schlüter, Geisler, Pohl and Stephan2010). Moreover, tetrahedral Ge4+ tends to prefer least-linked tetrahedral structures (Harris, Reference Harris1954) and preferentially substitute tetrahedral Si4+ in nesosilicates (Johan et al., Reference Johan, Oudin and Picot1983).
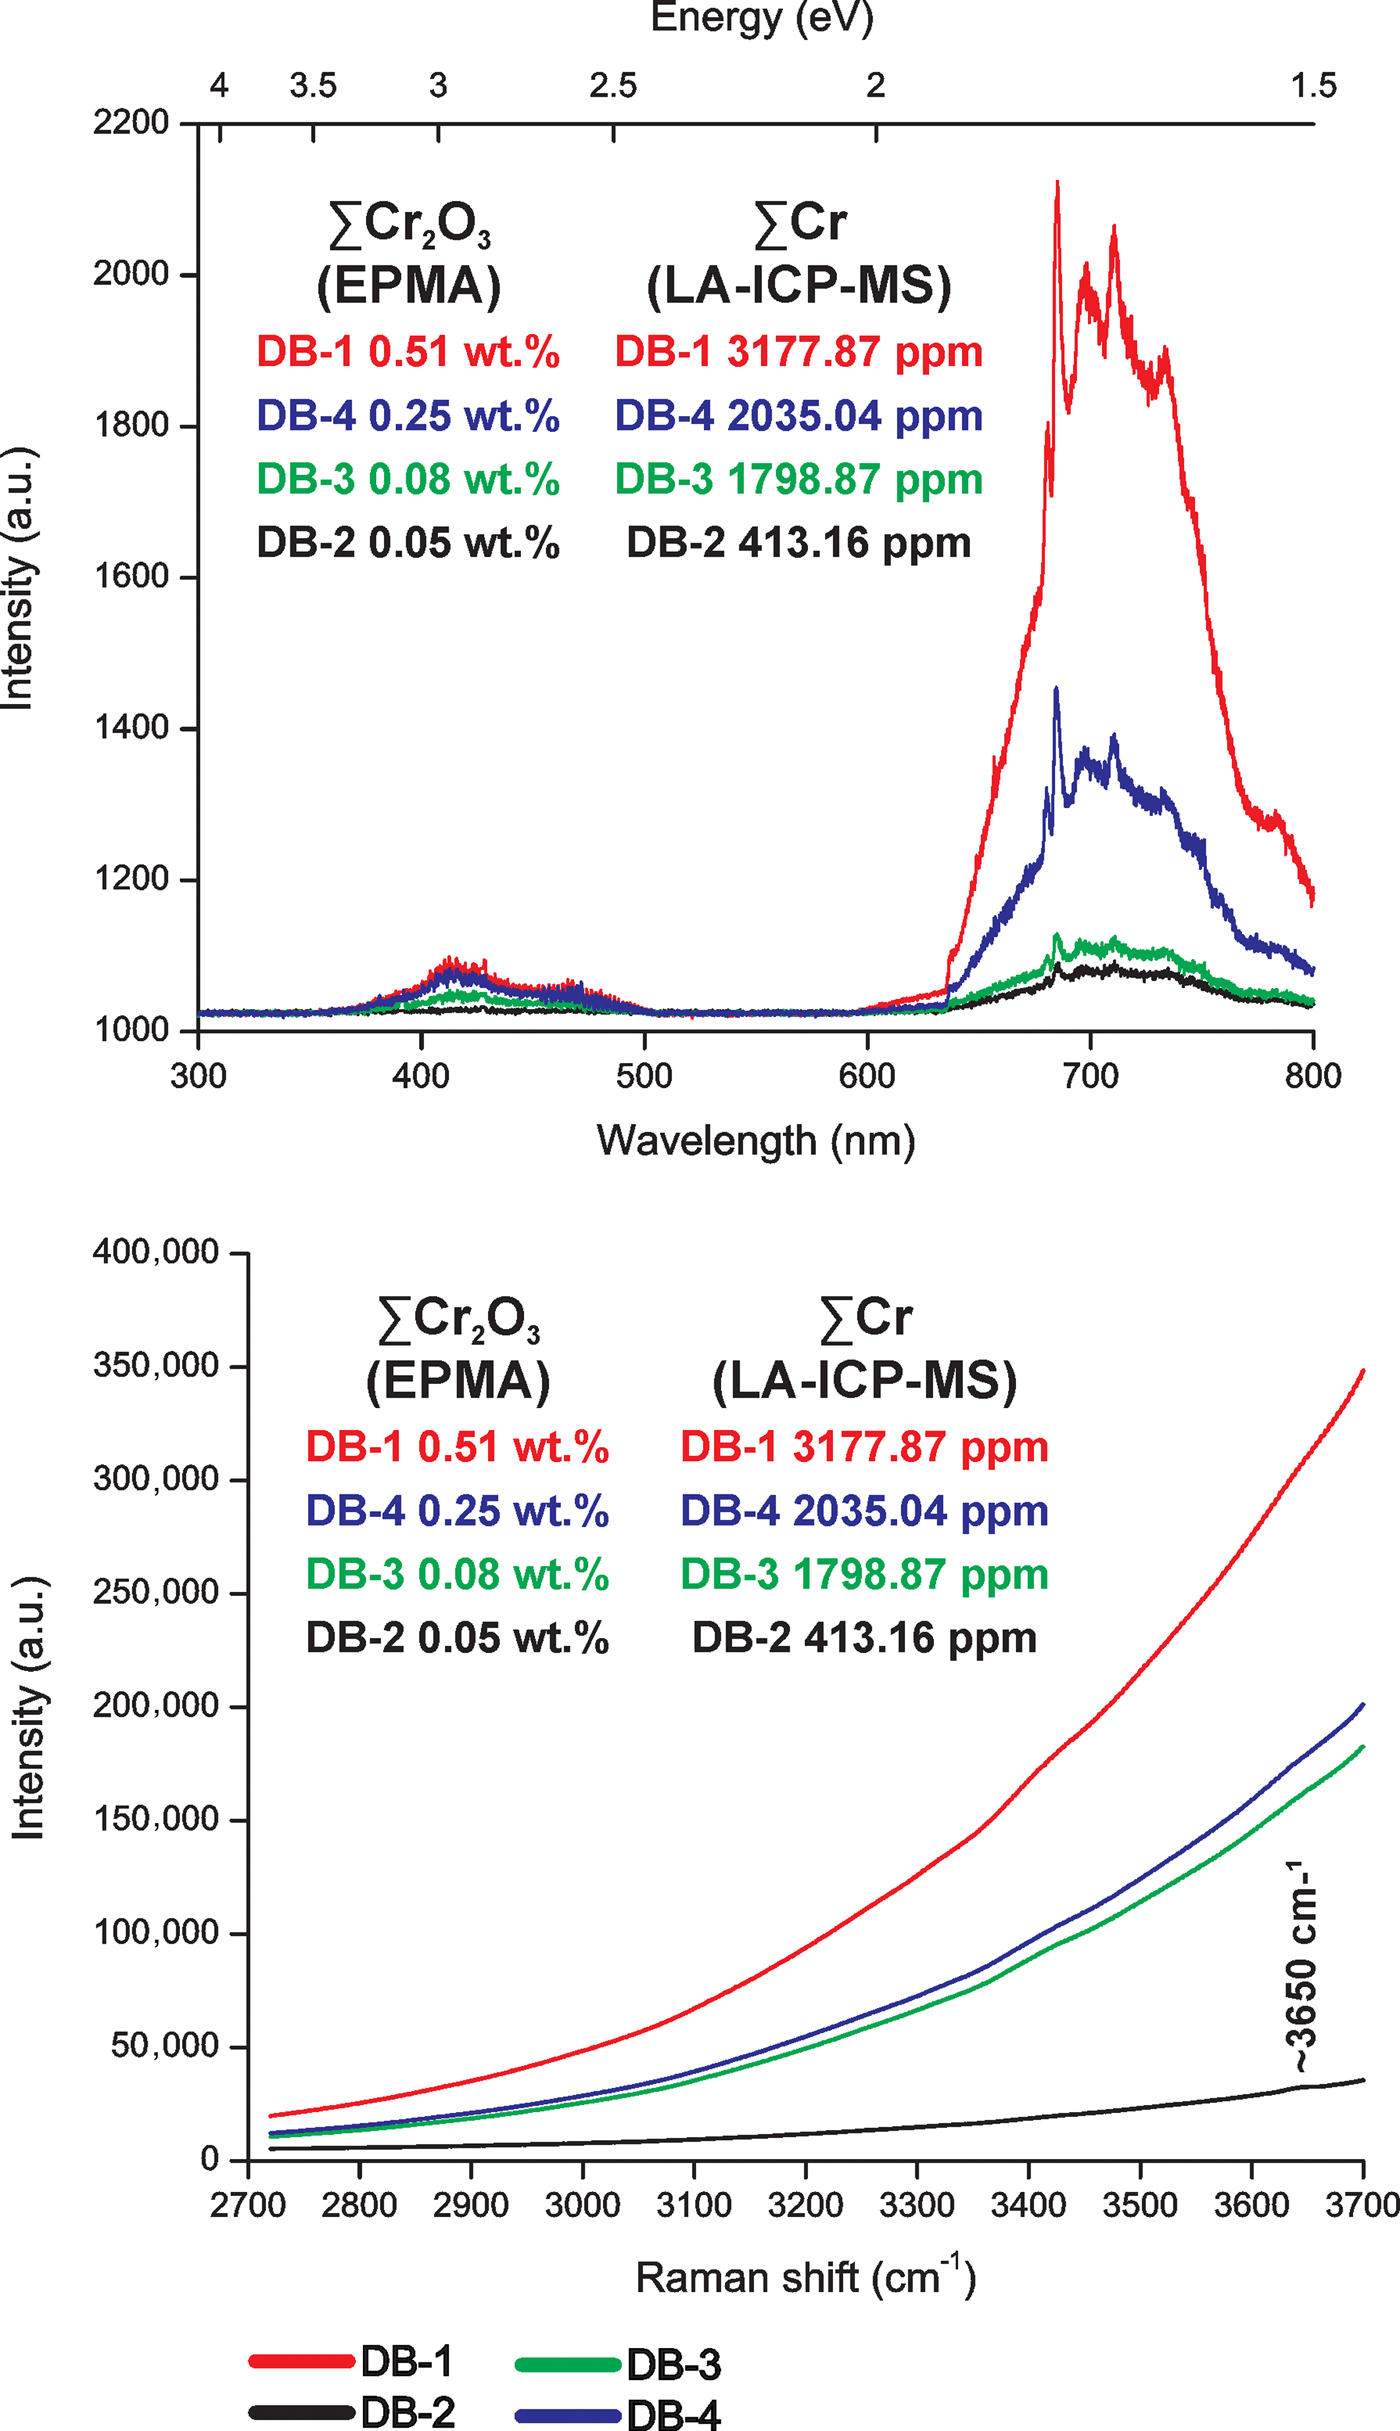
Octahedral Ti3+, Cr3+, Mn3+, Fe3+ (Schott et al., Reference Schott, Rager, Schürmann and Taran2003) and Ga3+ (Breiter et al., Reference Breiter, Gardenová, Vaculovič and Kanický2013; Agangi et al., Reference Agangi, Kamenetsky, Hofmann, Przybyłowicz and Vladykin2014, Reference Agangi, Gucsik, Nishido, Ninagawa and Kamenetsky2016) have substituted for octahedral Al3+. The Al3+ has the same ionic charge and similar ionic radius (Al3+ 0.54 Å) to the other octahedral trivalent ions: Ti3+ (0.67 Å), Cr3+ (0.62 Å), Mn3+ (0.58 Å), Fe3+ (0.55 Å) and Ga3+ (0.62 Å). The valence states of Ti3+, Cr3+, Mn3+ and Fe3+ in imperial topaz were confirmed by EPR (Schott et al. (Reference Schott, Rager, Schürmann and Taran2003). In agreement with the studies carried out by Thyer et al. (Reference Thyer, Quick and Holuj1967), Holuj and Quick (Reference Holuj and Quick1968) and Schott et al. (Reference Schott, Rager, Schürmann and Taran2003), all based on EPR results, Fe3+ substitutes for Al3+ in the crystal structure of topaz. The replacement of Al3+ by Ga3+ was described by Northrup and Reeder (Reference Northrup and Reeder1994) and Breiter et al. (Reference Breiter, Gardenová, Vaculovič and Kanický2013). Moreover, it is important to highlight the influence of Cr as an important trace element in imperial topaz. The EPR studies of Schott et al. (Reference Schott, Rager, Schürmann and Taran2003) and Tarashchan et al. (Reference Tarashchan, Taran, Rager and Iwanuch2006) found that Cr3+ tends to substitute for Al3+. In natural topaz crystals their luminescence is due to Cr3+ and to Cr3+-Cr3+ pairs, as well as to radiation-induced centres associated with Cr (Gaft et al., Reference Gaft, Nagli, Reisfeld, Panczer and Brestel2003). In agreement with Tarashchan et al. (Reference Tarashchan, Taran, Rager and Iwanuch2006), octahedral Cr3+ is responsible for intense colours and bright luminescence in imperial topaz. Specifically, those imperial topaz crystals with high Cr2O3 and Cr contents, obtained by EMPA and LA-ICP-MS, respectively, have stronger intensities of CL emission and the high Cr3+-band emissions on Raman spectra (Fig. 7). After the excitation caused by the green Raman laser beam (532 nm), a broad red luminescence band (between 3500–3700 cm–1) can be observed (Pinheiro et al., Reference Pinheiro, Fantini, Krambrock, Persiano, Dantas and Pimenta2002). In agreement with these authors, this band is related to crystal-field transitions of Cr3+ substituting for Al3+. Also, the high concentrations of Cr in the imperial topaz crystals caused strong luminescence intensities superimposed on the ~3650 cm–1 peak related to the OH-stretching modes (Beny and Piriou, Reference Beny and Piriou1987; Fig. 6). Only in the Raman spectrum of the sample DB-2, with the lower Cr concentrations, can an incipient peak be seen at ~3650 cm–1 (Fig. 7).
Fig. 7. A comparison between CL and Raman spectroscopy results of imperial topaz crystals, according to their ∑Cr2O3 and ∑Cr concentrations obtained by EMPA and LA-ICP-MS, respectively.
Substitution of major elements by elements of different ionic charge also occurs in imperial topaz. Octahedral V4+ (Schott et al., Reference Schott, Rager, Schürmann and Taran2003), Ti4+ (Northrup and Reeder, Reference Northrup and Reeder1994; Schott et al., Reference Schott, Rager, Schürmann and Taran2003), Cu2+ and Zn2+ can substitute for octahedral Al3+. Schott et al. (Reference Schott, Rager, Schürmann and Taran2003) revealed that OH groups show a higher tendency for polarization than F ions and, hence, two F ligands increase the ionic character of the V4+ ligand. The octahedral coordinated V4+ is more likely to be detected by EPR at room temperature than tetrahedral coordinated V4+, which occurs at temperatures below –213.15°C (Schott et al., Reference Schott, Rager, Schürmann and Taran2003). Due to its large dimension, octahedral Ti4+ is more likely to substitute for Al3+ than tetrahedral Si4+; in addition in topaz, this substitution can also happen with charge compensation by O2– for F– (Northrup and Reeder Reference Northrup and Reeder1994). Ti4+ and V4+ can also enter into the crystal structure of topaz because of their high ionic potential (6.61 and 6.90, respectively; Shannon, Reference Shannon1976), when compared to ionic potential of Al3+ (5.61). The replacement of octahedral Al3+ for octahedral Mn2+, Cu2+ and Zn2+ can occur, because these ions present low ionic potentials (2.41, 2.74 and 2.70, respectively). This substitution occurs due to the low charge of Cu2+ and Zn2+ or to the large ionic radii (0.73 Å and 0.74 Å, respectively), or even both. Zn2+ can be introduced into the imperial topaz crystal structure because of its tendency to form a relatively higher proportion of ionic bonds with OH– ligands (Albarède, Reference Albarède, Johnson, Beard and Albarede2004), which are part of the crystal structure of topaz. According to Misra (Reference Misra2012), octahedral Cu2+ is taken up by the minerals that crystallize during the late stage of a rock crystallization process. Topaz is related to late stages of crystallization, which can allow the incorporation of small quantities of Cu2+ in its crystal structure.
Cathodoluminescence properties
The luminescence of an ion will depend on the interactions with other constituents of the crystal structure, the crystallographic site of the elements considered and on the crystal field. When the crystal field is strong, the luminescence emission will show broad emission bands (Götze, Reference Götze, Pagel, Barbin, Blanc and Ohnenstetter2000, Reference Götze2012). According to Stevens-Kalceff (Reference Stevens-Kalceff2009), the incorporation of transition metals (Ti, V, Cr) in topaz results in broader luminescence peaks, which is consistent with the obtained peaks at 685, 698, 711 and 733 nm (Fig. 3). In agreement with Gaft et al. (Reference Gaft, Nagli, Reisfeld, Panczer and Brestel2003, Reference Gaft, Reisfeld and Panczer2005), these peaks are related to a transition metal, especially Cr3+. The broad emission band with low intensity peak at ~417 nm can be interpreted as point defects, due to intrinsic luminescence centres. In our case, this broad featureless part of the CL spectra can be related to point defect centres such as vacancies or interstitial clusters.
Images of quartz and topaz using SEM-CL have been crucial for understanding the crystallization dynamics of these minerals and their geological setting (e.g. hydrothermal, metamorphic environment; Boggs et al. Reference Boggs, Kwon, Goles, Rusk, Krinsley and Seyedolali2002; Van den Kerkhof et al. Reference Van der Kerkhof, Kronz, Simon and Scherer2004; Rusk et al. Reference Rusk, Lowers and Reed2008; Götte et al., Reference Götte, Pettke, Ramseyer, Koch-Müller and Mullis2011; Agangi et al. Reference Agangi, Kamenetsky, Hofmann, Przybyłowicz and Vladykin2014; Frelinger et al. Reference Frelinger, Ledvina, Kyle and Zhao2015; Agangi et al. Reference Agangi, Gucsik, Nishido, Ninagawa and Kamenetsky2016). The central rhombic pattern, observed in the CL-panchromatic images of the cores of all samples, shows that this area was marked by multiple precipitation-dissolution events, which are representative of physicochemical changes within the hydrothermal system. In the rims are very dark luminescence areas, which are truncated by some irregular-shaped areas. These textures can be related to metamorphic activity, shown by lower CL along the rims of the grain, which can imply recrystallization and some removal of impurities thus producing a homogeneous CL response. Moreover, the growth speed, combined with the configuration of cation sites and the incorporation of trace elements, could produce sectoral differences (Gatta et al., Reference Gatta, Nestola, Bromiley and Loose2006). In addition, all these crystallization features, showed by the CL-panchromatic images, suggest a primary process of crystallization followed by a process of recrystallization.
Finally, it is also noticeable that high concentrations of Cu and Zn can suggest a CL-activator role in imperial topaz. The role of the high concentrations of Cu and Zn, namely as octahedral Cu2+ and Zn2+, as CL-activators can be explained by Fig. 6. Also, replacement of octahedral Al3+ by octahedral Cu2+ and Zn2+, due to the differences between ionic charge and radii, may have strongly influenced the local electronic framework of the crystal structure and, consequently, affected the luminescence emissions.
Conclusions
The textures and compositional zoning of imperial topaz provide important information about its evolution. The SEM-CL images show intracrystalline luminescence variations and different CL-textures that indicate a primary process of crystallization followed by a process of recrystallization. This process can also be related to the metamorphic tectonothermal event that occurred during the Brasiliano orogeny in the region of Ouro Preto, at ~600 Ma (Morteani et al., Reference Morteani, Bello, Gandini and Preinfalk2002). Colour CL images indicate only blue to violet emissions. The CL-spectra indicate a broad emission band with low intensity peak at ~417 nm, and a broad emission band with high intensity and major peaks at 685, 698, 711 and 733 nm. It is likely that the substitution of trace elements in the structure of imperial topaz caused point defect centres as a lattice distortion; which produced the peak at ~417 nm. This hypothesis can be supported by the high concentrations of Cu and Zn in the areas of high luminescence intensity. Moreover, Raman and CL-spectra indicate high Cr concentrations, corroborated by EMPA and LA-ICP-MS results. The high Cr caused strong luminescence intensities that generated a superimposition over the ~3650 cm–1 peak, related to the OH-stretching mode of topaz in all Raman spectra.
Finally, our results show the chemical fingerprint of imperial topaz is high concentrations of Ti and Cr (tens to hundreds of ppm), V, Cu and Zn (few to tens of ppm), and Fe (tens to hundreds of ppm), and low concentrations of Mn (mostly few ppm), Ga (sub-ppm to few ppm) and Ge (mostly tens of ppm, average of 30.67 ppm).
Acknowledgements
Mr Edmar Silva, Mr André Silva and Mr Hélio Bezerra are thanked for providing sample material for our study. Mr. Marco Silva is thanked for the preparation of the samples. Prof. Dr Cristiano Lana (Federal University of Ouro Preto) and MSc Fernando Vasques (CETEM) are thanked for analytical assistance on the LA-ICP-MS and CL-spectroscopy, respectively. This project acknowledges support from the Isotopic Geochemistry Laboratory of the Federal University of Ouro Preto (APQ03943). Microanalysis Laboratory of the Federal University of Ouro Preto, a member of the Microscopy and Microanalysis Network of Minas Gerais State/Brazil/FAPEMIG, is thanked for the mineral chemistry analyses. The authors are specially thanked to Prof Dr Jens Götze (TU Bergakademie Freiberg, Germany), Prof Dr Ricardo Scholz (Federal University of Ouro Preto) and MSc Francesco Narduzzi (Federal University of Ouro Preto) for very helpful comments and literature suggestions to this manuscript. MSc Hugo Moreira (University of Portsmouth) is thanked for helpful discussions and for the photos taken in the Dom Bosco mine.