INTRODUCTION
The recovery of species diversity in secondary forests following disturbance is a topic of great interest, particularly in tropical seasonally dry forests (TDF) which are among the most threatened forest types worldwide (Portillo-Quintero & Sánchez-Azofeifa Reference PORTILLO-QUINTERO and SÁNCHEZ-AZOFEIFA2010). However, there is still much controversy regarding regional and temporal variation in plant and insect species diversity along successional habitat gradients.
The onset of tropical succession following swidden agriculture is often characterized by low forest complexity, biomass and species diversity for woody plants, all of which increase asymptotically with forest age (Chazdon Reference CHAZDON, Carson and Schnitzer2008, Hernández-Stefanoni et al. Reference HERNÁNDEZ-STEFANONI, DUPUY, TUN-DZUL and MAY-PAT2011, Kalacska et al. Reference KALACSKA, SANCHEZ-AZOFEIFA, CALVO-ALVARADO, RIVARD and QUESADA2005, Lebrija-Trejos et al. Reference LEBRIJA-TREJOS, BONGERS, PÉREZ-GARCÍA and MEAVE2008, Madeira et al. Reference MADEIRA, ESPÍRITO-SANTO, ANGELO-NETO, NUNES, SANCHEZ-AZOFEIFA and QUESADA2009, Molina-Colón & Lugo Reference MOLINA-COLÓN and LUGO2006, Ruiz et al. Reference RUIZ, FANDIÑO and CHAZDON2005). Importantly, it has been suggested that dry forest is structurally less complex and presents fewer seral successional stages than humid tropical forest, and therefore experiences faster post-disturbance recovery (Chazdon et al. Reference CHAZDON, LETCHER, VAN BREUGEL, MARTÍNEZ-RAMOS, BONGERS and FINEGAN2007, Lebrija-Trejos et al. Reference LEBRIJA-TREJOS, BONGERS, PÉREZ-GARCÍA and MEAVE2008). Also, tropical plant species diversity is often negatively associated with decreasing rainfall regimes across broad spatial scales (Clinebell et al. Reference CLINEBELL, PHILLIPS, GENTRY, STARK and ZUURING1995, Gentry Reference GENTRY, Bullock, Mooney and Medina1995, Givnish Reference GIVNISH1999, O'Brien et al. Reference O'BRIEN, FIELD and WHITTAKER2000), suggesting that the sequential replenishment of species in abandoned fields may also be faster in drier compared with more humid forest types.
Species diversity of tropical Lepidoptera is presumably strongly associated to floristic diversity, due to relatively high host specialization of caterpillars (Koh et al. Reference KOH, SODHI and BROOK2004, Novotny et al. Reference NOVOTNÝ, MILLER, LEPŠ, BASSET, BITO, JANDA, HULCR, DAMAS and WEIBLEN2004). Along habitat gradients, however, diversity patterns of Lepidoptera differ with those of woody plants while diversity patterns of understorey plants may be more similar (Kessler et al. Reference KESSLER, ABRAHAMCZYK, SOS, BUCHORI, PUTRA, GRADSTEIN, HÖHN, KLUGE, OREND, PITOPANG, SALEH, SCHULZE, SPORN, STEFFAN-DEWENTER, TJITROSOEDIRDJO and TSCHARNTKE2009). This may be caused by small-scale disturbances and subsequent spatial variation in niches and resources that maintain high α- and β-diversity of insect and other growth forms than trees (Floren et al. Reference FLOREN, BIUN and LINSENMAIR2002, Tscharntke et al. Reference TSCHARNTKE, SEKERCIOGLU, DIETSCH, SODHI, HOEHN and TYLIANAKIS2007). Besides environmental heterogeneity, seasonal cues such as precipitation and photoperiod as well as the seasonal availability of plant parts strongly influence herbivore insect diversity (Coley Reference COLEY1998, van Schaik et al. Reference VAN SCHAIK, TERBORGH and WRIGHT1993, Wolda Reference WOLDA1988). Unfortunately, most tropical insect diversity assessments disregard the fact that seasonality can produce high temporal variation in relative species abundances among habitats with different disturbance history (but see Hamer et al. Reference HAMER, HILL, MUSTAFFA, BENEDICK, SHERRATT, CHEY and MARYATI2005, Tylianakis et al. Reference TYLIANAKIS, KLEIN and TSCHARNTKE2005) and adjacent forest types (Welling Reference WELLING1973).
This study builds on previous work (Essens et al. Reference ESSENS, LEYEQUIEN and POZO2010) in the Yucatan Peninsula, indicating high woody plant species diversity in the intermediate compared with the dry and more humid seasonally dry old-growth forest types; additionally, patterns of local plant and caterpillar species diversity over forest succession differed among forest types (Essens et al. Reference ESSENS, LEYEQUIEN and POZO2010). In this paper, we use more comprehensive and revised plant and caterpillar species data, as well as complementary diversity measures and statistical procedures to test the hypotheses that the differences in plant species diversity gradually increase from young to old-growth forests and that the differences in species diversity among forest habitats gradually increase from dry to humid forest types. We additionally hypothesize that the patterns of caterpillar diversity along environmental gradients of forest age and forest type are consistent during different seasons of the year.
METHODS
Study area
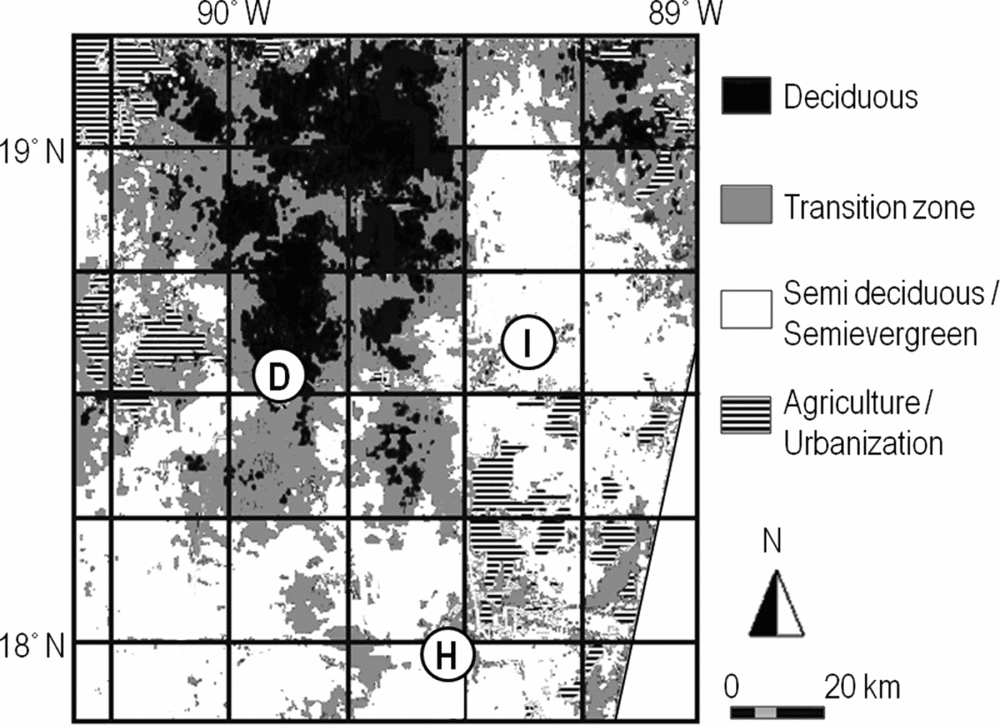
The study area was situated in the Mexican Calakmul Biosphere Reserve (CBR, 7232 km2) and its surroundings. The CBR is located within the largest continuous forest tract in Mesoamerica (Figure 1), but has experienced considerable deforestation in the last decades (Carr Reference CARR, Carr and Stoll1999, Chowdhury Reference CHOWDHURY2006). The area is located on a young plateau of karstic material with altitudes ranging from 11 to 360 m asl. Three seasons can be distinguished in the region: the wet season (June–October), the nortes season (which brings depressions from the north in October–February) and the dry season (February–May). The forests of the CBR and surroundings are categorized into three forest types that differ in annual rainfall regimes deciduousness, stature and relative abundances of species: (1) low- to mid-stature semi-deciduous forest in the north-west (900–1000 mm y−1), where approximately 75% of the tree species are partially or entirely defoliated during the dry season, (2) mid-stature semi-evergreen forest in the south-east central part of the region (1000–1200 mm y−1), where 25–50% of the tree species are deciduous, (3) high-stature semi-evergreen forest in the south (1200–1400 mm y−1), where leaf loss is restricted to particular species (Flores & Espejel Reference FLORES and ESPEJEL1994, Martínez & Galindo-Leal Reference MARTÍNEZ and GALINDO-LEAL2002, Vester et al. Reference VESTER, LAWRENCE, EASTMAN, TURNER, CALME, DICKSON, POZO and SANGERMANO2007). These forest types will be referred to as the dry, intermediate and humid forest types hereafter.

Figure 1. Location of the study sites in the Yucatan Peninsula, Mexico. The three sites correspond to the dry (D), intermediate (I) and humid (H) seasonally dry tropical forest types. This image, based on a Landsat satellite image with bands R-TM4 G-TM5, B-TM-7, gives an approximation of the regional gradient of forest types, but does not discriminate the forest types as classified in the present paper. This is due to present limitation of satellite imagery, the overlap in spectral signatures of vegetation types and seasonal variability of deciduousness or greenness of the vegetation.
Sampling design and data collection
Plant and caterpillar assemblages were sampled in 36 sites, including four sites in young secondary vegetation (5–10 y-old, S1), four sites in older secondary forests (10–30 y-old, S2) and four sites in old-growth forests (>100 y-old, P) within each of three forest types. The secondary forest sites, and most likely the old-growth forests, are all abandoned fields after slash-and-burn shifting cultivation. The sites of old-growth forest were located at least 1 km from the nearest successional vegetation to rule out edge effects from the latter.
The sampling included species abundance data of woody plants of ≥10 cm diameter (diameter at breast height, dbh = 1.3 m) in 500-m2 circular plots, and woody plants of 3–10 cm dbh found in 100-m2 subplots. For plants with <3 cm in the undergrowth (predominantly herbaceous climbers, herbs, perennials, small shrubs and saplings), with stem diameters measured near the forest floor, we estimated the coverage, i.e. area covered by the species divided by the plot area, in four concentric 1-m2 subplots. In the same sites as for plants, caterpillars were sampled in 500-m2 plots, by intensive scanning of the lower vegetation layer (<2 m) for 3 man-hours per plot, while the upper forest layers (2–20 m) were scanned by ascending trees for 1.5 man-hours per plot, using a 3.5-m ladder and rope climbing gear. The 36 plots were periodically visited to sample caterpillars during the months August and September 2006 (wet season), November and December 2006 (nortes season), March and April 2007 (dry season) and July 2007 (wet season). Voucher specimens of caterpillars were collected and preserved in 95% alcohol and later identified and coded as morphospecies using taxonomic keys, online databases and molecular identification through Barcode of Life database (see for details on molecular identification methods Prado et al. Reference PRADO, POZO, VALDEZ-MORENO and HEBERT2011). Voucher specimens were deposited at the Colección de Lepidopterología, Museo de Zoología ECOSUR Chetumal, Mexico.
Evaluation of the sampling data
To assess the representativeness and completeness of the plant and caterpillar sampling data, we calculated Clench species accumulation curves (Clench Reference CLENCH1979, Soberón & Llorente Reference SOBERÓN and LLORENTE1993) using Estimates 9.1v and InfoStat. The Clench model is derived from the Michaelis–Menten equation and assumes that the probability of adding species to the list decreases with the number of species that have already been recorded but increases over time. We selected the Clench model because it is common in the literature and therefore useful for comparisons. The results of the Clench asymptotic model also generally differ little from other models (such as Weibull and Beta-p), and this model has proven to be useful when sampling is focused on species groups with many rare species in a heterogeneous area (Thompson et al. Reference THOMPSON, WITHERS, PIANKA and THOMPSON2003).
Statistical analyses
The differences in the mean species richness (species number per plot) between forest age classes within each forest type were tested using one-way ANOVA or non-parametric Mann–Whitney U-tests (SPSS ver. 17.0) after checking the data assumptions (i.e. the distribution of the abundance data was tested with the Kolmogorov–Smirnov test and the homogeneity of variance with the Levene test).
Changes in species composition and overall biodiversity were described with the counts of the total, shared and exclusive species numbers among forest habitats and forest types. To compare overall patterns of plant and caterpillar species diversity, we initially pooled the caterpillar species abundance data from the seven seasonal samples for each plot, in order to extract the overall patterns of spatial diversity across the seasons. Subsequently, the importance of spatial factors contributing to the species assemblage similarity was quantitatively determined through a two-factor model that partitioned the total variation in species assemblage similarity into relative contributions of the factors forest type, forest age and their interactions. For this we used permutational multivariate analyses of variance with a linear factorial crossed model of additive partitioning of variation (PERMANOVA+, Anderson Reference ANDERSON2001, McArdle & Anderson Reference MCARDLE and ANDERSON2001) in the software PRIMER ver. 6. The Bray–Curtis distance index was used, because of its suitability to describe species turnover. In addition, we used a three-factor model for repeated sampling of the caterpillar data, in order to partition the spatial, as well as the explicit seasonal effects. Previous square root transformation of plant data and fourth root transformation of caterpillar data diminished the effect of zeros and exceedingly high values in the data matrix. For plants <3 cm in diameter we used the coverage as a proxy for relative species abundances. An additional dataset was created as a summary of the whole plant species composition, with presence-absence data of plant species per site, irrespective of plant diameter size and plot size.
For further comparisons of the diversity patterns of plants and caterpillars along forest succession and among forest types, we again used the pooled caterpillar species abundance data at plot level. With one-way PERMANOVA pairwise comparisons, we tested for significant differences in community similarity between forest age classes within the forest types and between forest types including all forest age classes. This model provided Rho values and its P-values, as measures for the strength of evidence with respect to assumption of no differences between these a priori groups. Complementary to these tests, patterns of community similarities were visualized with canonical analyses of principal coordinates (CAP, Anderson & Willis Reference ANDERSON and WILLIS2003), which employs a priori defined factors of forest age and forest types as criteria for choosing a principal axis in ordinate space to maximize the discrimination between groups in the multivariate data cloud. The use of CAP is not so much in testing for group differences (which was already done by PERMANOVA tests), but in characterizing the whole continuous pattern of group similarities in multivariate space (Anderson & Willis Reference ANDERSON and WILLIS2003).
The degree of association between caterpillar and plant assemblage similarities was examined with Spearman rank correlations using the values from the similarity matrices in Relate routines in the PRIMER package. These element-by-element correlations of two similarity matrices with repeated randomizations are similar to Mantel coefficients (Mantel generally uses less flexible Pearson correlations).
RESULTS
Plant diversity
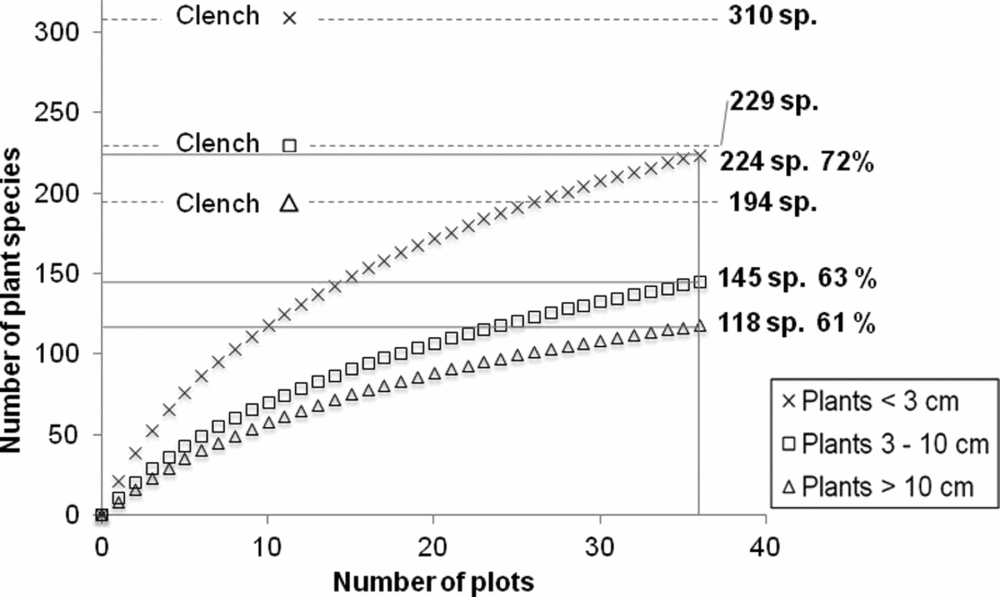
In total, we recorded 299 plant species, including 853 individuals ≥10 cm dbh belonging to 118 species, 1109 individuals 3–10 cm dbh belonging to 145 species and 224 plant species <3 cm in diameter. The species accumulation curves indicated that 61%, 63% and 72% of the estimated richness had been recorded for these three diameter categories respectively, and Clench asymptotes were found at values of 194, 229 and 310 species (Appendix 1).
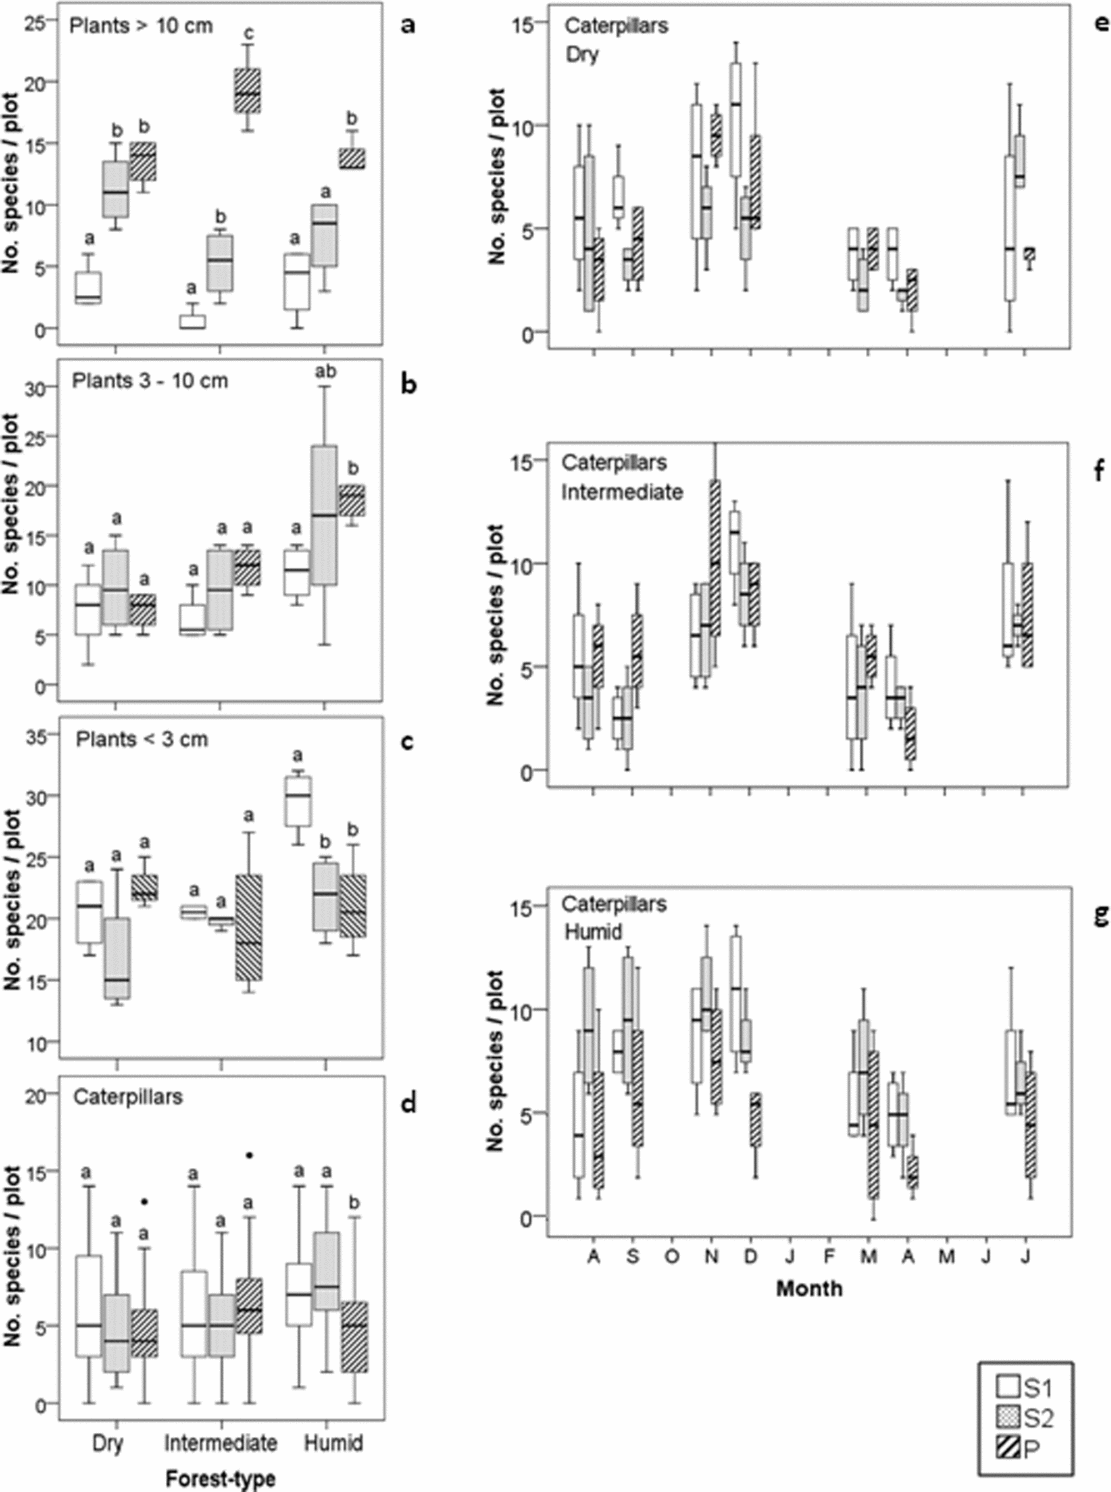
There was a trend of increasing species richness with forest age (S1 <S2 <P) observed for plants ≥10 cm and 3–10 cm dbh (Figure 2a, b). The species richness of plants <3 cm in diameter was usually higher for S1 compared with the older forest age classes, but this difference was only significant for the humid forest type (Figure 2c). For all individual plant dbh classes, the intermediate and humid forests showed greater differences in terms of mean species richness between forest age classes compared with the dry forest (Figure 2a–c). The average plant species richness for the forest age classes showed only a slight increase across the three forest types (i.e. dry S1–intermediate S1–humid S1; dry S2–intermediate S2–humid S2; dry P–intermediate P–humid P).
Figure 2. Boxplots showing differences in plant (a–c) and caterpillar (d) species richness among the forest age classes S1 (5–10 y), S2 (10–30 y) and P (>100 y) in three seasonally dry tropical forest types (dry, intermediate and humid) in the Yucatan Peninsula, Mexico. Plants were separated into three stem diameter classes. Seasonal variation in mean number of lepidopteran species per sampling with error bars showing the standard deviation (e–g).
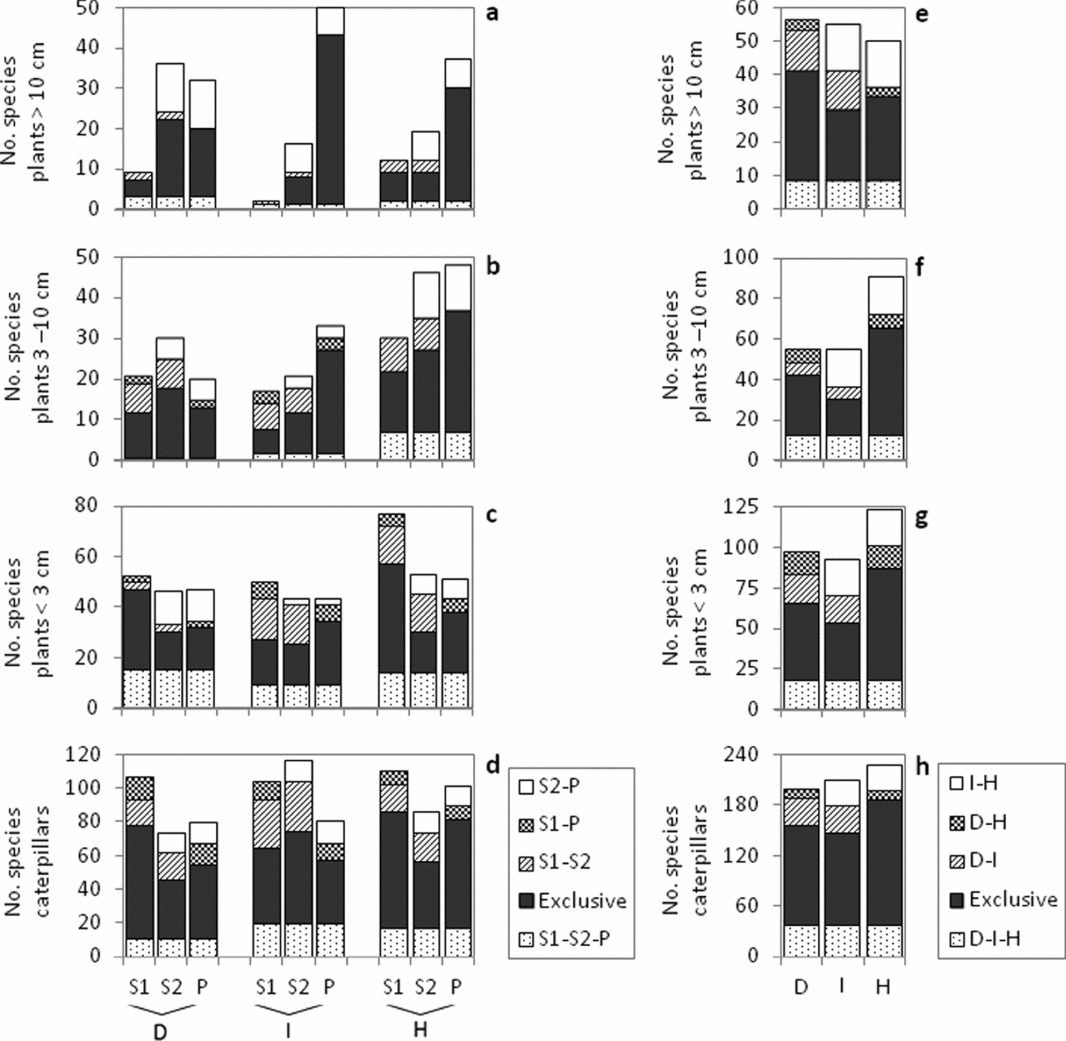
Similarly to plant species richness in the intermediate and humid forests, the number of total and exclusive woody plant species in the ≥10 cm and 3–10 cm dbh classes increased along the successional gradient (S1 <S2 <P); in contrast, the dry forest, total and exclusive woody plant species numbers were highest in the S2 class (Figure 3a, b).
Figure 3. Total number of exclusive and shared species among forest succession classes 5–10 y (S1),10–30 y (S2) and >100 y (P) within the dry (D), intermediate (I) and humid (H) seasonally dry tropical forest types (a–d) in the Yucatan Peninsula, Mexico. Total number of species that are exclusive and shared among forest types (e–h). Plants were separated into three stem diameter classes. Seven periodical samples of caterpillars were pooled to the plot level, to assess overall spatial patterns.
The total number of plant species in the <3 cm dbh category was highest in S1 across forest types (Figure 3c), but only the number of exclusive species occurring in the dry and humid forests was also highest in S1, whereas P-intermediate contained highest exclusive plant species <3 cm in diameter. Within the intermediate and humid forests, the S1 and S2 shared the most species, while in dry forest, the S2 and P classes shared the most species (Figure 3c).
Approximately 70% of all plant species were unique to one of the three forest types. Proportionately, the intermediate forest shared the most species with both the Dry and Humid forests, while the latter two forest types shared fewest species (Figure 3e–g). The total species numbers among the plants ≥10 cm dbh presented similar values across the forest types, and plants 3–10 cm and <3 cm in diameter generally showed the highest total number and the highest exclusive number of species in the humid forest (Figure 3f–g).
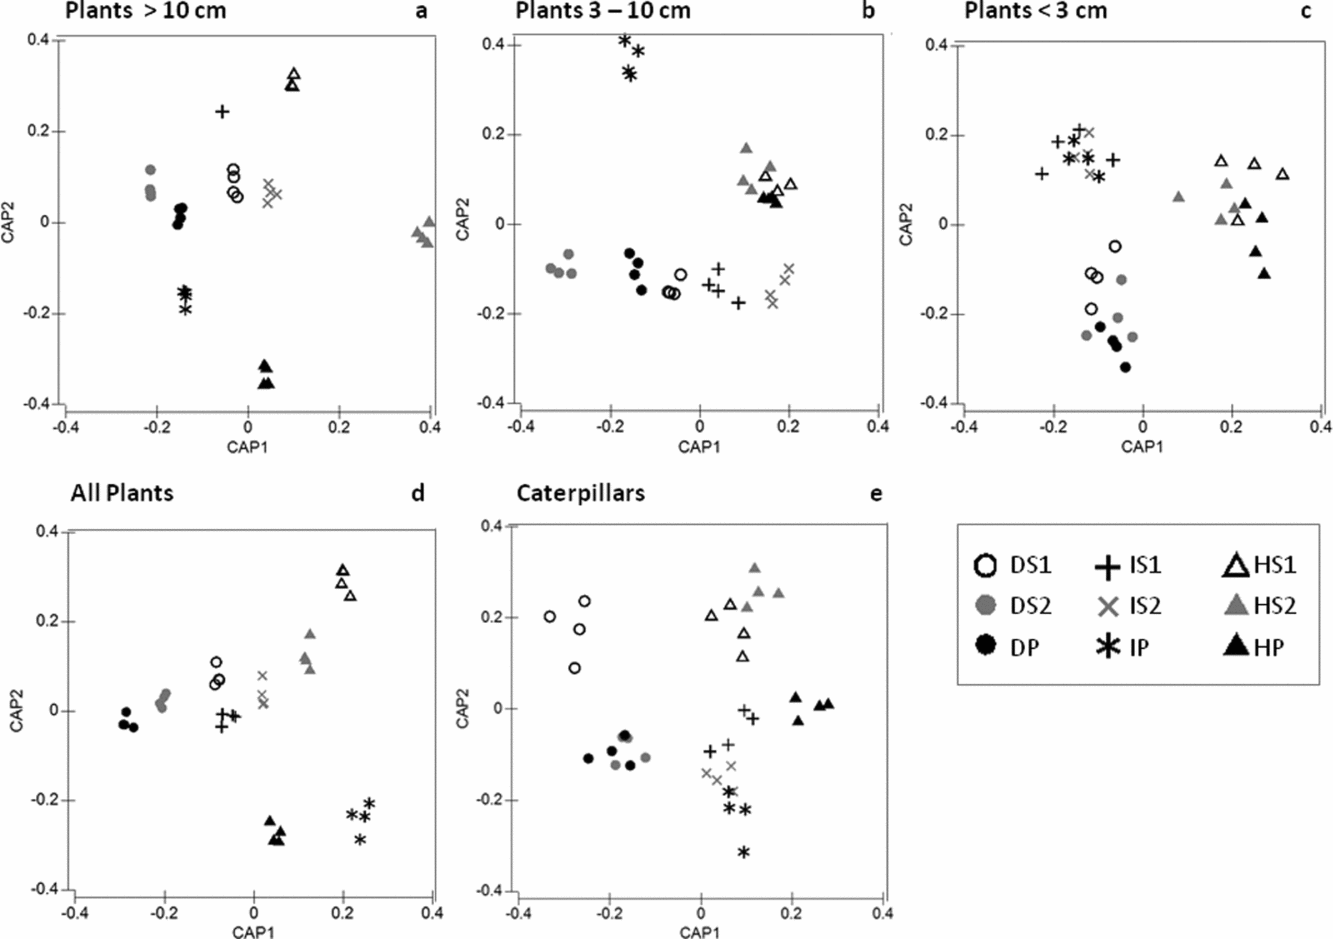
The combined effects of forest type × forest age accounted for almost half of the explained variation in the species composition of plants 3–10 cm and ≥10 cm dbh (Table 1). The ordinations for plants ≥10 cm dbh and all plants illustrate that the relative distance between forest age classes was greatest in the humid forest and decreased towards the dry forest (Figure 4a, d); the results of the pairwise PERMANOVA tests quantitatively demonstrated that the actual differences in the plant species composition between the successive S1/S2 and S2/P forest age classes in the dry and intermediate forest types were often small or non-significant (Table 2). Moreover, the plant species composition of the successive forest age classes in the dry forest strongly differs from the intermediate and humid forests that present similar patterns in ordinate space (i.e. forest age classes are along the CAP2 axis) (Figure 4a, d).
Table 1. The relative importance (expressed in %) of spatial and seasonal effects on the total variation in species composition across forest succession gradients in three adjacent tropical forest types in the southern Yucatan, Mexico. Results were obtained through two-factor PERMANOVA partitioning analyses on Bray–Curtis similarity matrices (P = 0.0002). Plants were separated into different stem diameter classes and seven periodical caterpillar samples were pooled to the plot level. Only the results of the outer two columns on the right, was based on a three-factor model that simultaneously assessed the relative importance of the spatial and temporal components.
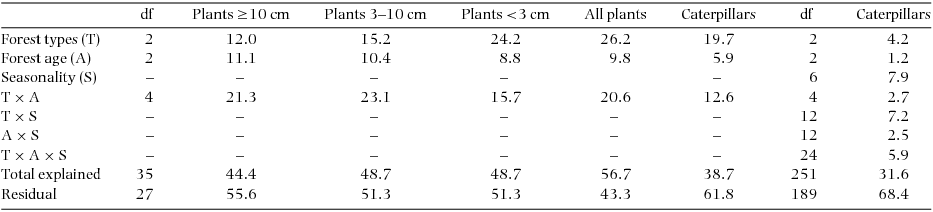
Table 2. Pairwise differences in species community composition between sample groups of forest age classes (S1 = young secondary forest, S2 = old secondary forest, P = old-growth forest) within three seasonally dry tropical forest types in the southern Yucatan Peninsula (dry, intermediate, humid). Results were obtained through pairwise PERMANOVA tests on Bray–Curtis similarity matrices (P = 0.05, ns = not significant). In intermediate S1, only one sampling site included species ≥10 dbh, omitting the test. Plants were separated into three diameter classes (diameter at breast height in centimetres, dbh). Seven periodical samples of caterpillars were pooled to the plot level, in order to assess overall spatial patterns at a yearly base.
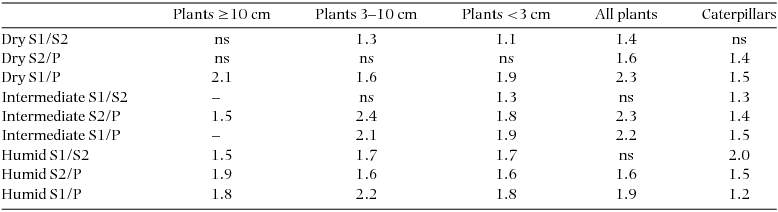
Figure 4. Canonical analyses of principal coordinates (CAP), using a priori defined factors (forest type and forest age) as criteria for choosing a principal axis in ordinate space to maximize the discrimination between sample groups in the multivariate data cloud of community similarities, with relative species abundances of plants in three stem diameter classes (a–c), pooled presence-absence data for plants irrespective of stem size (d) and seasonal caterpillar data pooled to plot level (e). Seasonally dry tropical forest types groups: dry, intermediate and humid; and forest age groups: S1 (5–10 y), S2 (10–30 y), P (>100 y) in the Yucatan Peninsula, Mexico.
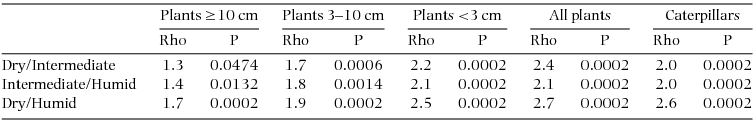
Almost half of the explained variation in plants <3 cm dbh was accounted for by the single contribution of forest type (24.2% out of 48.7% explained variation). The strong turnover between forest types for plants <3 cm dbh was clearly visible in the ordination, where three groups of samples with high similarities corresponded to the three forest types (Figure 4c). This pattern was confirmed by larger pairwise differences between the forest types (Table 3). A similarly large proportion of variance in the groups of all plants (irrespective of diameter) was explained by the effect of forest type (Table 1), and confirmed by large pairwise differences between the forest types (Table 3), but to a lesser extent by the CAP ordination, where forest age classes and forest-type sample groups are still intermixed (Figure 4c).
Table 3. Pairwise differences in species community composition between seasonally dry tropical forest types in the southern Yucatan Peninsula. Each forest type group included 12 samples of young, old secondary and old-growth forests. The results were obtained through pairwise PERMANOVA tests on Bray–Curtis similarity matrices. Plants were separated into three stem diameter classes. Seven periodical samples of caterpillars were pooled to the plot level, in order to assess overall spatial patterns at a yearly base.
Caterpillar diversity
A total of 4761 caterpillars were recorded, corresponding to 485 morphospecies sorted into 26 families, including 405 moth species (84%) and 80 diurnal species (16%). The distribution of the species number per family was similar across the forest types, as were the proportions of diurnal/nocturnal species (in D 13%/87%; in M 20%/80%; and in H 14%/86%). The families Noctuidae, Arctiidae and Lymantriidae (or Erebidae), Crambidae, Elachistidae, Geometridae, Gracillariidae, Hesperiidae, Limacodidae, Notodontidae and Nymphalidae accounted for 84% of the morphospecies.
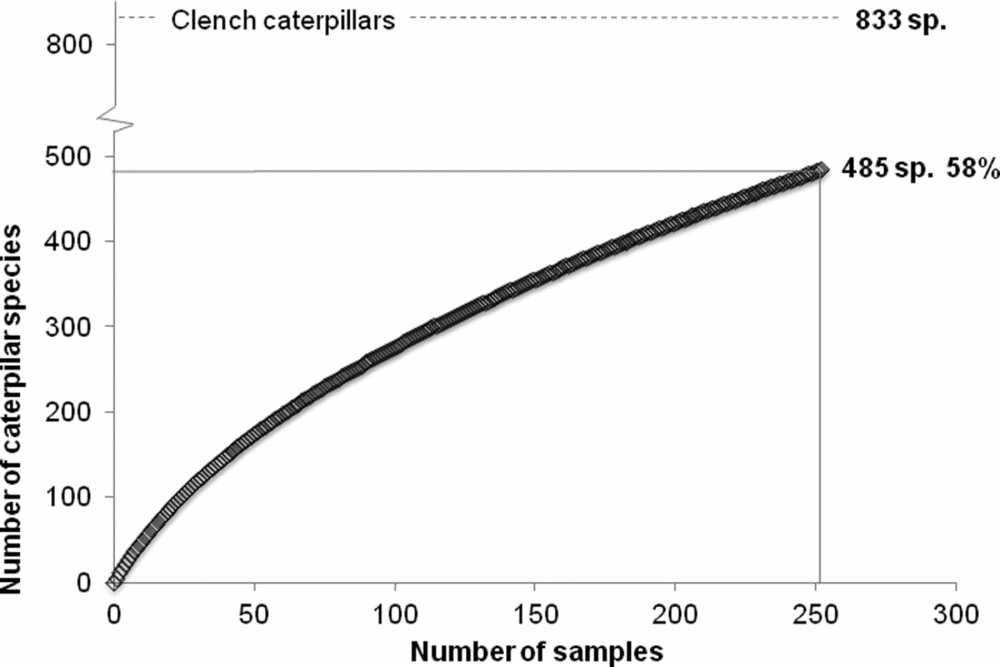
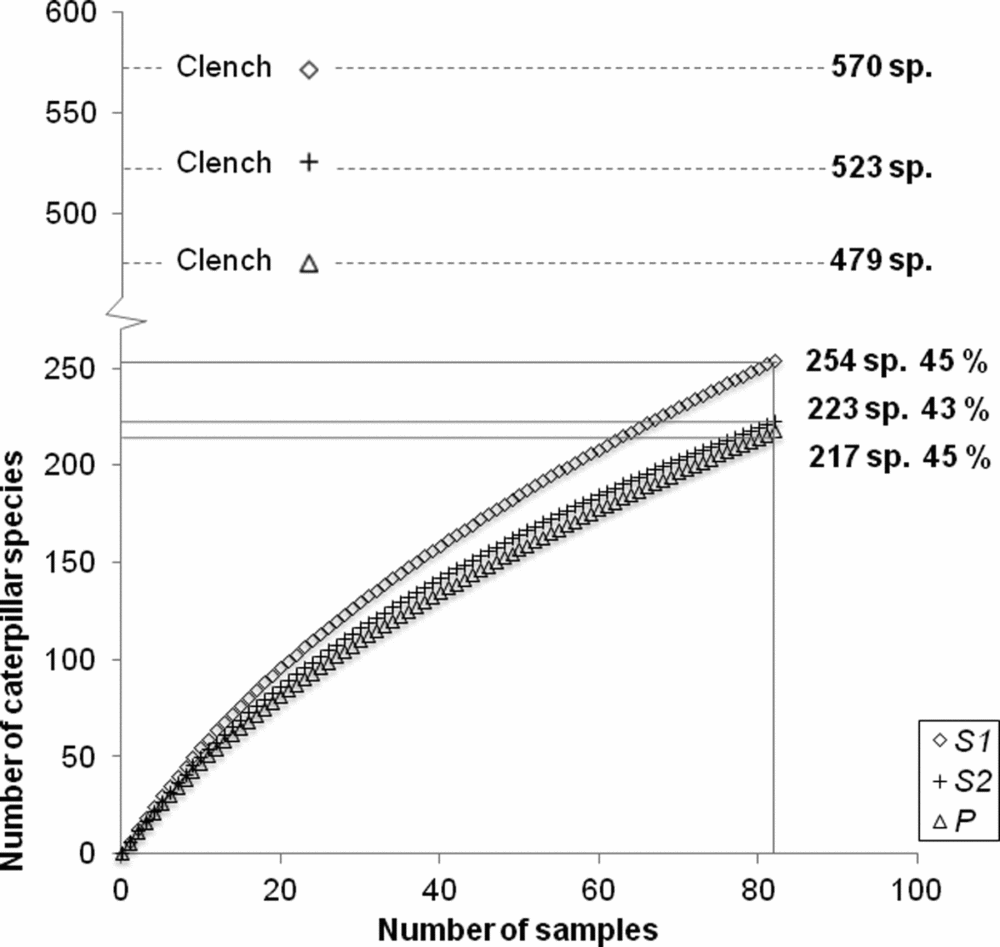
The species accumulation curve for the caterpillars indicated that we recorded 58% of the total estimated species diversity based on the Clench asymptote, which reached a maximum of 833 species (Appendix 2). The observed and expected number of caterpillar species across forest types determined by the asymptote of the Clench model were highest in the young secondary forest (254 and 570 species, respectively), followed by the late-successional (223 and 523 species) and old-growth forest (217 and 479 species) (Appendix 3).
The mean caterpillar species richness across all seasonal samples did not differ among forest habitats, except in the humid forest type, where the successional forests presented higher caterpillar species richness compared with the primary forest (Figure 2d). Looking at the seasonal variability in caterpillar species richness across forest succession gradients, we found that the months November and December showed maxima for all forest types and presented lower values in March and April; however, the variance of species richness was high and we did not identify consistent patterns of significant differences across successional gradients in the different forest types (Figure 2e–g).
The trends in total and exclusive caterpillar species numbers across the forest age gradient were similar in the dry and humid forest types, with the highest values being found in S1 and the lowest values in P and S2, respectively (Figure 3d). The intermediate forest type presented the greatest number of exclusive species in S2, and proportionately, many species were shared between S1 and S2. Of the recorded lepidopteran species, 77% were unique to one of the three forest types. The total caterpillar species number in the intermediate forest type included the fewest exclusive species across the examined forest types (Figure 3h).
The factor forest type explained approximately half (19.7%) of the 38.2% of the total explained variation in caterpillar assemblage similarity (Table 1). The PERMANOVA pairwise tests showed that the largest differences in the caterpillar compositions of the dry and intermediate forest types existed between S1 and P, whereas in the humid forest type, the differences were slightly larger between P, S1 and S2 (Table 2, Figure 4e). Under the three-factor partitioning model, we observed a total explained variation of 31.6%, for which the single contribution of seasonality (7.9%) was most important, followed by the seasonality × forest type (7.2%) and seasonality × forest age × forest type (5.9%) interactions (Table 1), which implies that the organization of the species assemblage similarities along gradients of forest types and forest age classes differed in each snapshot of time. Nevertheless, for both of the aforementioned partitioning models, the relative contribution of the forest type was approximately three times higher than the forest age in explaining the variation.
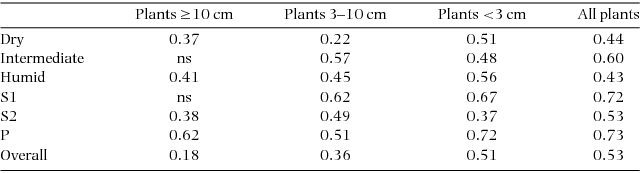
The overall correlations between the similarity matrices for caterpillars and plants with a small diameter were stronger than those between caterpillars and plants with a larger diameter (Table 4). However, the correlations do not follow any particular pattern along the gradients of forest age or forest type.
Table 4. Correlation coefficients between corresponding community similarities of caterpillars and plants of different diameter classes along gradients of forest types (dry, intermediate, humid) and forest age classes (S1 = young secondary forest, S2 = old secondary forest, P = old-growth forest) in the southern Yucatan Peninsula. Results were obtained through permutated Relate routines, which is a type of Mantel test with Spearman correlation (P <0.05, ns = not significant). Plants were separated into stem diameter categories. Seven periodical samples of caterpillars were pooled to the plot level, in order to assess overall spatial patterns at a yearly base.
DISCUSSION
Plant diversity among forest age classes and forest types
The results of this study suggest that the diversity of plants >3 cm dbh increases with forest age, in contrast to the higher species diversity of plants <3 cm in diameter in secondary vegetation. The differences in species numbers were most notable in the transitional and humid forest types. Other studies have also indicated a positive relationship between forest age and tree diversity in neotropical seasonally dry forests (Chazdon Reference CHAZDON, Carson and Schnitzer2008, Hernández-Stefanoni et al. Reference HERNÁNDEZ-STEFANONI, DUPUY, TUN-DZUL and MAY-PAT2011, Kalacska et al. Reference KALACSKA, SANCHEZ-AZOFEIFA, CALVO-ALVARADO, RIVARD and QUESADA2005, Lebrija-Trejos et al. Reference LEBRIJA-TREJOS, BONGERS, PÉREZ-GARCÍA and MEAVE2008, Madeira et al. Reference MADEIRA, ESPÍRITO-SANTO, ANGELO-NETO, NUNES, SANCHEZ-AZOFEIFA and QUESADA2009, Molina-Colón & Lugo Reference MOLINA-COLÓN and LUGO2006, Ruiz et al. Reference RUIZ, FANDIÑO and CHAZDON2005), and higher plant species diversity of the understorey and the undergrowth in secondary compared with mature humid forests (Bobo et al. Reference BOBO, WALTERT, FERMON, NJOKAGBOR and MÜHLENBERG2006, Kessler et al. Reference KESSLER, ABRAHAMCZYK, SOS, BUCHORI, PUTRA, GRADSTEIN, HÖHN, KLUGE, OREND, PITOPANG, SALEH, SCHULZE, SPORN, STEFFAN-DEWENTER, TJITROSOEDIRDJO and TSCHARNTKE2009, Schulze et al. Reference SCHULZE, WALTERT, KESSLER, PITOPANG, SHAHABUDDIN, VEDDELER, MÜHLENBERG, GRADSTEIN, LEUSCHNER, STEFFAN-DEWENTER and TSCHARNTKE2004). Kennard (Reference KENNARD2002) showed that a higher species density of long-lived pioneers and herbs in young seasonally dry forests contributes to higher species diversity of plants with a small diameter. Most species found younger successional forests probably also occur in old-growth forests of the Yucatan due to natural disturbances (e.g. gap dynamics, hurricanes, fire). In contrast, future efforts with spatially intensive sampling designs should narrow down the list of disturbance-sensitive species, exclusively found in old-growth forests.
For plant communities in each forest age class across the forest type gradient, the results confirmed the idea that species numbers are highest in more humid forests, in accordance with previous studies (Gentry Reference GENTRY, Bullock, Mooney and Medina1995, O'Brien et al. Reference O'BRIEN, FIELD and WHITTAKER2000). Plant species in old successional vegetation however, contribute considerably to the overall plant biodiversity in the dry-forest zone, especially for plants >3 cm dbh. Moreover, in old-growth forests, the number of species of plants ≥10 cm dbh was higher at the intermediate position along the rainfall gradient. From a previous study (Essens et al. Reference ESSENS, LEYEQUIEN and POZO2010), we know that high plant diversity in the intermediate forest type is associated with the large number of species shared with both the dry and the humid forests, indicating that species’ ranges tend to overlap more toward the centre of a domain than towards its limits (Colwell & Lees Reference COLWELL and LEES2000); however, for reasons not fully understood, the old-growth intermediate forest type also appears to harbour the greatest number of exclusive plant species compared with the other two forest types (Essens et al. Reference ESSENS, LEYEQUIEN and POZO2010).
The results support the hypothesis that the post-disturbance recovery of plant species diversity and plant species composition is faster in dry compared with more humid tropical forests, as implied by previous studies (Brown & Lugo Reference BROWN and LUGO1990, Chazdon et al. Reference CHAZDON, LETCHER, VAN BREUGEL, MARTÍNEZ-RAMOS, BONGERS and FINEGAN2007). However, multivariate analyses also showed that the development of post-disturbance recovery of plant species diversity in the driest forest type is very different from more humid forests. This could be a result of the differences among forest types in various factors and processes influencing forest succession, such as variations in water, light and nutrient availability that influence the successive establishment of plant species with different strategies and functional characteristics. For instance, the canopies of dry forests are more open compared with forest types with more rainfall, and the co-occurrence of light-demanding and shade-tolerant species may result in a less distinctive change from young to older dry forests. Furthermore, the presence of resprouting plants in tropical drier forests, including pioneer and late-successional species, promotes the recovery of the plant species composition (Lebrija-Trejos et al. Reference LEBRIJA-TREJOS, BONGERS, PÉREZ-GARCÍA and MEAVE2008, Vesk & Westoby Reference VESK and WESTOBY2004). Resprouting species generally grow faster and are competitively dominant over others, since they efficiently exploit limited water through their extended root networks. Many resprouting plant species, particularly long-lived pioneers of Fabaceae and Polygonaceae, still persist in old secondary dry forest, thereby contributing to the high density of woody plant species in old secondary forests, as well as to the overlap in species composition in old secondary and old-growth forests. The decline of the diversity of plants >3 cm dbh from old secondary to old-growth dry forests is possibly related to the mortality of these long-lived pioneers during further ageing. In more humid forests, drought-sensitive, shade-tolerant and slow-growing tree species are likely to suffer high mortality due to disturbance and slowly recover during succession. Young secondary forests in the intermediate and humid forests are dominated by fast-growing woody pioneer species that produce dense canopies which potentially encourages a stable microclimate, allowing the establishment of undergrowth species (shrubs, perennials) and seedlings.
Caterpillar species data
We recorded more than half of the total expected number of species at the investigated sites. Nocturnal microlepidoptera are likely underrepresented in our study, but the proportions of moths and butterflies are similar to those found in previous studies. Heppner (Reference HEPPNER1991) reported that the number of species of Papilionoidea identified in their work represented 13% of the total number of species worldwide. Llorente et al. (Reference LLORENTE-BOUSQUETS, VARGAS-FERNANDEZ, LUIS-MARTÍNEZ, TRUJANO-ORTEGA, HERNÁNDEZ-MEJIA and WARREN2013) recorded 13% of the total number of Rhopalocera species worldwide. Heppner (Reference HEPPNER2002) obtained listed and expected numbers of Papilionoidea species corresponding to 13% and 8%, respectively, of the total species number found in Mexico. Only the intermediate forest type appears to harbour a high estimated number of butterfly species, similar to the 20% of Rhopalocera species recorded in the southern Yucatán by Essens & Hernández-Stefanoni (Reference ESSENS and HERNÁNDEZ-STEFANONI2013). The relative proportions of the abundances of the 10 most dominant families reported by the only two studies conducted on the Yucatan Peninsula to examine adult moth diversity (Montero- Muñoz et al. Reference MONTERO-MUÑOZ, POZO and CEPEDA-GONZÁLEZ2013, Prado et al. Reference PRADO, POZO, VALDEZ-MORENO and HEBERT2011) also corroborate our findings. These results suggest that the obtained caterpillar data are satisfactorily representative for further analyses.
Caterpillar diversity among forest age classes and forest types
Our findings suggest that total lepidopteran species numbers are higher in young vegetation, as reported in several other studies (e.g. caterpillars: Floren & Linsenmair Reference FLOREN and LINSENMAIR2001, butterflies: Bobo et al. Reference BOBO, WALTERT, FERMON, NJOKAGBOR and MÜHLENBERG2006, Vester et al. Reference VESTER, LAWRENCE, EASTMAN, TURNER, CALME, DICKSON, POZO and SANGERMANO2007, moths: Axmacher et al. Reference AXMACHER, TÜNTE, SCHRUMPF, MÜLLER-HOHENSTEIN, LYARUU and FIEDLER2004). Various mechanisms can potentially cause higher diversity of herbivorous insects, among which an increased number of host plant species, a higher beta diversity of hosts and insects, an increased number of insect species associated with plant species, and a greater ecological specialization (Lewinsohn & Roslin Reference LEWINSOHN and ROSLIN2008, Lewinsohn et al. Reference LEWINSOHN, NOVOTNY and BASSET2005). There are several indications that local diversity as well as the turnover of plant species in the undergrowth play important roles for Lepidoptera dynamics. Environmental disturbance and associated environmental heterogeneity contribute to the maintenance of alpha and beta diversity of undergrowth vegetation as well as mobile insects (Brown Reference BROWN1997, Hill & Hamer Reference HILL and HAMER2004, Koh Reference KOH2007, Tscharntke & Brandl Reference TSCHARNTKE and BRANDL2003, Tscharntke et al. Reference TSCHARNTKE, SEKERCIOGLU, DIETSCH, SODHI, HOEHN and TYLIANAKIS2007), whereas large-scale disturbances can lead to the homogenization of species diversity across spatial scales (Kitching et al. Reference KITCHING, ORR, THALIB, MITCHELL, HOPKINS and GRAHAM2000). It has been noted that the completion of life cycles of various Lepidoptera species depend on the spatio-temporal coherence between different food resources and niches found across habitat types (e.g. roosting sites, mate location, enemy-free space for larvae) (Dennis et al. Reference DENNIS, SHREEVE and VAN DYCK2006). Also, high butterfly species density in young successional vegetation has previously been attributed to the availability of flowers for foraging together with courtship and perching locations, and the source-sink dynamics with the surrounding older vegetation (Vester et al. Reference VESTER, LAWRENCE, EASTMAN, TURNER, CALME, DICKSON, POZO and SANGERMANO2007), although certain guilds, such as fruit-feeding or light-avoiding butterflies, are more susceptible to disturbance (Bowman et al. Reference BOWMAN, WOINARSKI, SANDS, WELLS and MCSHANE1990, Laurance et al. Reference LAURANCE, LOVEJOY, VASCONCELOS, BRUNA, DIDHAM, STOUFFER, GASCON, BIERREGAARD, LAURANCE and SAMPAIO2002, Schulze et al. Reference SCHULZE, WALTERT, KESSLER, PITOPANG, SHAHABUDDIN, VEDDELER, MÜHLENBERG, GRADSTEIN, LEUSCHNER, STEFFAN-DEWENTER and TSCHARNTKE2004). The results of the present study suggest that patches of young successional vegetation are key to the reproduction of many Lepidoptera species, possibly due to the fact that young vegetation, as well as gaps and forest-edges include highly diverse host plant species groups, such as long-lived woody pioneers, climbers, shrubs, herbs and saplings (Lepš et al. Reference LEPŠ, NOVOTNÝ and BASSET2001, Robinson et al. Reference ROBINSON, ACKERY, KITCHING, BECCALONI and HERNANDEZ2001).
To date, no predictable patterns have been found of herbivore densities on climax versus pioneer host plant species (Basset Reference BASSET1996, Lepš et al. Reference LEPŠ, NOVOTNÝ and BASSET2001, Marquis Reference MARQUIS, Price, Lewinsohn, Fernandes and Benson1991, Novotný Reference NOVOTNÝ1994), or ecological specialization of insect herbivores across tropical forest succession (Basset Reference BASSET1996, Janzen Reference JANZEN, Basset, Novotny, Miller and Kitching2003, Lepš et al. Reference LEPŠ, NOVOTNÝ and BASSET2001, Marquis Reference MARQUIS, Price, Lewinsohn, Fernandes and Benson1991, Novotný Reference NOVOTNÝ1994). In our study we did not find any patterns in the strength of association between the caterpillar and plant community turnover with increasing forest age, indicating that host specialization does not predictably change along environmental gradients. We did observe however, that specific dominant long-lived pioneer plant species in secondary forests, such as Croton campechianum, Croton arboreus, Lonchocarpus xuul, Nectandra coriacea and Myrcianthes fragrans, represented important food sources for many host-specific caterpillar species. The relative abundance of these long-lived pioneers could positively influence diversity of insect host specialists in young tropical vegetation. Although ecological specialization of herbivores may not change over forest succession gradients, higher trophic levels may be more sensitive to forest disturbance. For example, a high degree of specialized predators (e.g. ants) have been reported in old forests, which could cause higher pressure on herbivore insects (Floren et al. Reference FLOREN, BIUN and LINSENMAIR2002, Klimes et al. Reference KLIMES, IDIGEL, RIMANDAI, FAYLE, JANDA, WEIBLEN and NOVOTNY2012).
In a broader spatial context, we saw that species composition of caterpillars as well as small plants in the undergrowth varied substantially among the three forest types. Species turnover of caterpillars and plants was notably correlated, but there was no specific pattern concerning the degree of association between these groups along gradients of succession or rainfall. The importance of regional species turnover observed for caterpillars is in agreement with previously observations of adult butterflies (Pozo et al. Reference POZO, LUIS-MARTINEZ, UC-TESCUM, SALAZ-SUAREZ and MAYA-MARTINEZ2003), and is possibly associated with climatic cues and temporal stability of host plants.
Our results did not show any pattern in the degree of association between caterpillar and plant species turnover across forest types, suggesting there is no pattern in host specialization. The degree of specialization at different trophic levels, however, may be important for patterns of increasing insect diversity at even broader spatial scale. To illustrate, higher herbivore specialization in the tropical forests compared with temperate forests may be the result of more distinct plant secondary chemical profiles from one tree species to the next, and, together with the existence of more diverse and chronic predation pressures, could lead to a greater turnover of caterpillar species between tree species in the tropics (Dyer et al. Reference DYER, SINGER, LILL, STIREMAN, GENTRY, MARQUIS, RICLEFS, GREENEY, WAGNER, MORAIS, DINIZ, KURSAR and COLEY2007, Reference DYER, WAGNER, GREENEY, SMILANICH, MASSAD, ROBINSON, FOX, HAZEN, GLASSMIRE, PARDIKES, FREDRICKSON, PEARSON, GENTRY and STIREMAN2012).
Seasonal variation in caterpillar diversity
Our results indicated that seasonality is a major driver of lepidopteran reproductive activity. In terms of overall species numbers, we found peaks of caterpillar species richness in the nortes season, when the humidity is still high and the temperatures, when humidity is still high and temperatures are lower compared with the wet season (Montero-Muñoz et al. Reference MONTERO-MUÑOZ, POZO and CEPEDA-GONZÁLEZ2013), which may encourage larval development. It is possible that the pupal stage of many Lepidoptera species occurring during the Nortes season persist through the dry season, followed by their emergence right at the beginning of the first rains, which coincides with the adult peak abundances and species numbers of dominant families (Montero-Muñoz et al. Reference MONTERO-MUÑOZ, POZO and CEPEDA-GONZÁLEZ2013).
We observed strong seasonal species turnover, with relative species abundances and species numbers of entire families (e.g. Hesperiidae) associated to certain periods of the year. Intachat et al. (Reference INTACHAT, HOLLOWAY and STAINES2001) suggested that climatic stimuli, including rainfall, temperature, humidity and photoperiod, may be more important to insect composition than plant phenology components, such as leaf flush and flowering and availability of ephemeral plant parts. However, climate strongly influences, directly and indirectly, herbivore insect and plant phenology (Parker Reference PARKER, Lowman and Nadkarni1995, Reavey Reference REAVEY, Stamp and Casey1993, Van Asch & Visser Reference VAN ASCH and VISSER2007). The availability and quality of ephemeral plant parts of the undergrowth vegetation are very sensitive to rainfall in TDF, and future research should be conducted to examine the temporal dynamics of the undergrowth vegetation and its effects on insects.
Finally, the spatial distribution of insect host generalists may contain even higher seasonal variability and factors such as the microclimate and predation than host specialists, which are strongly limited by young or late-successional host plant species. Previous studies indeed suggest that rainfall can influence the temporal patterns of insect species reallocation between forest patches with different disturbance history, although temporal effects on insect distribution remain fairly unpredictable (Barlow & Woiwod Reference BARLOW, WOIWOD, Knight and Holloway1990, Hamer et al. Reference HAMER, HILL, MUSTAFFA, BENEDICK, SHERRATT, CHEY and MARYATI2005, Hilt et al. Reference HILT, BREHM and FIEDLER2007, Tylianakis et al. Reference TYLIANAKIS, KLEIN and TSCHARNTKE2005).
Conclusions
Altogether, the differences in local plant diversity among successional forest habitats are smaller and often non-significant in the driest forest type, contrasting with larger and often significant differences in local plant diversity among forest habitats in the humid forest type. Also the patterns in species turnover of large plants (mostly trees), strongly influenced by combined effects of forest type and forest age, suggested a faster recovery of this component of plant diversity in the driest forest type compared with the intermediate and humid forest types. We discussed various ecological factors and processes that may be responsible for the changes in forest development among the forest types, but the association of our observations still require further comparative and experimental studies. Species turnover of small plants in the undergrowth and caterpillars on the other hand, was notably influenced by the individual factor of forest types. However, we found high seasonal variability in caterpillar species diversity, leading to inconsistent diversity patterns across environmental gradients for the individual periods. These results question the generalization of patterns in insect diversity over environmental gradients based on short time scales. Samples taken over longer periods should be able to offer a more realistic picture of spatio-temporal variation in insect diversity.
ACKNOWLEDGEMENTS
We thank Maarten Debruyne, Richard van Sluis, Angeles Islas Luna, Miguel Xijun Kantun, Blanca Prado and students from the Instituto Tecnológico de Chetumal for their assistance. The authors thank the anonymous reviewer whose contributions greatly improved the clarity of this paper. We are grateful to NASA-LCLUC (Land Cover and Land Use Change Program for the Southern Yucatan Peninsular Region, NAG5–6046 and NAG5–11134) and the Dutch Canopy Foundation (Stichting Het Kronendak) for their financial support.
Appendix 1. Clench species accumulation curves for woody plants of different stem diameter categories. The curves indicate that the samples reached 61–72% of the estimated species diversity in the different forest age classes S1 (5–10 y), S2 (10–30 y), P (>100 y) across seasonally dry forest types of the southern Yucatan Peninsula.
Appendix 2. Clench species accumulation curve of caterpillar diversity, reaching 58% of the total estimated 833 species in the 36 sampling sites in different forest age classes and forest types in the Yucatan Peninsula, Mexico.
Appendix 3. Clench species accumulation curves for caterpillar data in the different forest age classes S1 (5–10 y), S2 (10–30 y), P (>100 y) across the forest types. The curves indicate we reached 43–45% of the estimated species diversity in the different forest age classes, S1 (5–10 y), S2 (10–30 y), P (>100 y) across seasonally dry forest types of the southern Yucatan.