


Introduction
Sheep production systems play a crucial role in the livelihood security of millions of people in arid and semi-arid regions of India. Growth rate is the most important component for improving the efficiency of the sheep industry. Considering the variation between the growth rates of different lambs, it may be possible to partition into genetic and environmental parts to identify the potential of a particular trait for selection strategies. Selection using average daily gain (ADG) is an important selection criterion for boosting the production and profitability of a sheep (Abegaz et al., Reference Abegaz, van Wyk and Olivier2005; Mohammadi et al., Reference Mohammadi, Shahrebabak, Shahrebabak, Bahrami and Dorostkar2013). Along with ADG, feed conversion efficiency is also another important aspect for framing any selection strategy especially considering from the points of view of economics and market output. Kleiber (Reference Kleiber1947) provided the Kleiber ratio (KR) as a measure of feed conversion efficiency or growth efficiency. Although, ADG and KR are positively associated with each other, KR predicts feed conversion more accurately than ADG by accounting for the metabolic weight of an animal (Scholtz et al., Reference Scholtz, Roux, De and Schoeman1990; Badenhorst, Reference Badenhorst2011).
For a particular trait of interest, the estimates of the genetic variation are not rigid. The animal models accounting for maternal effects (genetic/environmental), along with direct effects, may provide unbiased estimates of variance components for a trait (Ekiz, Reference Ekiz2005; Kariuki et al., Reference Kariuki, Ilatsia, Kosgey and Kahi2010; Prince et al., Reference Prince, Gowane, Chopra and Arora2010; Bangar et al., Reference Bangar, Magotra and Yadav2020). However, many factors, including size of population and environmental conditions, may fluctuate the direct effects and maternal effects associated with these traits. Therefore, consistent and unbiased estimates of direct and maternal effects by assessing animal models with stringent evaluation criteria are a pre-requisite to maximize genetic gain for economically important traits (Eskandarinasab et al., Reference Eskandarinasab, Ghafouri-Kesbi and Abbasi2010; Tesema et al., Reference Tesema, Alemayehu, Getachew, Kebede, Deribe, Taye, Tilahun, Lakew, Kefale, Belayneh, Zegeye and Yizengaw2020).
After consideration of the above-mentioned inducements, the present study was conducted to estimate (co)variance components and genetic parameters for growth rate and KR in Harnali sheep using animal models.
Materials and methods
Animal resource and targeted traits
Harnali sheep are a newly developed synthetic dual-purpose strain. The chief attributes of Harnali are superior carpet wool and better growth performance. It is a three-breed cross from 62.5% exotic inheritance (Russian Merino and Corriedale) and 37.5% Nali. Photographs of a Harnali female and a Harnali male are presented in Figure 1 and Figure 2, respectively. The data for the present investigation, extending over a period of 21 years, from 1998 to 2018 were collected from the history and pedigree sheets maintained at a sheep breeding farm, LUVAS, in Hisar (India). The targeted growth rates were generated using weights at different stages, namely average daily gain (in grams) from birth weight to 3 months of age (ADG1), 3 months to 6 months of age (ADG2), and 6 months to 12 months of age (ADG3). The growth efficiency in terms of Kleiber ratio was also calculated as KR1 = ADG1/WWT0.75, KR2 = ADG2/6WT0.75, and KR3 = ADG3/YWT0.75.
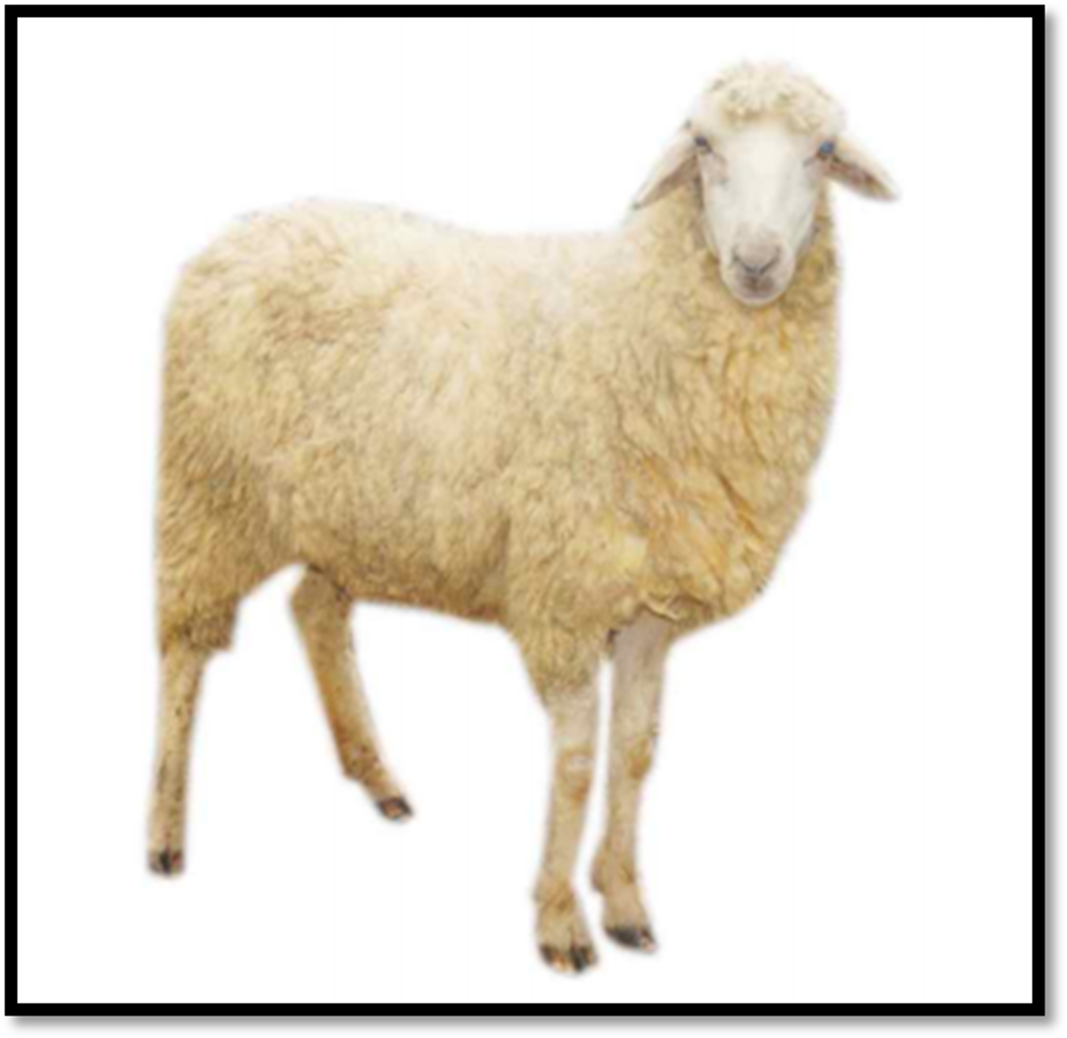
Figure 1. Harnali female
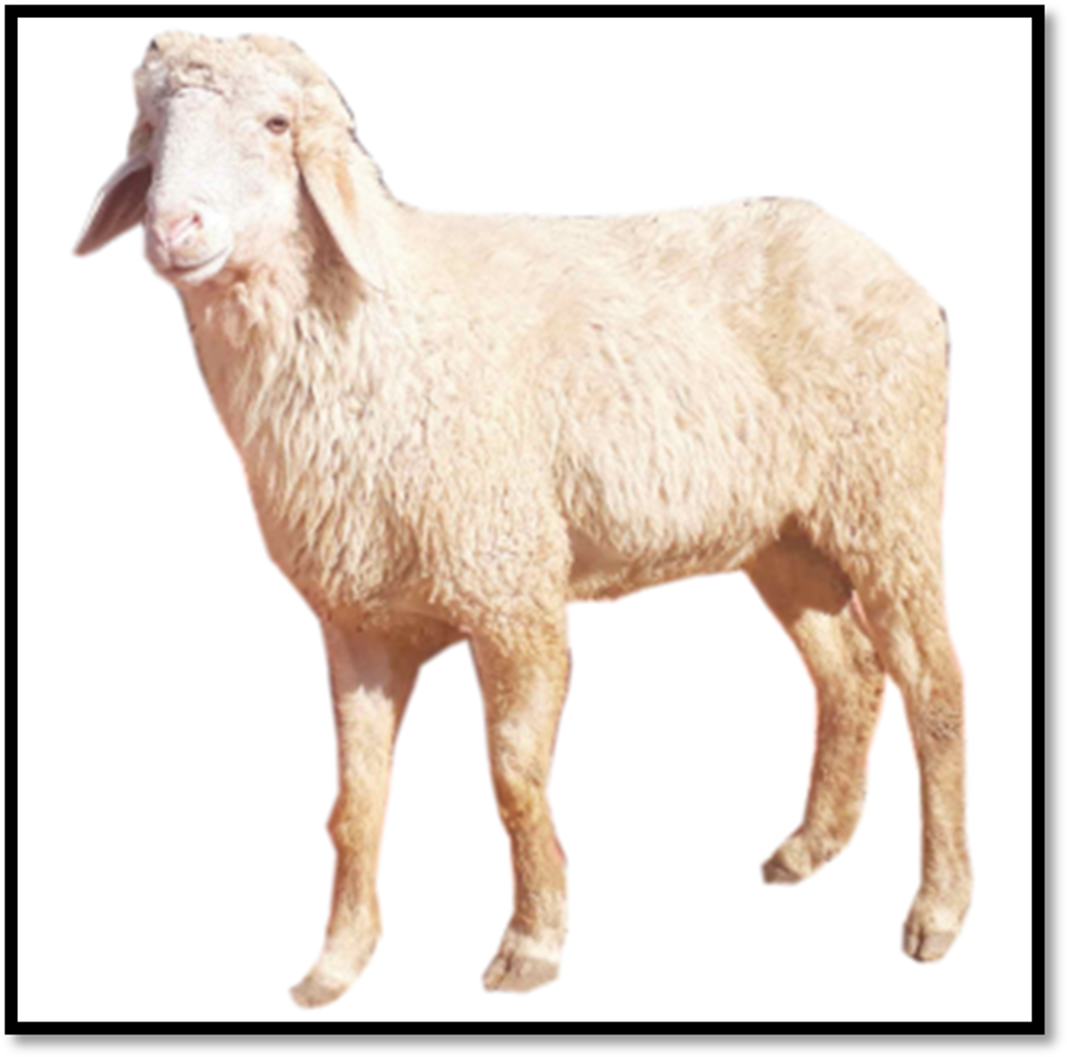
Figure 2. Harnali male
Statistical analysis
A general linear model consisting of the fixed effects of year of birth in seven classes (1998–2018) with each class comprising 3 years, sex of lamb in two classes (male and female) and the dam’s weight at lambing in three classes (21–27.9, 28.0–30.0 and 30.1–43 kg) was used to determine the significant influences of these factors on targeted traits. Total variation among the targeted traits was subjected for partitioning into direct additive, maternal genetic, maternal permanent environmental and residual variation using the restricted maximum likelihood method (AI-REML) and WOMBAT software (Meyer, Reference Meyer2007). The six univariate models including or excluding maternal effects, which were fitted to estimate genetic covariance components and corresponding heritability for each trait are given in Table 1. Maternal repeatability was estimated as per Al-Shorepy (Reference Al-Shorepy2001). The total heritability was also estimated as per the formula given by Willham (Reference Willham1972). The evaluation of different animal models was carried out using the log-likelihood test (Prince et al., Reference Prince, Gowane, Chopra and Arora2010).
Table 1. Six univariate models including or excluding maternal effects

where y is the vector of observations; β, a, m, c and e are vectors of fixed, direct additive genetic, maternal additive genetic, maternal permanent environmental effects, and residual effects, respectively; with respective association matrices X, Z 1 , Z 2 , and Z 3 ; A is the numerator relationship matrix between animals; and σ am is the covariance between additive direct and maternal genetic effects.
Results
The characteristics of data structure, i.e. the number of individuals, number of sires and dams, mean, standard deviations and coefficient of variation for respective traits, are summarized in Table 2. Mean values accounted for ADG1, ADG2, ADG3, KR1, KR2 and KR3 and were 109.13 g, 49.90 g, 35.06 g, and 15.65, 5.72 and 3.18, respectively.
Table 2. Characteristics of data structure for traits under study of Harnali sheep

ADG1: Average daily gain from birth to 3 months of age; ADG2: Average daily gain from 3 months to 6 months of age; ADG3: Average daily gain from 6 months to 12 months of age; KR1: Kleiber ratio associated with ADG1; KR2: Kleiber ratio associated with ADG2; KR3: Kleiber ratio associated with ADG3.
Estimates of (co)variance components, additive and maternal genetic parameters obtained in most suitable models, along with their log-likelihood values are presented in Table 3. For traits ADG1, KR1 and KR2, model 2 accounting for direct and maternal effects was found to be the most appropriate. This included growth rate and feed conversion efficiency during the pre-weaning period that was significantly influenced by individual as well as by maternal genes. Whereas, for remaining traits, the most suitable model was model 1. Estimates of direct effects in terms of direct heritability (h2) for ADG1, ADG2, ADG3, KR1, KR2 and KR3 resulting from best model were 0.06 ± 0.03, 0.14 ± 0.04, 0.05 ± 0.03, 0.04 ± 0.03, 0.11 ± 0.04 and 0.05 ± 0.03, respectively. The estimates of maternal effects (m2) for ADG1, KR1 and KR2 were 0.07 ± 0.02, 0.06 ± 0.02 and 0.04 ± 0.02, respectively.
Table 3. Genetic parameter estimates for traits studied fitting the most appropriate model

σ2 a: Direct genetic variance; σ2 m: Maternal additive genetic variance; σ2 e: Residual variances; σ2 p: Phenotypic variances; h2 ± S.E.: Direct heritability; m2 ± S.E.: Maternal heritability; ht 2: Total heritability; tm: Repeatability of ewe performance; Log-L: Log-likelihood for the best model.
The estimates of genetic and phenotypic correlations for targeted traits are shown in Table 4. The genetic correlation estimates for the studied traits were in the range from −0.35 ± 0.11 (ADG1-KR2) to 0.98 ± 0.01 (ADG2-KR2 and ADG3-KR3). The estimated genetic correlation between ADG and their respective KR at the same age was found to be significantly high and positive, i.e. ADG1-KR1 (0.91 ± 0.02), ADG2-KR2 (0.98 ± 0.01) and ADG3-KR3 (0.98 ± 0.01). All the remaining traits were negatively correlated to each other. The estimates of phenotypic correlation ranged from −0.36 ± 0.02 to 0.98 ± 0.01 for ADG1-KR2 and ADG2-KR2, respectively. For aspects of phenotypic correlation between pre-weaning traits, ADG1-KR1 were positively correlated (0.95 ± 0.01). ADG1 and KR1 were negatively correlated with post-weaning average daily gains (ADG2 and ADG3) and post-weaning Kleiber ratio (KR2 and KR3). ADG2-KR2 and ADG3-KR3 were also found to be positively correlated, 0.98 ± 0.01 and 0.98 ± 0.00, respectively.
Table 4. Genetic (above diagonal) and phenotypic (below diagonal) correlation (±SE) among growth rate and KR in Harnali sheep

ADG1: Average daily gain from birth to 3 months of age; ADG2: Average daily gain from 3 months to 6 months of age; ADG3: Average daily gain from 6 months to 12 months of age; KR1: Kleiber ratio associated to ADG1; KR2: Kleiber ratio associated to ADG2; KR3: Kleiber ratio associated to ADG3.
Discussion
Average daily gain from birth to 3 months of age (ADG1)
For this trait, the maternal heritability was slightly more than direct heritability (0.07 vs. 0.06). This indicated that genes contributing to maternal performance had an equivalent effect on the early growth rate of lambs. Higher estimates of direct heritability (h2) for ADG1 were published by Savar-Sofla et al. (Reference Savar-Sofla, Nejati-Javaremi, Abbasi, Vaez-Torshizi and Chamani2011) in Moghani (0.21), Prakash et al. (Reference Prakash, Prince, Gowane and Arora2012) in Malpura (0.23), Ghafouri-Kesbi (Reference Ghafouri-Kesbi2013) in Mehraban (0.10), Mandal et al. (Reference Mandal, Karunakaran, Sharma, Baneh and Rout2015) in Muzaffarnagari (0.15), Singh et al. (Reference Singh, Pannu, Narula, Chopra, Naharwara and Bhakar2016) in Marwari (0.26), Jafari and Razzagzadeh (Reference Jafari and Razzagzadeh2016) in Makuie (0.20), Kumar et al. (Reference Kumar, Gangaraju, Kumar and Nath2018) and Illa et al. (Reference Illa, Gollamoori and Nath2019) in Nellore (0.20 and 0.37, respectively) and Mahala et al. (Reference Mahala, Saini, Kumar, Sharma and Gowane2020) in Avikalin sheep (0.48). Bangar et al. (Reference Bangar, Magotra and Yadav2020) reported 0.43 as estimate of direct heritability due to only direct effects of ADG1 in Harnali sheep. The h2 estimate reported by Gholizadeh and Ghafouri-Kesbi (Reference Gholizadeh and Ghafouri-Kesbi2017) in Baluchi sheep (0.03) and Bangar et al. (Reference Bangar, Lawar, Nimbalkar, Shinde and Nimase2018) in Deccani sheep (0.07) was in agreement with the present findings. Ghafouri-Kesbi (Reference Ghafouri-Kesbi2013), Jafari and Razzagzadeh (Reference Jafari and Razzagzadeh2016), Illa et al. (Reference Illa, Gollamoori and Nath2019) and Mahala et al. (Reference Mahala, Saini, Kumar, Sharma and Gowane2020) calculated higher estimates of maternal heritability (m2) for ADG1 (0.10, 0.16 and 0.11, respectively). Whereas Mokhtari et al. (Reference Mokhtari, Shahrebabak, Shahrebabk and Sadeghi2012) reported an equivalent value (0.07) in Arman sheep, Ghafouri-Kesbi et al. (Reference Ghafouri-Kesbi, Abbasi, Afraz, Babaei, Baneh and Abdollahi Arpanahi2011) reported lower maternal heritability (0.03) in Zandi sheep. The low level of additive variation and lesser estimates of h2 in comparison with m2 for ADG1 indicated the prominence of maternal and environmental effects for desired growth at initial the stage of age. Results suggested that early growth rate was predominantly influenced by maternal behaviour.
Average daily gain from 3 months to 6 months of age (ADG2)
Among all the models studied, models 3 and 6 showed higher estimates of Log-L values, in aspects of ADG2. Contrary trends between direct and maternal effects, due to negative covariance led to higher and negative estimates of ram and biased estimates of h2. Estimates of h2 under models 3 and 6 were exorbitant in comparison with models 1 and 2, which might be due to unrevealed effects of negative genetic covariance. Genetic covariance is restricted at higher negative magnitude, due to some concealed mechanism underlying the phenotypic relationship (Singh et al., Reference Singh, Pannu, Narula, Chopra, Naharwara and Bhakar2016). Therefore, we considered model 1 to be the most suitable in the present investigation, instead of model 3 or 6.
The estimate for h2 for ADG2 was in agreement with that reported by Prakash et al. (Reference Prakash, Prince, Gowane and Arora2012) and Singh et al. (Reference Singh, Pannu, Narula, Chopra, Naharwara and Bhakar2016) in Malpura and Marwari sheep, (0.13 and 0.16) respectively. Lower estimates were published by Savar-Sofla et al. (Reference Savar-Sofla, Nejati-Javaremi, Abbasi, Vaez-Torshizi and Chamani2011) in Moghani (0.02), Ghafouri-Kesbi (Reference Ghafouri-Kesbi2013) in Mehraban (0.11), Gholizadeh and Ghafouri-Kesbi (Reference Gholizadeh and Ghafouri-Kesbi2017) in Baluchi (0.11) and Bangar et al. (Reference Bangar, Magotra and Yadav2020) in Harnali sheep (0.02). Kumar et al. (Reference Kumar, Gangaraju, Kumar and Nath2018), Illa et al. (Reference Illa, Gollamoori and Nath2019) and Mahala et al. (Reference Mahala, Saini, Kumar, Sharma and Gowane2020) recorded higher estimates as 0.24, 0.34 and 0.53, respectively in Nellore and Avikalin sheep. However, Bangar et al. (Reference Bangar, Lawar, Nimbalkar, Shinde and Nimase2018) reported similar findings (0.14) in Deccani sheep. The h2 estimate observed for ADG2 in the present study was low in magnitude, therefore selection based on this trait provided lesser scope for genetic improvement.
Average daily gain from 6 months to 12 months of age (ADG3)
Very scant published literature is available for ADG from 6 months to 12 months of age. Higher h2 estimates were reported by Singh et al. (Reference Singh, Pannu, Narula, Chopra, Naharwara and Bhakar2016), Kumar et al. (Reference Kumar, Gangaraju, Kumar and Nath2018) and Mahala et al. (Reference Mahala, Saini, Kumar, Sharma and Gowane2020) in Marwari, Nellore and Avikalin sheep, (0.31, 0.17 and 0.34), respectively. Whereas, Bangar et al. (Reference Bangar, Magotra and Yadav2020) reported a lower estimate (0.001) in Harnali sheep.
Kleiber ratios from birth to 3 months of age (KR1)
By addition of the maternal additive genetic effect to the direct additive model, the log-likelihood value was found to be significantly changed and led to low to moderate estimates of h2 and m2 for KR1. The low-level estimate of direct effect (h2) was observed for this trait. Higher h2 estimates were reported by Prakash et al. (Reference Prakash, Prince, Gowane and Arora2012) in Malpura (0.20), Ghafouri-Kesbi (Reference Ghafouri-Kesbi2013) in Mehraban (0.13), Roshanfekr (Reference Roshanfekr2014) in Arabi (0.11), Mandal et al. (Reference Mandal, Karunakaran, Sharma, Baneh and Rout2015) in Muzaffarnagari (0.13), Jafari and Razzagzadeh (Reference Jafari and Razzagzadeh2016) in Makuie (0.20), Kumar et al. (Reference Kumar, Gangaraju, Kumar and Nath2018) and Illa et al. (Reference Illa, Gollamoori and Nath2019) in Nellore (0.25 and 0.48), Bangar et al. (Reference Bangar, Magotra and Yadav2020) in Harnali (0.38) and Mahala et al. (Reference Mahala, Saini, Kumar, Sharma and Gowane2020) in Avikalin breeds (0.54). The h2 estimate obtained in the present investigation agreed with those reported by Abegaz et al. (Reference Abegaz, van Wyk and Olivier2005) in Horro (0.09), Mohammadi et al. (Reference Mohammadi, Rashidi, Mokhtari and Nassiri2011) in Zandi (0.05), Mokhtari et al. (Reference Mokhtari, Shahrebabak, Shahrebabk and Sadeghi2012) in Arman (0.04) and Bangar et al. (Reference Bangar, Lawar, Nimbalkar, Shinde and Nimase2018) in Deccani sheep (0.04).
The significant influence of maternal effects on KR1 under model 2 was observed in this study, which was in accordance with m2 estimates reported by Ghafouri-Kesbi et al. (Reference Ghafouri-Kesbi, Abbasi, Afraz, Babaei, Baneh and Abdollahi Arpanahi2011) and Savar-Sofla et al. (Reference Savar-Sofla, Nejati-Javaremi, Abbasi, Vaez-Torshizi and Chamani2011) in Zandi and Moghani sheep (0.05). However, higher estimates 0.14, 0.24 and 0.21 were reported by Jafari and Razzagzadeh (Reference Jafari and Razzagzadeh2016), Illa et al. (Reference Illa, Gollamoori and Nath2019) and Mahala et al. (Reference Mahala, Saini, Kumar, Sharma and Gowane2020), respectively.
Kleiber ratios from 3 months to 6 months of age (KR2)
Similar to the KR1 trait, KR2 also influenced the direct additive effects and maternal genetic effects. This may be due to carry-over effects of maternal influence from the weaning period, which was also reported by Ghafouri-Kesbi (Reference Ghafouri-Kesbi2013). Our estimate of direct effects for KR2 was low in magnitude. However, lower h2 estimates than our estimate have been reported for various sheep breeds by Eskandarinasab et al. (Reference Eskandarinasab, Ghafouri-Kesbi and Abbasi2010) in Afshari (0.06), Mohammadi et al. (Reference Mohammadi, Rashidi, Mokhtari and Nassiri2011) in Zandi (0.01) and Bangar et al. (Reference Bangar, Magotra and Yadav2020) in Harnali (0.02) breeds. The present estimate was in agreement with that reported by Prakash et al. (Reference Prakash, Prince, Gowane and Arora2012) in Malpura (0.12), Ghafouri-Kesbi (Reference Ghafouri-Kesbi2013) in Mehraban (0.13) and Bangar et al. (Reference Bangar, Lawar, Nimbalkar, Shinde and Nimase2018) in Deccani (0.16). Whereas Kumar et al. (Reference Kumar, Gangaraju, Kumar and Nath2018) and Illa et al. (Reference Illa, Gollamoori and Nath2019) in Nellore sheep and Mahala et al. (Reference Mahala, Saini, Kumar, Sharma and Gowane2020) in Avikalin sheep reported significantly higher estimates (0.23, 0.37 and 0.53, respectively). The estimate for m2 for KR2 matched the findings of Savar-Sofla et al. (Reference Savar-Sofla, Nejati-Javaremi, Abbasi, Vaez-Torshizi and Chamani2011) and Ghafouri-Kesbi (Reference Ghafouri-Kesbi2013) (0.01 and 0.05, respectively). Whereas higher estimates were published by Illa et al. (Reference Illa, Gollamoori and Nath2019) in Nellore sheep and Mahala et al. (Reference Mahala, Saini, Kumar, Sharma and Gowane2020) in Avikalin sheep (0.11 and 0.16, respectively).
Kleiber ratios from 6 months to 12 months of age (KR3)
For KR3, only direct effects were sufficient to explain the genetic variation out of total variation. However, this estimate was found to be low for our resource population. Considerably higher h2 estimates were published by Kumar et al. (Reference Kumar, Gangaraju, Kumar and Nath2018) and Mahala et al. (Reference Mahala, Saini, Kumar, Sharma and Gowane2020) in Nellore (0.17) and Avikalin (0.39) sheep, respectively.
Our study was conducted using data from 1862 Harnali lambs for 21 years (1998 to 2018) and differed from that of Bangar et al. (Reference Bangar, Magotra and Yadav2020), who used data records of 526 Harnali lambs for 5 years (2014–2018) in the following points:
-
(1) We used a greater number of data records.
-
(2) The period of our study was longer.
-
(3) We observed significant maternal effects for ADG1, KR1 and KR2 compared with Bangar et al. (Reference Bangar, Magotra and Yadav2020) who reported only direct effects for ADG and KR traits.
-
(4) Direct heritability estimates for ADG1 and KR1 under our study were low in magnitude, and may be more precise due to the large sample size.
Correlation estimates
The range for genetic and phenotypic correlations was in accordance with that reported in the published literature by Ghafouri-Kesbi et al. (Reference Ghafouri-Kesbi, Abbasi, Afraz, Babaei, Baneh and Abdollahi Arpanahi2011) in Zandi, Savar-Sofla et al. (Reference Savar-Sofla, Nejati-Javaremi, Abbasi, Vaez-Torshizi and Chamani2011) in Moghani, Mokhtari et al. (Reference Mokhtari, Shahrebabak, Shahrebabk and Sadeghi2012) in Arman and Ghafouri-Kesbi (Reference Ghafouri-Kesbi2013) in Mehraban sheep. With advancement of age, estimates of genetic correlation usually decrease, but this trend was not perceived in our investigation. Similar findings were reported by Abegaz et al. (Reference Abegaz, van Wyk and Olivier2005), Ghafouri-Kesbi et al. (Reference Ghafouri-Kesbi, Abbasi, Afraz, Babaei, Baneh and Abdollahi Arpanahi2011) and Illa et al. (Reference Illa, Gollamoori and Nath2019) in Horro, Zandi and Nellore sheep breeds, respectively. Results for phenotypic correlation were in accordance with findings of Mandal et al. (Reference Mandal, Karunakaran, Sharma, Baneh and Rout2015) in Muzaffarnagari sheep and Illa et al. (Reference Illa, Gollamoori and Nath2019) in Nellore sheep.
In conclusion, we performed an evaluation of animal models that indicated the potential for direct and maternal effects on growth rate and KR in Harnali sheep. Direct effects were of a low range in magnitude for ADG and KR and indicated the unsuitability of these traits for inclusion in the selection programme. However, maternal effects showed significance for early growth rates and KR, and could be considered to improve the growth efficiency of lambs. It was also suggested that the inclusion of ADG and KR under a breeding plan could markedly diminish unneeded expenditure.
Acknowledgements
The authors are thankful to the Vice Chancellor of Lala Lajpat Rai University of Veterinary and Animal Sciences, Hisar, Haryana for providing the necessary facilities to conduct this research work.
Conflict of interest
The authors declare that they have no conflict of interest.
Financial support
This research received no specific grant from any funding agency, commercial or not-for-profit sectors.
Ethical approval
Not applicable


