Natural gas hydrate is an ice-like, cage-like crystalline compound composed of water and natural gas under medium- and high-pressure and low-temperature conditions. It is hailed as the most promising strategic resource in the 21st Century due to its high energy density, low combustion pollution and huge resources (Makogon et al. Reference Makogon, Holditch and Makogon2007; Zhang et al. Reference Zhang, Haiqi and Youhai2007). The formation of natural gas hydrates has three conditions: low temperature, high pressure and sufficient gas sources. The specific geological conditions of the Muri coalfield in Qinghai have created the inevitability and particularity of natural gas hydrate (Cao et al. Reference Cao, Tianji, Dan, Tong, Huaijun and Yulu2009, Reference Cao, Dan and Tong2010a, b; Zhu et al. Reference Zhu, Yongqin, Huaijun, Zhenquan and Pingkang2009). The main contribution of Jurassic coal measures of coal-bed methane to natural gas hydrate formation in the coalfield has been highly valued (Cao et al. Reference Cao, Tianji, Dan, Tong, Huaijun and Yulu2009, Reference Cao, Dan and Tong2010a, b; Lu et al. Reference Lu, Youhai, Yongqin, Huaijun, Yonghong, Zhiyao, Changling, Pingkang and Qingmei2010; Zhu et al. Reference Zhu, Yongqin, Huaijun, Zhenquan and Pingkang2010), but research on the temperature and pressure conditions of natural gas hydrate accumulation in the coalfield is very weak, and is limited to a small amount of qualitative analysis and simulations at individual points (Cao et al. Reference Cao, Dan and Tong2010a, Reference Cao, Hongbo and Junfeib; Lu et al. Reference Lu, Youhai, Yongqin, Huaijun, Yonghong, Zhiyao, Changling, Pingkang and Qingmei2010; Zhu et al. Reference Zhu, Yongqin, Huaijun, Zhenquan and Pingkang2010; Jin et al. Reference Jin, Dewu, Zhenquan, Youhai, Yongqin, Huaijun, Yonghong, Pingkang and Xia2011), as well as lacking the understanding of the spatial distribution of the temperature and pressure stability conditions of natural gas hydrates. Therefore, the systematic study of the natural gas hydrate stability zone has important reference value what is revealed is the development law of natural gas hydrate in the Muri coalfield and for the selection of exploration target areas.
The formation of natural gas hydrate is a process of three-phase equilibrium change of natural gas hydrate–water–gas. Scholars at home and abroad have studied the natural gas hydrate phase equilibrium conditions by using theoretical analysis and experimental methods, and established natural gas hydrate phases of different gas components. The gas hydrate was formed in a temperature-pressure stability zone of high strata pressure with the temperature being less than 10 °C. (Wang et al. Reference Wang, Li, Wei, Yang, Nie and Cao2020a, Reference Wang, Tao and Zeb)
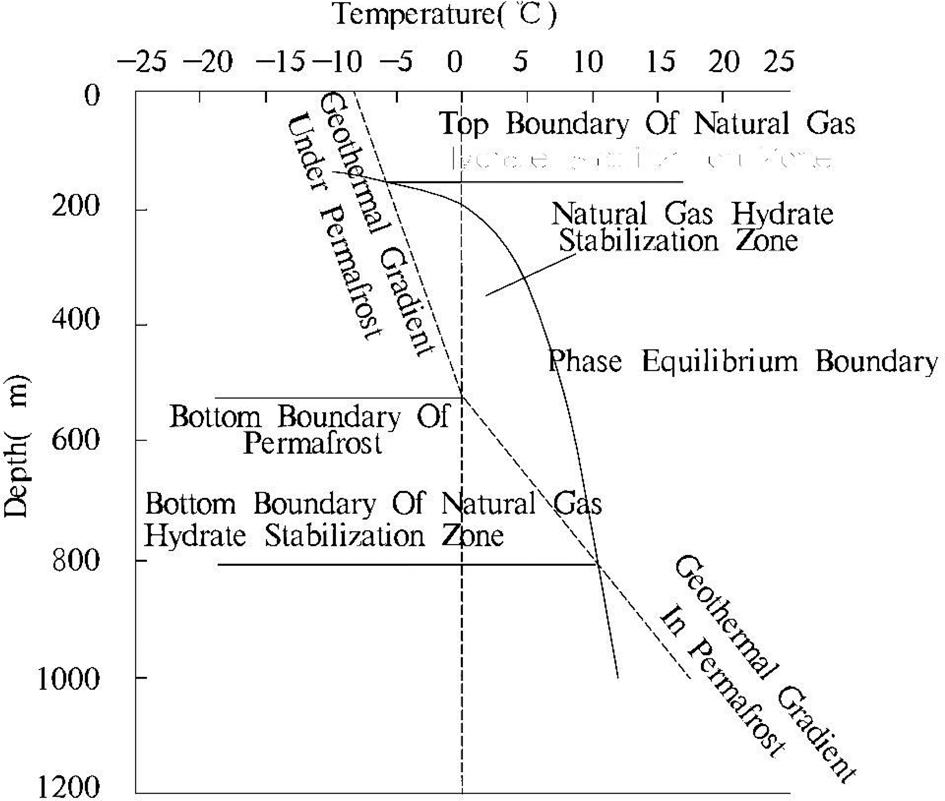
The natural gas hydrate stabilisation zone represents the maximum spatial range in which natural gas hydrates may exist, and is delimited by the temperature-pressure-phase equilibrium curve of natural gas hydrates and the curve of geothermal gradient (Fig. 1) (Sloan Reference Sloan1998; Milkov & Sassen Reference Milkov and Sassen2000; Graves et al. Reference Graves, James, Sapart, Stott, Wright, Berndt, Westbrook and Connelly2017). The temperature and pressure in the stabilisation zone are in the thermodynamic stability range of natural gas hydrate formation. Therefore, the stability zone is a necessary condition for the existence of natural gas hydrates (Graves et al. Reference Graves, James, Sapart, Stott, Wright, Berndt, Westbrook and Connelly2017; Liu et al. Reference Liu, Rui, Daidai, Guangrong and Hui2019; Chen et al. Reference Chen, Tie, Xiaofeng, Junbo and Di2020).

Figure 1 Model of gas hydrate stability zone of permafrost area (Sloan Reference Sloan1998).
The converted critical temperature and pressure relationship appears as a phase equilibrium curve in the temperature-pressure diagram (Grassmann et al. Reference Grassmann, Cramer, Delisle, Hantschel, Messner and Winsemann2010; Wang et al. Reference Wang, Jianzhong, Gao and Jun2018; Liu et al. Reference Liu, Rui, Daidai, Guangrong and Hui2019; Chen et al. Reference Chen, Tie, Xiaofeng, Junbo and Di2020). Considering only the hydrostatic pressure of the overlying stratum, the pressure parameter can be converted into the depth parameter. Therefore, the depth-temperature map can usually be used instead of the pressure-temperature map (Wang et al. Reference Wang, Haibin and Wen2005; Grassmann et al. Reference Grassmann, Cramer, Delisle, Hantschel, Messner and Winsemann2010; Wang et al. Reference Wang, Jianzhong, Gao and Jun2018; Xiao et al. Reference Liang, Tongbin, Zhongwei, Hengjie, Xianzhen and Jixian2018; Liu et al. Reference Liu, Rui, Daidai, Guangrong and Hui2019).
The ground temperature gradient is determined based on measured data or simulation experiments. In the permafrost region, the area defined by the boundary temperature between the surface temperature, the ground temperature gradient of the frozen soil layer, the temperature gradient under the frozen soil layer and the temperature and pressure of the natural gas hydrate, is the thermodynamically stable zone of the hydrate (grey area in Fig. 1), The natural gas hydrate stabilisation zone. The upper intersection of the geothermal gradient and the phase equilibrium boundary is the top boundary of the stability zone, the lower intersection is the bottom boundary of the stability zone and the stable zone between the two intersections is the theoretical gas hydrate formation interval.
1. Geological setting
1.1. Structural features of Muri coalfield
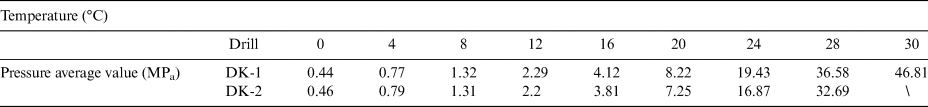
The Muri coalfield, located in the fold belt of the upper Datong River in Middle Qilian Mountain, is a narrow synclinorium with northwest by west. The fault structure in this area is highly developed, mainly including the thrust fracture in a NWW and EW direction. The coal-forming period in this coalfield is mainly in the Early and Middle Jurassic. Later, the N–S compression during the Yanshan and Himalayan orogeny occurred. The strata formed in the early stage were deformed by folds and the fault and thrust nappe developed. After the different degrees of incision and denudation, the coal-bearing strata gradually formed the current structural pattern of three zones in N–S direction and three sections in E–W direction (Fig. 2) (Wen et al. Reference Wen, Longyi, Yonghong, Jing, Shaolin, Wenlong and Man2011; Yang et al. Reference Yang, Qingping and Haikui2011).
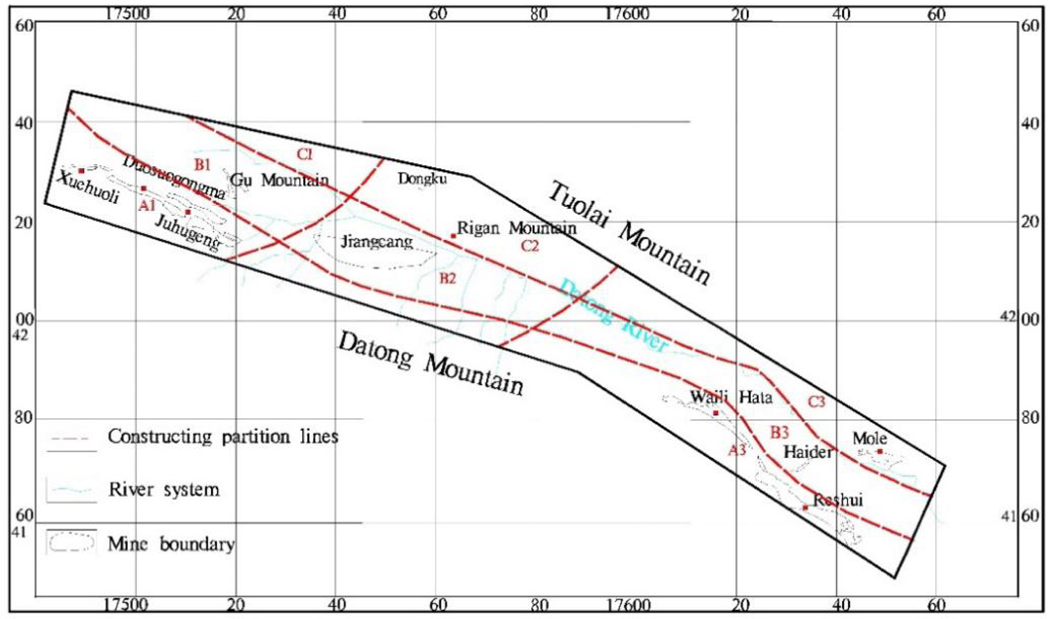
Figure 2 Tectonic division in Muri coalfield.
1.2. Coal-bearing strata in Muri coalfield
The Jurassic coal-bearing strata in Muri coalfield include the Reshui Formation in the upper Lower Jurassic (J1r), the Muri Formation in the lower Middle Jurassic (J2m) and the Jiangcang Formation in the upper Middle Jurassic (J2j). In addition, thin coal lines can be seen in the Upper Jurassic Xiangtang Formation. Among them, the Muri Formation and Jiangcang Formation are widely developed throughout the region; the coal seams in these strata are the primary minable seams (Cao et al. Reference Cao, Dan and Tong2010a, Reference Cao, Hongbo and Junfeib; Wen et al. Reference Wen, Longyi, Yonghong, Jing, Shaolin, Wenlong and Man2011; Yang et al. Reference Yang, Qingping and Haikui2011).
According to the exploration reports of various mining areas in Muri coalfield, some data can be sure as follow: for the average buried depth of the coalbed methane wind oxidation zone, it is 450 meters in the western mining area; it is 600 meters in the central mining area; it is 338 meters in Waili Hata mining area in the east; it is 400 meters in Haider and Mole mining areas. It should be noted that the effect of wind oxidation zone on coal seam should be ignored in the whole coal field.
1.3. Petrologic and lithologic combination features of coal-bearing series
The Muri coalfield experienced two phases of continental coal accumulation in the Early and Middle Jurassic, and the latter was the most prominent (Yang et al. Reference Yang, Qingping and Haikui2011). Clastic rocks have the highest content in the coal-bearing series, accounting for 78.26 %, followed by coal seams and oil shale, which account for 7.54 % and 14.20 %, respectively. From shallow to deep, the Muri Formation and the Jiangcang Formation were developed in the Middle Jurassic. The Muri Formation is dominated by dark-grey mudstone and carbonaceous mudstone, the fine sandstones and siltstones with coal seams are locally developed. The Jiangcang Formation is more diverse in lithology, including coal seams, fine sandstone, coarse sandstone and dark-grey mudstone, and black oil shale developed in the upper section with a greater thickness.
1.4. Coal quality and coal type
The transformation effect in the later stage of coal formation is more intense in Qinghai Province, with a greater regional difference. Due to the uneven influence of hype-zonal metamorphism and hydro-metamorphism, there are differences in coal rank and coal quality in different mining areas, and coking coal is the most developed. The metamorphic grade of coal in the Lower Jurassic Reshui Formation is very low, and R0max is generally less than 1 %. Most of the coal types are non-caking coal or weakly caking coal. The coal seams of the Muri Formation and Jiangcang Formation are mainly high metamorphic coal in the eastern mining area, including meagre coal and lean coal, and the R0max is above 1.4 % – the maximum can reach about 2.0 %. the R0max of coal seams in the Muri Formation in the mid-W mining area is about 1 %, and the R0max of coal seams in the Jiangcang Formation is less than 1 %; the coking coal takes the main position and gas coal and lean coal take a small amount. Lean coal is the main coal type in the north-western mining area.
2. Samples and calculation methods
2.1. Samples
In accordance with the data of 85 boreholes, the contour map of the burial depth of the bottom boundary of the natural gas hydrate stabilisation zone in Muri coalfield was prepared (Fig. 3). While, the buried depth at the top of the stability zone is mostly less than 100 m, the buried depth at the bottom of the stability zone can be approximately equal to the thickness of the stability. Therefore, the greater the burial depth at the bottom of the stable zone, the greater the range of natural gas hydrates that can be developed vertically, and the greater the possibility of accumulation.
Figure 3 Isogram of gas hydrate stability bottom depth in Muri coalfield.
In the central and eastern parts of the Xuehuoli Mining Area, and the middle of the Duosuogongma Mining Area and in the southern part of the Juhugeng Mining Area, contours of the burial depth at the bottom of the stable zone are all greater than 1500 m, which provides good conditions for the development of natural gas hydrates in a relatively concentrated range. Moreover, combined with the results of logging in this research area, the suspected gas hydrate layer is explained (results are in another article) (Li Jing et al. Reference Li, Daiyong, Xuqian and Dan2012). In the central and eastern part of the Duosuogongma Mining Area, the cumulative thickness of a single hole with suspected natural gas hydrates has been measured at more than 15 m, which may increase the success rate of exploration. In the E of Xuehuoli Mining Area, the distribution of the shallowest buried depth of a single hole of suspected natural gas hydrate shows that the shallowest buried depth is within a range of less than 200 m, which greatly reduces the difficulty of drilling and the investment. Both can be used as important reference areas for the natural gas hydrate exploration target area in Muri coalfield.
2.2. Calculation methods
2.2.1. Method for determination of gas composition
Gas composition is one of the important factors influencing the phase equilibrium conditions of natural gas hydrates. Sloan (Reference Sloan1998) studied the phase equilibrium temperature and pressure conditions of natural gas hydrates with different gas components, and developed a phase equilibrium curve calculation program (CSMHYD) (Sloan Reference Sloan1998). The calculation shows that the temperature and pressure conditions of pure methane hydrate are the most severe. When the natural gas hydrate contains heavy hydrocarbons, including ethane and propane, the phase equilibrium curve will shift to the right and the stability zone will be expanded – that is, the hydrate can be formed over a wider temperature and pressure range (Zhang et al. Reference Zhang, Xuezu and Wei2001, Reference Zhang, Wei and Wen2011; Chen et al. Reference Chen, Maochun and Bin2005; Chuai et al. Reference Chuai, Wang and Ning2019; Liu et al. Reference Liu, Rui, Daidai, Guangrong and Hui2019; Wang et al. Reference Wang, Li, Wei, Yang, Nie and Cao2020a, Reference Wang, Tao and Zeb).
2.2.2. Pressure-depth conversion
Taking only confining pressure into account, the relationship between pressure and depth of the frozen soil layer and its sedimentary layer should be calculated according to static rock pressure (Pf) and hydrostatic pressure (Ps), respectively (Grassmann et al. Reference Grassmann, Cramer, Delisle, Hantschel, Messner and Winsemann2010):
 $$P_f\,{\rm \;}{\rm} = {\rm \;}P_o{\rm \;}{\rm} + {\rm \;}\rho _fg\;h_f\;10^{{-}6}$$
 $$P_s{\rm \;}{\rm} = {\rm \;}P_f\,{\rm \;}{\rm} + {\rm \;}\rho _sg\;h_s\,10^{{-}6}$$
where Po is surface pressure (0.1 MPa); g is the gravitational acceleration constant (9.81 m s−2); pf is permafrost layer density (use 1750 kg m−3 while in calculation with the range of 1500–2000 kg m−3 obtained in the test); ρ s is pore fluid density under the frozen soil layer (1000 kg m−3); hf is depth in permafrost; and hs is depth of permafrost substratum (m).
2.2.3. Geothermal gradient
The temperature and depth inside and below the frozen soil layer can be expressed as (Sloan Reference Sloan1998; Chen et al. Reference Chen, Tie, Xiaofeng, Junbo and Di2020):
 $$t_f = t_o + G_f\;h_f$$
 $$t_s = t_f + G_s\;h_s$$
where tf is the temperature in permafrost at the depth of hf; to is surface temperature; Gf is geothermal gradient (°C/m); ts is temperature at depth hs below frozen soil; Gs is the geothermal gradient below frozen soil layer; and hs is depth from the bottom of the frozen soil (m).
2.2.4. Stability band calculation
By using the relevant parameter calculation formula and according to the measured component data of natural gas hydrates in the Muri area, the Microsoft Visual C++ programming language was used to program the geothermal gradient and bottom boundary burial depth of natural gas hydrates formula (Eqs 1–4) and the burial depth of the bottom boundary of natural gas hydrates was calculated by program simulation.
3. Results
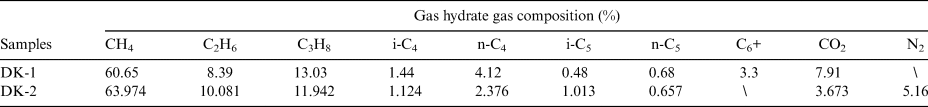
The limited test data of natural gas hydrate samples collected from DK-1 and DK-2 scientific exploration wells in Muri coalfield (Table 1) shows that natural gas hydrates in this area are low methane, high heavy hydrocarbon and complex gas components (Lu et al. Reference Lu, Youhai, Yongqin, Huaijun, Yonghong, Zhiyao, Changling, Pingkang and Qingmei2010; Zhu et al. Reference Zhu, Yongqin, Huaijun, Zhenquan and Pingkang2010). The feature is conducive to the formation of natural gas hydrates.
Table 1 Gas components of hydrate samples from drilling in Muri coalfield.
3.1. Phase equilibrium temperature and pressure conditions
Based on the gas component values of the natural gas hydrate samples (Table 1), the temperature and pressure conditions for gas hydrate formation were calculated using Sloan's CSMHYD program (Table 2), from which the phase equilibrium curves could be prepared. The comparison shows that there is no significant difference in phase equilibrium temperature and pressure conditions of gas hydrate components in the two scientific exploration wells.
Table 2 Temperature and pressure condition of gas hydrates formation with different gas components.

The thickness of the permafrost layer on the Qinghai-Tibet Plateau was 10–175 m. It was checked by T Actual = T Test (1 + δ), and, in the formula, δ is the reciprocal of T Test, which is the temperature correction increment obtained from boreholes with approximate steady-state temperature measurements in the area. Then, the approximate steady-state temperature measurement data were gained and the geothermal gradient (Table 3) was obtained after putting it into the Eqs 3 and 4. In the Table 3, the depth corresponding to the ground temperature of 0 °C is the bottom boundary depth of the frozen soil layer.
Table 3 Geothermal gradient and permafrost bottom depth in Muri coalfield.

4. Discussion
4.1. The stable zone of DK-1 scientific exploration well
The first natural gas hydrate sample was drilled in the DK-1 scientific exploration well located in the third open exploration area of Muli coalfield at an elevation of 4062 m. The bottom boundary depth of the permafrost layer was 95 m and the average ground temperature gradient under the permafrost layer was 2.586 °C/100 m. Based on parameters such as the gas components of the gas hydrate samples and the measured ground temperature in this borehole, the temperature and pressure conditions for the formation of gas hydrate were calculated by the temperature-pressure-phase equilibrium calculation program and the bottom boundary depth program, and the distribution of the gas hydrate stability zone in hole DK-1 was drawn (Fig. 4). Since the lower limit of the temperature reading of the simple temperature measuring device for drilling is 0 °C, and the internal temperature of the permafrost layer is recorded as 0 °C, the intersection line between the 0 °C line of the permafrost layer and the temperature-pressure-phase equilibrium boundary curve is approximated as the top boundary of the stability zone, and the burial depth of this point in hole DK-1 is 20 m. The intersection line between the temperature-pressure-phase equilibrium boundary curve and the ground temperature gradient line under the permafrost layer is the bottom boundary of the stability zone, and the burial depth is 925 m. The difference between the two intersection points is the thickness of the stability zone, 925 – 20 m = 905 m. The layer where the gas hydrate is drilled is only located at the top of the stability zone (shown by the thick black line in Fig. 4).
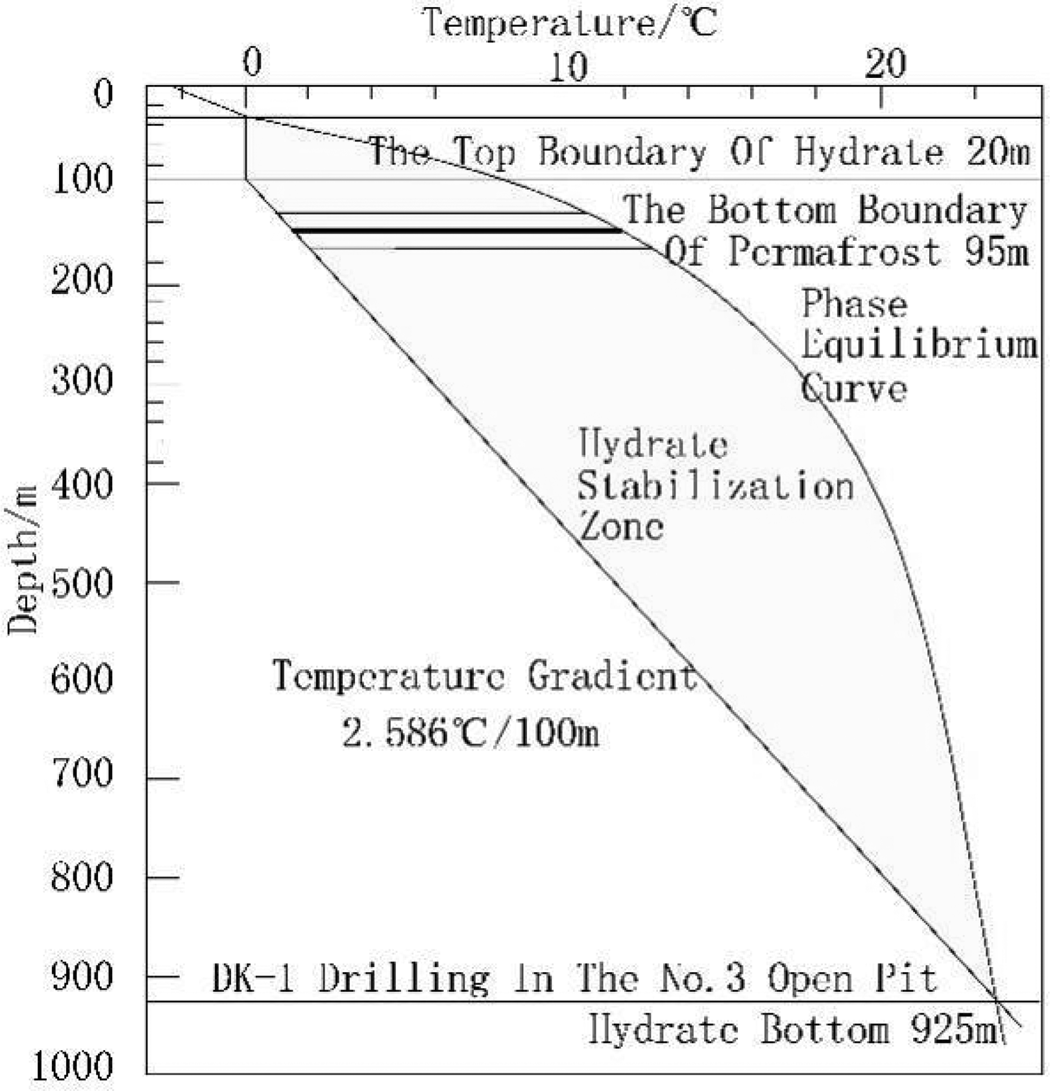
Figure 4 Gas hydrate stability zone region of DK-1 well in Muri coalfield.
4.2. Parameter statistics of drilling stability zone
The stability zone parameters based on DK-1 and DK-2 hydrate fraction values were calculated for each borehole based on the ground temperature gradient, depth to the bottom boundary of the permafrost layer, etc. (Table 3), which were corrected from the measured ground temperature data of each borehole (Table 4). The stability zone parameters based on the values of DK-1 and DK-2 hydrate components in each borehole were calculated (Table 4) based on the ground temperature gradient and the depth of the bottom boundary of the permafrost layer (Table 3). The statistical frequencies show that the bottom depth of the gas hydrate stability zone is concentrated in the range of 750–1500 m (Fig. 5). Since gas hydrates can only be developed in and under the permafrost layer, the physical samples of gas hydrates found so far are all located under the permafrost layer, and the average depth of the bottom boundary of the permafrost layer in the region is 80.8 m (Table 3), which roughly corresponds to the upper limit of gas hydrate deposits; therefore, the thickness of the gas hydrate stability zone in Muli coalfield is about 1000 m. At present, physical samples of natural gas hydrates have been obtained only at the stratigraphic depth of 133.5–165.5 m, and there is still much room for finding natural gas hydrates in this area from the perspective of temperature and pressure conditions of natural gas hydrate formation.
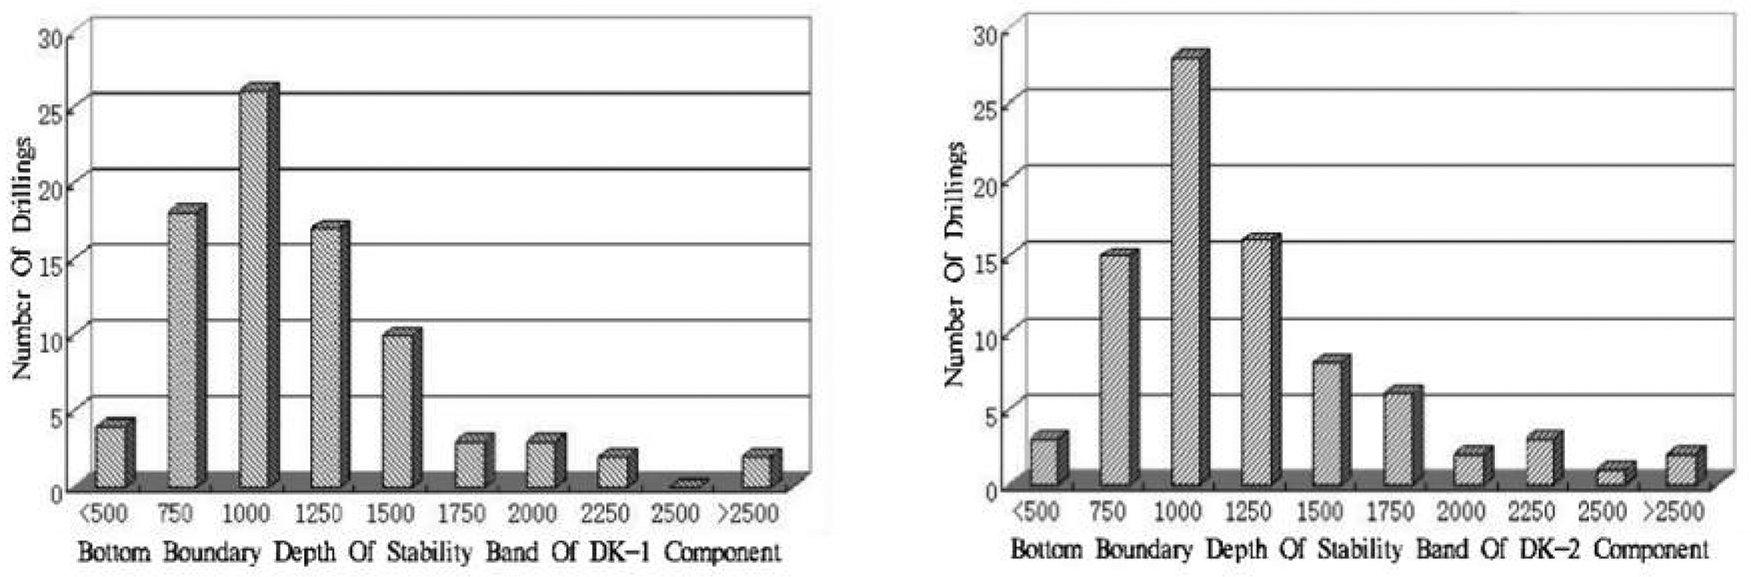
Figure 5 Bottom depth frequency histogram of gas hydrate stability zone in Muri coalfield.
Table 4 Bottom depth data of gas hydrate stability zone in Muri coalfield.

5. Conclusion
(1) The gas hydrate stability zone is mainly controlled by gas components, ground temperature gradient and thickness of multi-year permafrost layer. By collecting and processing temperature data from 85 boreholes in each mining area of Muli coalfield, the gas hydrate temperature and pressure stability zone parameters based on the gas component data of the physical gas hydrate samples in the area were obtained. The thickness of the gas hydrate stability zone in Muli coalfield is normally distributed, with an average thickness of about 1000 m, which indicates that the area has broad space for gas hydrate storage.
(2) The first contour map of the bottom boundary depth of the gas hydrate stabilisation zone in Muli coalfield was prepared, revealing the spatial distribution characteristics of the gas hydrate stabilisation zone. The gas hydrate stabilisation zones in the southern part of Juhugeng Mining Area, the central part of Duosuogongma Mining Area and the eastern part of Xuehuoli Mining Area are of large thickness and have good mineralisation conditions, and can thus be used as preferable target areas for resource exploration and evaluation.
6. Acknowledgements
This research was funded by the Youth Science and Technology Research Project of the Natural Science Foundation of Shanxi Province (201801D221355); the Doctoral Introduction Project of the College Natural Science Foundation of Shanxi Energy Engineering College (ZB-2018008); and the Natural Science Basic Research Project of Shaanxi Province (2019JQ-941).