Introduction
The delivery of a homogeneous high dose to the tumour region has been one of the cornerstones of radiotherapy (RT) treatment since its early days. According to the organ type and to cancer histology, different doses are required to inactivate malignant cells, thus stopping proliferation. However, radiation-induced cell killing is a stochastic process. Tumour control probability (TCP) models have been developed to assign a success rate to a given RT treatment. At the same time, there is a need to keep the risks of normal tissue toxicity at an acceptable level. Normal tissue complication probability (NTCP) models provide a means of doing this.Reference Tommasino, Nahum and Cella1
Intensity-modulated RT (IMRT) is an approach of delivering non-uniform radiation beam fluences to produce a uniform dose distribution that maximises dose-to-tumour volume while minimising dose-to-normal tissue and critical structures. To clinically implement such a treatment modality, three systems are needed: a treatment planning computer system that can calculate non-uniform fluence maps from multiple beam directions, a radiation delivery system capable of delivering such beam fluences, most often employed by a linear accelerator, and a quality assurance system to verify planned dose distributions. IMRT can generate dose distributions superior to 3D conformal treatments in several situations, including concave target volumes where multiple organs at risk (OARs) are close to the target volume, and for producing multiple dose levels in the target volume similar to boost therapy.Reference Khan2
IMRT can lead to improved conformity of the high-dose region to the tumour and requires more accurate delineation of both tumour and normal tissue than conventional RT. Additional normal tissue often has to be delineated because a tissue that is not specified can receive unexpected high doses. Patient positioning and localisation become even more important due to the reduced margins, which increase the risk of tumour miss. Furthermore, the true extent of disease and motion of delineated structures (both intra and inter fractions) cannot be fully accounted for using CT-based treatment plans. To mitigate the limitations in disease extent and motion, positron emission tomography (PET/CT) and treatment console station (4DTC; v.10, Varian, CA, USA) are often employed, respectively, within the treatment planning process.3
Through image-guided radiation therapy (IGRT) methods, the target and normal structures can be localised at the time of treatment to assure precise and accurate placement of the radiation, thereby pursuing highly conformal dose distributions, higher dose prescriptions and shorter fractionation schedules. IGRT techniques can substantially reduce geometric positioning errors that can occur between treatment planning and delivery. These include the reduction in ‘systematic’ errors that would otherwise persist over the entire course of therapy, as well as ‘random’ errors that vary from fraction to fraction.Reference Jaffray, Katja and Mageras4
The purpose of this work is to quantify the random and systematic errors by using an electronic portal imaging device (EPID) for setup accuracy to evaluate the adequacy of the imperial planning target volume (PTV) margin employed for IMRT for two different locations: head and neck (HN) cancer and prostate cancer. These two locations were selected due the local regional anatomy and their proximity to surrounding critical organs.
Uncertainties in the planning phase are influenced by patient setup, data acquisition, image registration, contouring and dosimetric planning. If present throughout the complete fractionation schedule, they become systematic errors. They can be omitted using appropriate wide margins and setting up control procedures. The uncertainties in the treatment in phase are influenced by patient setup, data acquisition for control, image registration and dose delivery. When restricted to a single fraction throughout the complete fractionation schedule they become random errors (often they called day-to-day variations).
This study was conducted to assess the setup errors for patients being treated with IMRT and to determine the optimal PTV margin specific to our centre.
Materials and Methods
Forty consecutive patients presenting with advanced tumours of the nasopharynx, oropharynx and hypopharynx and low-risk prostate cancer were randomly selected for this retrospective study. All patients were treated in an RT department of a university hospital with IMRT.
In this study, the position for HN patients was immobilisation in the supine position using a thermoplastic mask attached at five fixation points to a carbon-fibre plate support (CIVCO Radiotherapy Coralville, IA, USA). For prostate cases, immobilisation was achieved using knee and foot support as immobilisation device. The urologist places three fiducial markers around the prostate before the CT scan. CT simulation was performed in 3-mm slices using Siemens Somatom Sensation Open CT (Siemens, Erlangen, Germany). Target volumes and OARs were delineated using Varian SOMAVISION Focal workstations v.10.0.28 (Varian). Radiation fields were simulated and optical field projection was marked on the thermoplastic mould for subsequent positioning and treatment. The anterior, left lateral, right lateral and posterior simulator images were transferred to DICOM (Digital Imaging and Communications in Medicine) (4DTC; v.10, Varian). These served as reference images for comparison with images taken by the EPID.Reference Tejpal, Supriya and Avinash5
Treatment position verification using EPID to measure setup errors is accepted in standard practice.Reference Langmack6 Digitally reconstructed radiographs (DRR) of the treatment fields were used as reference images. DRRs were imported from the treatment planning station (Eclipse v.10) to the treatment machine and compared online on the 4DTC screen or offline (Offline Review program v.10) with the EPID protocol as detailed in this section.
Our objective was to evaluate EPID images for each patient. Four images (anterior, left lateral, right lateral and posterior) were performed for the setup fields on day 1 and two images (anterior, left lateral or right lateral) on day 2. After that, two images (anterior and lateral) were performed weekly.
For treatment planning and delivery technique, Varian Clinac 2300 DHX (Varian Medical System, CA, USA), a linear accelerator equipped with an 80-leaf dynamic multileaf collimator, was used. Clinac 2300 DHX was equipped with an MV EPID for the image system. Treatment techniques used in this study were IMRT. Eclipse 10 (Varian Medical System) was used as the treatment planning system (TPS). Radiation was delivered to the tumour at a dose rate of 400 MU/min with a photon energy of 6 MV.
Evaluation protocol was an offline review procedure. Images were evaluated by two observers on the same day independently. The Offline Review program was used for EPID evaluation. DRR images were compared to the EPID, and differences between EPID and DRR using bony landmarks (HN and prostate) and fiducial markers (prostate) were measured for each direction: lateral (X), cranio-caudal (Y), antero-posterior (Z). If the difference in the measurements between the two observers was <3 mm, the larger measurement was taken into account. However, if the difference was >3 mm, the mean of the two measurements was taken.Reference Evrim, OZlem, Münir and Fadime7
In this study, we aimed to calculate and analyse PTV margins from the clinical target volume (CTV), and a formula was used to analyse setup errors for random (σ) and systematic (Σ) errors in the patient setup correction:
-
To determine setup margin, ICRU 628 recommends the quadratic combination of random and systematic errors as shown in Equation (1):
(1) $${\rm{ICRU }}\,62\,{\rm{ formula }} = \,\sqrt {{\sum ^2}\, + \,{\sigma ^2}}$$

The margin recipes of Stroom et al.Reference Stroom, de Boer and Huizenga9 assumed a 95% dose to 99% of the CTV on average based on tests of realistic plans as shown in Equation (2):
 $${\rm{Stroom}}\,{\rm{et \ al}}{\rm{.\sigma s}}\,{\rm{formula}}\,{\rm{ = }}\,{\rm{2}}\sum \,{\rm{ + }}\,{\rm{0}}\! \cdot \!{\rm{7\sigma }}$$
The margin recipes of Parker et al.Reference Parker, Shiu and Maor10 assumed a 95% minimum dose and 100% dose for 95% of the volume. Probability levels were not specified as shown in Equation (3):
 $${\rm{Parker\, et \ al}}{\rm{.}}\,{\rm{ \sigma s}}\,{\rm{formula}}\,{\rm{ = }}\,\sum \,{\rm{ + }}\,\sqrt {{\sum ^2}\, + \,{{\rm{\sigma }}^2}}$$
-
Van Herk et al.Reference Van Herk, Remeijer, Rasch and Lebesque11 assumed minimum dose to CTV to be 95% for 90% of patients. Analytical solution for a perfect conformation is shown in Equation (4):
(4)
$${\rm{Van}}{\mkern 1mu} {\rm{Herk}}{\mkern 1mu} {\rm{et}}{\mkern 1mu} {\rm{al}}.\sigma {\rm{s}}{\mkern 1mu} {\rm{formula}}{\mkern 1mu} = {\mkern 1mu} 2,5{\mkern 1mu} \sum {\mkern 1mu} + {\mkern 1mu} {\rm{0}} \cdot {\rm{7}}\sigma {\mkern 1mu} $$

Van Herk et al.Reference Van Herk12 assumed a Monte-Carlo-based test of 1% TCP loss due to geometric errors for the prostate. Their formula is defined as:
 $${\rm{Van}}{\mkern 1mu} {\rm{Herk}}{\mkern 1mu} {\rm{et}}{\mkern 1mu} {\rm{al}}.\sigma {\rm{s}}{\mkern 1mu} {\rm{formula}}{\mkern 1mu} = {\mkern 1mu} 2,5{\mkern 1mu} \sum {\mkern 1mu} + {\mkern 1mu} {\rm{0}} \cdot {\rm{7}}\sigma {\rm{ - 3}}{\mkern 1mu} {\rm{mm}}$$
Results
Seven hundred twenty images were analysed for HN and prostate cancers, and setup uncertainty was calculated aligning the setup images relatively to DRR images. The mean displacement in X, Y and Z directions was 0·73, 0·43 and 0·08 mm for HN and 0·16, 0·11 and 0·27 mm for prostate.
As shown in Figure 1, displacements of PTV in patients who had an HN immobilisation system tended to be localised in a small area offset from the centre (systematic error), but with a certain dispersion (random error), and a large deviation occurred in patients with prostate cancer who used a knee and ankle support as an immobilisation device.

Figure 1. Displacement of patients along the X, Y and Z axes for HN and prostate cases.
This variation in mean displacement may be explained by several reasons, first by the variation in patient positioning and mechanical uncertainties of the equipment. Another cause may be the patient’s marking procedures, which are performed with a permanent marker whose thickness could lead to the radiation therapist to have some uncertainty in positioning the patient daily.
Figures 2 and 3 indicate the setup variations with means and standard deviations (SD) in X, Y and Z dimensions for the 40 patients under both HN and prostate treatment.

Figure 2. Mean with error bars showing an SD of individual patient setup error along the lateral (X), cranio-caudal (Y) and anterior-posterior (Z) directions for 20 patients of the HN site.

Figure 3. Mean with error bars showing an SD of individual patient setup error along the lateral (X), cranio-caudal (Y) and anterior-posterior (Z) directions for 20 patients of the prostate site.
After the calculation of mean displacement, we calculated systematic and random setup uncertainties for each location as shown in Table 1.
Table 1. Systematic error (Σ) and random error (σ) for HN and prostate sites

PTV margins were calculated for HN and prostate using ICRU Report 62, Stroom’s, Parker’s and Van Herk’s formulas (Table 2). This margin in the X, Y and Z directions was 1·91, 2·16 and 2·11 mm, respectively. The corresponding values were 3·61, 3·93 and 4·00 mm with Stroom’s formula; 3·78, 3·84 and 3·92 mm with Parker formula; and 4·27, 4·62 and 4·74 mm with Van Herk’s formula. On the other hand, the results of prostate were calculated and presented in the same order: 3·73, 3·17 and 3·34 mm for ICRU Report 62 formula; 7·02, 5·75 and 6·80 mm with Stroom’s formula; 5·02, 4·47 and 5·18 mm with Parker formula; and 8·31, 6·76 and 8·17 mm with Van Herk’s formula.
Table 2. CTV–PTV margins (mm) using different formulas: ICRU 62, Stroom, Parker and Van Herk

Discussion
Optimal IMRT requires more accurate delineation of both tumour and normal tissues compared with conventional RT because of the resulting steeper absorbed dose gradients, and PTV margin determination is crucial to control the dose in normal tissues, which might cause unacceptable complications.
This work evaluated the setup accuracy in patients receiving IMRT for HN and prostate cancer using EPID. We found the PTV margin around CTV to be ranging between 2–4·3, 2·2–4·6 and 2·1–4·7 mm in X, Y and Z directions, respectively, for HN cases. Similarly, the prostate site was 3·7–8·3, 3·2–6·8 and 3·3–8·2 mm in X, Y and Z directions, respectively. At our centre, a margin of 10 mm is currently used for prostate cancer and 5 mm for HN location in all directions.
All these results are similar with other studies,Reference Bel, Keus, Vijlbrief and Lebesque13,Reference de Boer, de Koste and Creutzberg14 although there are differences between tumour location, OAR volume, RT indication (adjuvant/radical) and immobilisation systems.
Table 2 summarises the margins found using the various formulas quoted above, suggesting that the values using the ICRU formula are the lowest for the three directions (X, Y and Z) for HN and prostate. In contrast, the Van Herk formula gives a fairly broad margin, allowing a better TCP.Reference Van Herk, Remeijer and Lebesque15
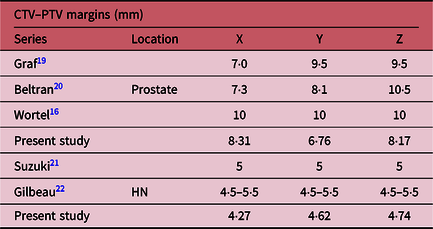
For the prostate, Wortel et al.Reference Wortel, Incrocci and Pos16 estimated a margin at 10 mm, whereas we found the value lying between those reported in Table 3. In addition, the lowest values of Y and Z are those reported by this study. Margins do not differ significantly in the case of HN.
Table 3. Results of applying Van Herk formula on HN and prostate CTV–PTV margins for some studies compared with our study

Also in Perera et al.’s trial, this was <5 mm for HN,Reference Perera, Moseley and Munro17 and Skarsgard et al. found a margin of ∼10 mm for prostate.Reference Skarsgard, Cadman and El-Gayed18 Likewise, it has been postulatedReference Van Herk, Remeijer and Lebesque15 that TCP does not decrease significantly when reducing margins. However, a further reduction below 10 mm may result in a marked decrease in TCP. Hence, the use of 10 mm margin, rather than those calculated, will allow a reduction in dose to critical structures while maintaining an acceptable TCP.
The results of previous worksReference Wortel, Incrocci and Pos16,Reference Graf, Wust, Budach and Boehmer19–Reference Gilbeau, Octave-Prignot and Loncol22 are comparable to those reported in our study. In contrast, the estimated values of Y and Z are, on average, lower than those found by the works cited in Table 3. The implications of this study on our practice are to ensure better coverage of target volumes. We adopted a PTV margin of 5 mm for HN PTVs and 10 mm for prostate PTVs in our department.
Limitations of the Study
Our results can serve as a good estimate of the appropriate margin to be taken and will contribute to the optimisation of treatments for HN and prostate cancers using the equipment available in our department. In addition, these results can be improved by a CT-based clinical assessment at the time of dose volume histogram analysis, based on accurate dose calculations. This study does not deal with rotations or pitch. Prostate deformation or evaluation of volume reductions was not included. Currently, in our institution, EPID and DRR images are manually matched. This may result in low variability by observers, but staffs are trained in the use of common stable anatomical points, and all disagreements are averaged and should generally not exceed 0·1 mm.
Future studies involving a larger population of patients would allow for better variety and, therefore, a more accurate representation of a given population.
Conclusion
The present investigation focused on evaluating the setup accuracy of patients treated for HN and prostate cancers by IMRT. Results were compared with similar published studies. We found that margins found by using the Van Herk formula were close to those adopted at our centre (5 mm for HN and 10 mm for prostate), permitting a good compromise between the margins and TCP to ensure that a correct radiation dose is delivered to the tumour by IMRT.
Thus, weekly setup verifications that use EPID are very useful for evaluating setup uncertainties and determining setup margins for HN and prostate cancers.
Acknowledgement
The work was performed as part of a PhD thesis at Mohammed V University in Rabat.
M A. Youssoufi and M. Bougtib are PhD students and works as medical physicists in the radiotherapy department at the University hospital Hassan II in Fes.
Financial Support
This research received no specific grant from any funding agency, commercial or not-for-profit sectors.
Conflict of interest
None.
Ethical Standards
No experimental study was done on human and/or animal. Dosimetric data were collected, processed and interpreted for manuscript preparation.