


Introduction
Ammonia (NH3) is an important component in the atmosphere that arises from both natural and anthropogenic sources (Bouwman et al. Reference Bouwman, Lee, Asman, Dentener, van Der Hoek and Oliver1997, Sutton et al. Reference Sutton, Dragosits, Tang and Fowler2000, Blackall et al. Reference Blackall, Wilson, Bull, Theoblad, Bacon, Hamer, Wanless and Sutton2008). It plays a significant role in the nitrogen (N) cycle, having important environmental consequences in many ecosystems (Fangmeier et al. Reference Fangmeier, Hadwinger-Fangmeier, van der Eerden and Jäger1994, Bouwman et al. Reference Bouwman, van Vuuren, Derwent and Posch2002). Ammonia emissions from anthropogenic sources include domestic animals, synthetic fertilizers, sewage treatment, industry and transport (Bouwman et al. Reference Bouwman, Lee, Asman, Dentener, van Der Hoek and Oliver1997, Aneja et al. Reference Aneja, Chauhan and Walker2000, Blunden & Aneja Reference Blunden and Aneja2008) and in recent years, NH3 emissions from large wild animal colonies have been observed (Wilson et al. Reference Wilson, Bacon, Bull, Dragosits, Blackall, Dunn, Hamer, Sutton and Wanless2004, Theobald et al. Reference Theobald, Crittenden, Hunt, Tang, Dragosits and Sutton2006, Blackall et al. Reference Blackall, Wilson, Theobald, Milford, Nemitz, Jennifer, Philip, Keith, Sarah and Mark2007, Reference Blackall, Wilson, Bull, Theoblad, Bacon, Hamer, Wanless and Sutton2008), indicating that they are a significant natural source of atmospheric NH3. However, the magnitude and location of natural NH3 sources have received little attention and the estimates that have been made are extremely uncertain (Bouwman et al. Reference Bouwman, Lee, Asman, Dentener, van Der Hoek and Oliver1997, Sutton et al. Reference Sutton, Dragosits, Tang and Fowler2000, Blackall et al. Reference Blackall, Wilson, Theobald, Milford, Nemitz, Jennifer, Philip, Keith, Sarah and Mark2007).
In coastal Antarctica, the ice-free areas are colonized by marine animals such as penguins and seals, and vegetation such as mosses, lichens and algae. Marine animal colonies, vegetation and their interactions form a special tundra ecosystem (Tatur et al. Reference Tatur, Myrcha and Niegodzisz1997, Tatur & Myrcha Reference Tatur and Myrcha2002, Sun et al. Reference Sun, Zhu, Yin, Liu, Xie and Wang2004b). Every year a large amount of penguin guano is deposited into terrestrial ecosystems, which leads to the formation of ornithogenic soils (Ugolini Reference Ugolini1970, Campbell & Claridge Reference Campbell and Claridge1987, Tatur Reference Tatur1989, Bockheim & Ugolini Reference Bockheim and Ugolini1990, Michel et al. Reference Michel, Schaefer, Dias, Simas, Benites and Mendonça2006, Schaefer et al. Reference Schaefer, Simas, Gilkes, Mathison, da Costa and Albuquerque2008), which are particularly rich in organic carbon, nitrogen and phosphorus and show large variations in pH (Speir & Cowling Reference Speir and Cowling1984, Heine & Speir Reference Heine and Speir1989, Simas et al. Reference Simas, Schaefer, Melo, Albuquerque-Filho, Michel, Pereira, Gomes and Da Costa2007, Reference Simas, Schaefer, Filho, Francelino, Filho and da Costa2008, Schaefer et al. Reference Schaefer, Simas, Gilkes, Mathison, da Costa and Albuquerque2008, Cannone et al. Reference Cannone, Wagner, Hubberten and Guglielmin2008). Ornithogenic soils on Antarctic islands have been studied in Admiralty Bay, King George Island (Tatur Reference Tatur1989, Tatur et al. Reference Tatur, Myrcha and Niegodzisz1997, Tscherko et al. Reference Tscherko, Boelter, Beyer, Chen, Elster, Kandeler, Kuhn and Blume2003, Simas et al. Reference Simas, Schaefer, Filho, Francelino, Filho and da Costa2008) and from elsewhere (Simas et al. Reference Simas, Schaefer, Melo, Albuquerque-Filho, Michel, Pereira, Gomes and Da Costa2007). Continental ornithogenic soils have been studied mostly on and around Ross Island (Speir & Cowling Reference Speir and Cowling1984, Speir & Ross Reference Speir and Ross1984, Ramsay & Stannard Reference Ramsay and Stannard1986, Heine & Speir Reference Heine and Speir1989, Porazinska et al. Reference Porazinska, Wall and Virginia2002) with some research conducted along the northern Victoria Land coast, including Cape Hallett (Hofstee et al. Reference Hofstee, Balks, Petchey and Campbell2006) and near Casey Station (Beyer & Bölter Reference Beyer and Bölter2000). Despite the limited geographical distribution of penguin guano and ornithogenic soils, they are the most important N reservoir in Antarctic terrestrial ecosystems (Simas et al. Reference Simas, Schaefer, Melo, Albuquerque-Filho, Michel, Pereira, Gomes and Da Costa2007).
The isotopic analyses of ornithogenic soils in the vicinity of penguin colonies also point to the importance of NH3 volatilization from the guano (Wada et al. Reference Wada, Shibata and Torii1981, Mizutani & Wada Reference Mizutani and Wada1988). Seabird excretal mass budgets have implied volatilization rates of up to 90% of total excreted nitrogen as NH3 in penguin colonies (Lindeboom Reference Lindeboom1984). It was estimated that Antarctic seabirds (with penguins as the dominant group) emit about 129.6 Gg NH3 yr-1, corresponding to 53.6% of estimated total global seabird emissions (Blackall et al. Reference Blackall, Wilson, Theobald, Milford, Nemitz, Jennifer, Philip, Keith, Sarah and Mark2007). Investigations of other trace gas (e.g. methane, nitrous oxide and phosphine) emissions from marine animal colonies through field observation or laboratory incubation experiments (Sun et al. Reference Sun, Zhu, Xie and Xing2002, Zhu et al. Reference Zhu, Liu, Xu, Ma, Zhao and Sun2008, Reference Zhu, Liu, Ma, Sun, Xu and Sun2009), indicate that environmental factors have an important effect on gas emissions.
Field measurements of NH3 emissions from marine animal colonies are still scarce in coastal Antarctica because of the major experimental difficulties involved. However, laboratory experiments can provide an important step in elucidating the processes involved. In this study, we used penguin guano, ornithogenic soil and soil from a seal colony in laboratory experiments to 1) quantify potential NH3 emission rates, 2) investigate the effects of freezing-thawing cycles (FTCs), soil chemical properties, temperature, pH and moisture on NH3 fluxes, and 3) establish the quantitative relationships between NH3 fluxes and environmental factors.
Materials and methods
Study areas
Gardner Island (68°34′S, 77°52′E), Magnetic Island (68°32′S, 77°54′E) and Long Peninsula (68°28.37′S, 78°8.82′E) in the Vestfold Hills, East Antarctica (Fig. 1) have a cold, dry and windy climate. Air temperatures are below 0°C for most of the year, summer temperatures rise as high as +13°C and winter temperatures drop to as low as -40°C (Seppelt et al. Reference Seppelt, Broady, Pickard and Adamson1988). Gardner Island, Magnetic Island and north Rookery Coast of Long Peninsula have three important Adélie penguin (Pygoscelis adeliae (Hombron & Jacquinot)) colonies with 22 180, 17 184 and 6445 estimated numbers of breeding pairs respectively (Whitehead & Johnstone Reference Whitehead and Johnstone1990). During CHINARE-22 in 2006, one penguin guano profile (APG1) and two ornithogenic soil cores (OSDG2 and OSDG4) were sampled from Gardner Island, one ornithogenic soil profile (OSDM1) from Magnetic Island, and one penguin guano profile (APG2) was collected from Long Peninsula.

Fig. 1 Sampling sites for penguin guano, ornithogenic soils and seal colony soils in coastal Antarctica. East Antarctica: OSDG2 and OSDG4 = ornithogenic soil core sites in Adélie penguin colony on Gardner Island, APG1 and APG2 = Adélie penguin guano sites on Gardner Island and Long Peninsula, respectively, OSDM1 = ornithogenic soil profile site in Adélie penguin colony on Magnetic Island, EPG1 and EPG2 = emperor penguin guano sites, OSEP2 = ornithogenic soil profile sites in emperor penguin colony. West Antarctica: SCS = seal colony soil sites on Fildes Peninsula.
The emperor penguin colony of Amanda Bay (69°22′S, 76°24′E) has about 10 000 birds (Zhu et al. Reference Zhu, Liu, Ma, Sun, Xu and Sun2009). Two emperor penguin guano samples (EPG1 and EPG2) and one ornithogenic soil profile (OSEP2) were collected in this colony.
Fildes Peninsula, West Antarctica (61°51′–62°15′S, 57°30′–59°10′W) lies in the south-west of King George Island, in the maritime Antarctica (Fig. 1). This area has a more oceanic climate with a mean annual temperature c. -2.5°C, and a range from -26.6 to 11.7°C. Mean annual precipitation, mainly in the form of snow, is 630 mm, evenly distributed throughout the year. The western coast of this peninsula has over 10 700 seals each summer, mainly elephant seals (Mirounga leonine (L.)) and fur seals (Arctocephalus gazella (Peters)). During the moulting and breeding period each summer, their excreta and hairs are deposited into tundra soils or catchments by snowmelt water (Sun et al. Reference Sun, Liu, Yin, Zhu, Xie and Wang2004a). One soil core with seal excreta (SCS) was collected in this colony.
All sites are covered by snow during winter, freezing marine animal excreta and the underlying soils until snowmelt in spring/summer after which freeze-thaw cycles are a frequent occurrence.
Collection and sampling storage
Penguin guano (EPG1, EPG2, APG1 and APG2) and ornithogenic soil (OSDM1 and OSEP2) were collected from different penguin colonies by in situ sectioning the accumulative guano or soil layer by layer from top to bottom using a bamboo scoop. The soil cores OSDG2 and OSDG4 (10 cm inner diameter, 62 cm and 80 cm long, respectively) were sampled by hammering the PVC tubes vertically into the soils and then digging them out (Sun et al. Reference Sun, Liu, Yin, Zhu, Xie and Wang2004a). The soil core SCS (6 cm inner diameter, 30 cm long) was obtained in the same way. These samples were completely sealed, and transported at -10°C to the laboratory in China for the experiments.
Experimental design and NH3 flux measurements
NH3 fluxes were determined using a continuous airflow enclosure chamber method (Fig. 2) (Kissel et al. Reference Kissel, Brewer and Arkin1977, Tian et al. Reference Tian, Cao, Cai and Ren1998, Chadwick Reference Chadwick2005, Nyord et al. Reference Nyord, Schelde, Søgaard, Jensen and Sommer2008) in four experiments:

Fig. 2 Flow diagram for the measurements of NH3 fluxes from penguin guano, ornithogenic soils and seal colony soils.
Experiment I: effects of freezing-thawing cycles (FTCs) on NH3 fluxes
Samples EPG1, APG1 and SCS were homogeneously mixed and then divided into three parts (about 50 g for each sample), to form the three replicates for freeze-thaw experiments. These were put into glass vessels (250 ml) and frozen for 12 h at -10°C, after which thawing started at 4°C (close to summer mean air temperature at the sampling sites). The thawing period was 8 h during each FTC for each sample. During the FTCs, the headspace gases were continuously removed by the airflow from a steel flask filled with a gas mixture of pure nitrogen and oxygen. Since airflow velocity can influence NH3 volatilization, the airflow rate was controlled at about 3.0 m s-1 (about 14.0 litres per minute, close to the average wind velocity at sampling sites). The NH3 emitted was trapped by 2% H3BO3 solution (Fig. 2) and determined every 2 h by 0.01 mol l-1 HCl titration using methyl red-bromocresol green as the indicator (Tian et al. Reference Tian, Cao, Cai and Ren1998). The detection limit for this method was 1 mg NH3 kg-1 h-1 and if NH3 emission was lower we used the ionic selection electrode to measure ammonium in the H3BO3 solution (Chadwick Reference Chadwick2005, Nyord et al. Reference Nyord, Schelde, Søgaard, Jensen and Sommer2008). The detection limit for this method was 0.1 mg NH3 kg-1 h-1 but it is very slow compared to the titration method. Three replicates were made for each freezing-thawing treatment and the number of FTCs for each sample depended on NH3 emission rates. Penguin guano EPG1 and APG1 showed continuous, high NH3 emissions, and the fluxes were measured during six and five FTCs, respectively, whereas the fluxes from seal colony soil SCS were measured during only three FTCs due to very low emission rates.
Experiment II: effects of soil depth and chemical properties on potential NH3 emissions
The soil profiles OSEP2, OSDG2 and OSDG4 were sectioned at 1 cm intervals. We selected 1 cm, 3 cm, 6 cm, 9 cm, 11 cm, 14 cm soil from OSEP2, 1 cm, 6 cm, 10 cm, 16 cm, 22 cm, 30 cm, 36 cm, 42 cm, 50 cm, 56 cm, 59 cm, 61 cm soil from OSDG2 and 1 cm, 8 cm, 15 cm, 22 cm, 27 cm, 29 cm, 36 cm, 43 cm, 50 cm, 57 cm, 65 cm, 76 cm soil from OSDG4 to measure potential NH3 fluxes from different depths of ornithogenic soils using the method described for experiment I.
Experiment III: effects of temperature on NH3 fluxes
Different depths of the soils were homogeneously mixed from the cores OSDG2 and OSDG4, to examine the effects of temperature on mean NH3 fluxes from ornithogenic soil profiles. Using 50 g samples the experimental temperature started at 4°C, and then increased 2–3°C every hour until close to 30°C. The low limit of 4°C was very close to the local average ground temperature.
Experiment IV: effects of water content on NH3 fluxes
Penguin guano EPG2 and APG2 and soil profiles OSDM1 and OSEP2 were homogeneously mixed. A total of 0, 10, 15 and 20 ml deionized water were added to 50 g samples and NH3 fluxes measured each day five or six times.
Calculation of NH3 emission rates
The NH3 fluxes (mg NH3 kg-1 h-1) can be calculated according to the following formula:
Where VHCl is the HCl volume (l), CHCl is the HCl concentration (mol l-1), 17 is the formula weight of NH3 (g mol-1), MS is the sample mass (kg) and t is the time (h). The cumulative flux was calculated by integrating the fluxes over the incubation period of 8 h from the beginning of each thawing. The specific NH3-N loss rates from penguin guano and ornithogenic soils were obtained through NH3-N divided by total nitrogen.
Analyses of physical and chemical properties for the samples
All the samples were separated from the profiles or soil cores, and mixed homogeneously. Soil gravimetric moisture content (MC) was determined by drying the soil at +105°C for 12 h. MC was calculated as: MC = (mass before drying-mass after drying)/mass after drying × 100% (Zhu et al. Reference Zhu, Liu, Xu, Ma, Zhao and Sun2008). The pH and NH4+ was determined by ion selective electrode. Total organic carbon (TOC) content was determined from the dry sample by the potassium dichromate volumetric method (Zhu et al. Reference Zhu, Liu, Xu, Ma, Zhao and Sun2008). Total nitrogen (TN), total carbon (TC), total sulphur (TS) and total hydrogen (TH) were analysed by the Elemental Analyzer (Vario, EL).
Statistical analysis
All data were subjected to analysis of Microsoft Excel and SPSS 16.0 for Window XP. We used one-way ANOVA followed by Tukey HSD’s multiple comparisons to assess the differences in potential NH3 fluxes between groups under different treatments. In all analyses where P < 0.05, the factor tested and the relationships were considered statistically significant.
Results
Physical and chemical properties for all the soil samples are given in Table I and Fig. 3.
Table I Physical and chemical properties of penguin guano, ornithogenic soils and seal colony soils sampled from different sea animal colonies of coastal Antarctica.
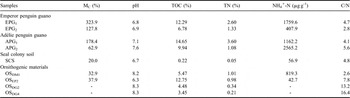
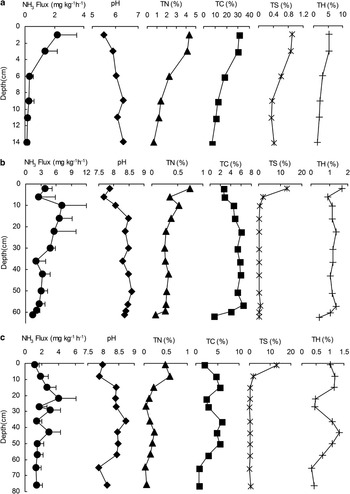
Fig. 3 Variations of mean NH3 fluxes and chemical properties with soil depths in a. OSEP2, b. OSDG2, and c. OSDG4. The dash lines represent one standard deviation of mean NH3 flux.
Effects of FTCs on NH3 emissions from penguin guano and seal colony soils
Freezing-thawing cycle induced a rapid increase in NH3 emission rates from samples EPG1 and APG1, and the same pattern was observed during the subsequent FTCs (Fig. 4). However, the emission rates from seal colony soil SCS showed a small increase only at the first FTC, and then the rates were close to zero at the second and third FTCs. The mean NH3 fluxes from EPG1, APG1 and SCS were 6.17 ± 4.90 mg NH3 kg-1 h-1, 1.05 ± 0.70 mg NH3 kg-1 h-1 and 0.14 ± 0.17 mg NH3 kg-1 h-1 during the FTCs, respectively.

Fig. 4 The NH3 fluxes from a. emperor penguin guano EPG1, b. Adélie penguin guano APG1, and c. seal colony soils SCS during FTCs. The broken and solid lines indicate the freezing and thawing periods, respectively. The error bars represent the standard deviation based on three replicates (n = 3).
The mean fluxes from EPG1, APG1 and SCS during freezing were close to zero, but they increased significantly during the thawing period (Fig. 4 and Table II). For emperor penguin EPG1, NH3 emission rate was 38 times higher during thawing than during freezing whilst for Adélie penguin guano APG1, the emission rate was 68 times higher. In penguin guano samples, the duration of the FTC-related NH3 peaks were less than 8 h. For EPG1, the thawing-related NH3 emission maximum (17.4 mg NH3 kg-1h-1) was highest during the fourth FTC (Fig. 4a). However, the emission maximum for APG1 and SCS did not show similar variations during all the FTCs, and the highest peak for APG1 (3.71 mg NH3 kg-1 h-1) and SCS (1.14 mg NH3 kg-1 h-1) occurred during the second and first FTC, respectively (Fig. 4b & c).
Table II The mean NH3 fluxes from penguin guano and ornithogenic soils and calculated specific NH3-N loss rate (NH3-N/TN) during the thawing period.
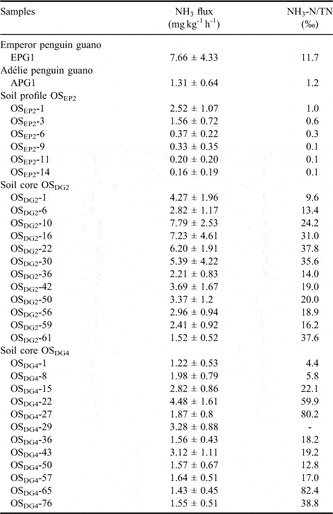
Cumulative NH3 emissions from EPG1 were generally higher than those from APG1 and SCS. The maximum of cumulative NH3 emissions occurred during the fourth FTC for EPG1 (84.1 mg NH3 kg-1) and during the first FTC for APG1 (14.3 mg NH3 kg-1) and SCS (4.8 mg NH3 kg-1) (Fig. 5). The specific NH3-N loss rate (NH3-N/TN) from sample EPG1 was one order of magnitude higher than that from APG1 (Table II).
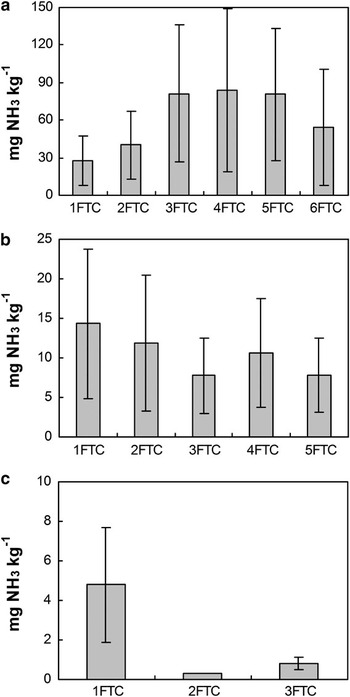
Fig. 5 Cumulative NH3 emissions from a. emperor penguin guano EPG1, b. Adélie penguin guano APG1, and c. seal colony soils SCS during the period from the beginning of each sample thawing, with standard errors.
Effects of FTCs on potential NH3 emissions from ornithogenic soils
Potential NH3 emissions from different depths of ornithogenic soils were also greatly affected by the FTCs, and in all cases a rapid increase in the emission rates was induced following thawing (Figs 6–8), which was very similar to NH3 emissions from penguin guano (Fig. 4). The NH3 fluxes from OSEP2 increased about 1–52 times following thawing. For OSDG2 and OSDG4, the emissions increased about 40–139 times and 25–86 times, respectively. In all soil depths, the duration of the FTC-related NH3 peaks were also less than 8 h. For OSEP2, the thawing-related NH3 emission maximum (5.51 mg NH3 kg-1 h-1) occurred during the first FTC (Fig. 6). For OSDG2, the maximum (12.29 mg NH3 kg-1 h-1) occurred during the first FTC above 30 cm while it occurred during the second or third FTC below 30 cm (Fig. 7). For OSDG4, the maximum (7.63 mg NH3 kg-1 h-1) occurred during the first or third FTC (Fig. 8). However, the emissions during the freezing were extremely low (close to zero) in the three soil profiles.
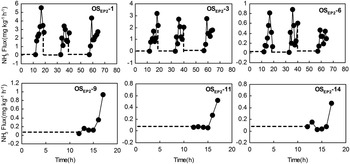
Fig. 6 Potential NH3 fluxes from different depths of ornithogenic soils for the profile OSEP2 during the FTCs. Note: Depths are given by the minus values in the soil sample label given in each subfigure. The broken and solid lines indicate the freezing and thawing periods, respectively.
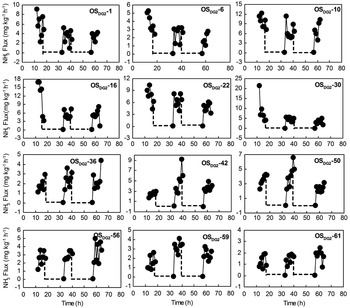
Fig. 7 Potential NH3 fluxes from different depths of ornithogenic soils for soil core OSDG2 during the FTCs. Note: Depths are given by the minus values in the soil sample label given in each subfigure. The broken and solid lines indicate the freezing and thawing periods, respectively.
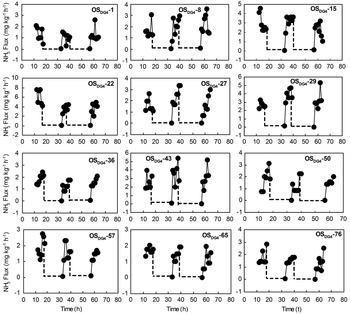
Fig. 8 Potential NH3 fluxes from different depths of ornithogenic soils for soil core OSDG4 during the FTCs. Note: Depths are given by the minus values in the soil sample label given in each subfigure. The broken and solid lines indicate the freezing and thawing periods, respectively.
These ornithogenic soil profiles showed different NH3 emission rates and patterns with depth. During three FTCs, the mean fluxes from OSDG2 (2.72 ± 1.22 mg NH3 kg-1 h-1) and OSDG4 (1.65 ± 0.57 mg NH3 kg-1 h-1) were one order of magnitude higher than that from OSEP2 (0.76 ± 0.85 mg NH3 kg-1 h-1). The NH3 emissions from surface soils were evidently higher than those from deep soils in all the profiles. For OSEP2, NH3 fluxes from the soils above the first 3 cm were higher than 1 mg NH3 kg-1 h-1 and lower than 0.8 mg NH3 kg-1 h-1 below 6 cm (Fig. 8a). For OSDG2, most of fluxes from the soils above the first 30 cm were higher than 4 mg NH3 kg-1 h-1 and lower than 4 mg NH3 kg-1 h-1 below 30 cm (Fig. 3b). For OSDG4, the fluxes from the soils were lower than 4 mg NH3 kg-1 h-1 for all depths (Fig. 3c).
Total cumulative emission of NH3 during three FTCs is shown in Fig. 9. Three profiles OSEP2, OSDG2 and OSDG4 showed different cumulative emission amounts and patterns during FTCs. Cumulative NH3 emissions from surface soils were generally higher than those from deep soils. Additionally, the maximum cumulative NH3 emissions occurred during the first FTC in the surface soils at OSEP2 and OSDG2 while profile OSDG4 showed a different emission pattern. The highest cumulative emissions were 21.4 mg NH3 kg-1 for OSEP2, 70.4 mg NH3 kg-1 for OSDG2 and 36.2 mg NH3 kg-1 for OSDG4 during three FTCs. The NH3-N loss rates (NH3-N/TN) was markedly larger in OSDG2 and OSDG4 than in OSEP2 (Table II).
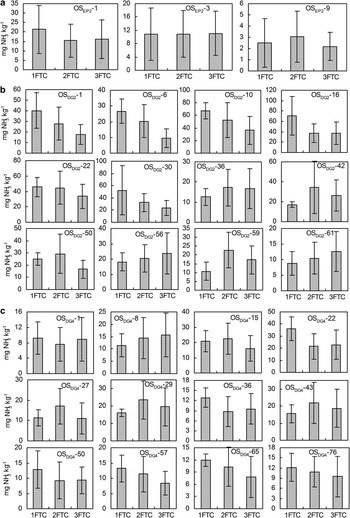
Fig. 9 Cumulative NH3 emissions from different depths of ornithogenic soils for profiles a. OSEP2, b. OSDG2, and c. OSDG4 during the period from the beginning of each sample thawing, with standard errors. Note: Depths are given by the minus values in the soil sample label given in each subfigure.
NH3 fluxes and environmental variables
There was no difference in TN and TC contents in soil profiles OSDG2 and OSDG4, and they were higher in the profile OSEP2 than in OSDG2 and OSDG4. However, NH3 emissions from OSEP2 were significantly lower than those from OSDG2 and OSDG4 (Fig. 3). Additionally, NH3 fluxes, TN, TC and TH showed consistent variability with depth in profiles OSEP2, OSDG2 and OSDG4 (Fig. 3). There was a relatively low correlation between NH3 fluxes and TC contents in OSDG2 and OSDG4 (Fig. 10a). However, NH3 fluxes showed a significant linear correlation with TN (for OSDG2 and OSDG4, fluxNH3 = 10.22TN+0.69, P < 0.001; for OSEP2, fluxNH3 = 0.51TN-0.44, P = 0.008) in these three profiles (Fig. 10b), indicating that TN content was one of important factors affecting the magnitude of NH3 emission.
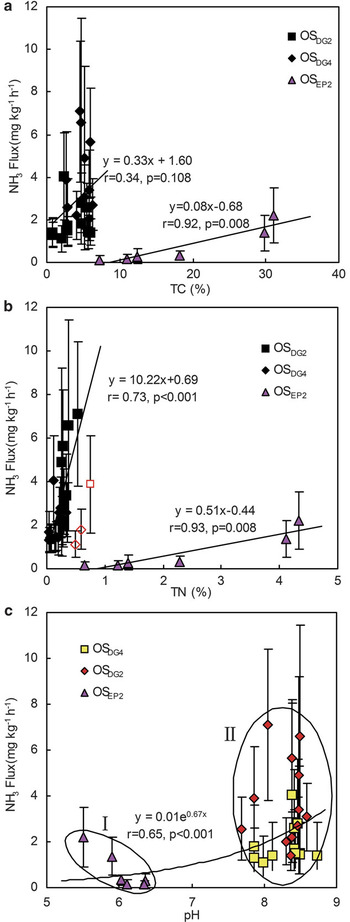
Fig. 10 Correlation between NH3 fluxes from ornithogenic soils a. OSEP2, OSDG2 and OSDG4 and TC, b. TN, and c. pH. Vertical lines represent one standard deviation of mean NH3 flux. Note: Three outlier data exempts from the correlation in b.
The pH was within the range of 5.5–6.3 for OSEP2 and within the range of 7.8–8.6 for OSDG2 and OSDG4 (Fig. 3). Overall, NH3 fluxes from the three profiles showed a significant exponential correlation with pH (Fig. 10c). According to pH values, NH3 fluxes could be categorized into two groups: the first group represented NH3 fluxes from OSEP2 which had relatively lower fluxes at pH < 6.5. The second group represented NH3 fluxes from OSDG2 and OSDG4 which had relatively higher fluxes at pH > 7.5 (Fig. 10c). Therefore NH3 volatilizes more easily from ornithogenic soils at pH > 7.5, suggesting that pH played a role in the potential for NH3 volatilization. The relationship between NH3 fluxes and controlled temperatures was also examined from soil cores OSDG2 and OSDG4 over a wide range of temperature (4–30°C). NH3 fluxes from OSDG2 and OSDG4 showed an exponential increase with the temperatures (Fig. 11).
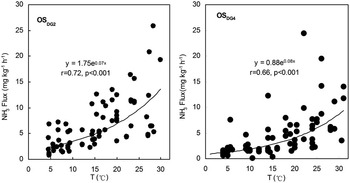
Fig. 11 Correlation between NH3 fluxes from ornithogenic soils OSDG2 and OSDG4 and temperatures.
As illustrated in Fig. 12, NH3 emissions from samples EPG2 and APG2 were higher than those from soil profiles OSEP2 and OSDM1 under different moisture treatments. When 10 ml, 15 ml and 20 ml water was added, significantly or slightly enhanced NH3 emissions occurred in APG2, OSEP2 and OSDM1 during the five-day incubation period. However, decreased NH3 emissions occurred in EPG2 during the initial three days, which may be due to particularly high water content (the ratio of the lost water amount and dry soil weightx100% = 127.8%) in emperor penguin guano (Table I). In addition, NH3 emissions from APG2, OSEP2 and OSDM1 showed an insignificant difference between treatments of 10 ml, 15 ml and 20 ml water addition (Table III).
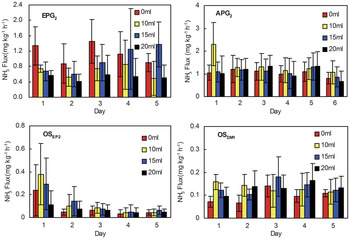
Fig. 12 Effects of water addition on NH3 fluxes from penguin guano and ornithogenic soils APG2, EPG2, OSDM1 and OSEP2.
Table III Comparisons between the NH3 fluxes from penguin guano and ornithogenic soils under different water treatments.
Note: The different letter indicates statistically significant difference while the same letter indicates no significant difference.
Discussion
Effects of FTCs on NH3 emissions
In all the experimental samples, enhanced NH3 emissions following thawing have been observed (Fig. 4 and Figs 6–8). High NH3 emissions during the thawing period were probably controlled by two processes:
1) the microbial decomposition of uric acid to ammonium, and the rate of ammonification (Blackall et al. Reference Blackall, Wilson, Bull, Theoblad, Bacon, Hamer, Wanless and Sutton2008). Significantly elevated microbial respiration has been found in penguin guano, ornithogenic soils and seal colony soils during FTCs due to the high levels of nutrients from excreta (Zhu et al. Reference Zhu, Liu, Ma, Sun, Xu and Sun2009). In the boreal regions of the Northern Hemisphere, the activity of all heterotrophic microbes increased during tundra soil FTCs (Schimel & Clein Reference Schimel and Clein1996). In this study, microbial decomposition rates of uric acid in penguin guano or ornithogenic soils might be greatly increased during FTCs, leading to an increase in the rate of ammonification, and thus increased NH3 emissions, indicating that freeze-thaw increased the availability of substrates for heterotrophic microbes (Premié & Christensen Reference Premié and Christensen2001, Teepe et al. Reference Teepe, Brumme and Beese2001). Recent studies have shown that increased N2O and CH4 fluxes from soils or marine animal excreta that occurred during FTCs (Teepe et al. Reference Teepe, Brumme and Beese2001, Koponen et al. Reference Koponen, Jaakkola, Keinänen-Toivola, Kaipainena, Tuomainen, Servomaa and Martikainen2006, Zhu et al. Reference Zhu, Liu, Ma, Sun, Xu and Sun2009) were very similar to NH3 emissions in this present study,
2) There was some NH3 production and emission in frozen penguin guano and ornithogenic soils although the fluxes were very low (Fig. 4 & Figs 6–8). Therefore part of NH3 released during the thawing period might have originated from the NH3 stored in frozen guano or soils.
Effects of TOC and TN contents on NH3 emissions
Ammonia fluxes from ornithogenic soils showed a positive correlation with TN and TC (Fig. 10a & b). Previous studies have found that the accumulated flux of NH3 is linearly related to the amount of TN in the slurry (Sommer Reference Sommer1997, Aneja et al. Reference Aneja, Chauhan and Walker2000, Reference Aneja, Bunton, Walker and Malik2001). Our study agrees with this. Penguin guano and ornithogenic soils both have particularly high nitrogen contents (Table I) with uric acid as the dominant nitrogen species (Lindeboom Reference Lindeboom1984). Uric acid degrades through allantoin and urea to ammonium in summer when soils thaw (Boyd & Boyd Reference Boyd and Boyd1963, Legrand et al. Reference Legrand, Ducroz, Wagenbach, Mulvaney and Hall1998). Ammonium, as an end product of the breakdown, can be partly lost to the atmosphere as ammonia (Legrand et al. Reference Legrand, Ducroz, Wagenbach, Mulvaney and Hall1998). The NH4+-N contents in fresh penguin guano are significantly higher than those in the aged penguin guano or ornithogenic soils (Table I), so NH3 emissions from fresh penguin guano or surface sediments were higher than those from the aged guano or deep soils (Figs 3, 4, 6, 7). At present, seabird excretal mass budgets have assumed volatilization rates of up to 90% of total excreted nitrogen as NH3 although direct measurements of NH3 emissions in Antarctica are not available (Lindeboom Reference Lindeboom1984). Legrand et al. (Reference Legrand, Ducroz, Wagenbach, Mulvaney and Hall1998) estimated NH3 emissions from the total breeding population of five million Adélie penguins around the Antarctic continent as a maximum of 250 t NH3-N during the summer. Our results provide a more quantitative relationship between NH3 flux from ornithogenic Antarctic soils and TN than those reported in the literature (Fig. 10b).
Ammonia emissions from surface soils were lower for profiles OSDG2 and OSDG4 due to the effects of high TS content (primarily as SO42-) and low pH values, although TN contents of surface soils were much higher than those of deep soils (Fig. 3b & c). High SO42- can reduce the NH4+ production, and thus resulted in less NH3 emissions through the following equation (Duplessis & Kroontje Reference Duplessis and Kroontje1964):
Effects of pH on NH3 emissions
In this study, a variation in pH coincided with the variation in NH3 emission rates except for profile OSEP2 (Fig. 3), and a significant exponential correlation between NH3 flux and pH was found (Fig. 10c). Several published modelling studies (Aneja et al. Reference Aneja, Chauhan and Walker2000, Reference Aneja, Bunton, Walker and Malik2001, Roelle & Aneja Reference Roelle and Aneja2002) corroborate this positive relationship between NH3 flux and pH. It is known that NH3 volatilization from soil solution is affected by the equilibrium between NH3 and NH4+ ions in the aqueous phase. Hence, more NH3 could be released with the increase in soil pH (OH- increases) according to the equilibrium reaction (Duplessis & Kroontje Reference Duplessis and Kroontje1964, Aneja et al. Reference Aneja, Bunton, Walker and Malik2001):
Changes in pH had the most significant effect on the abiotically induced NH3 emissions (Dewes Reference Dewes1996). The alkaline nature of occupied ornithogenic Antarctic soils reported by Speir & Cowling (Reference Speir and Cowling1984), with pH around 8, permits such a loss of NH3 to the atmosphere (Legrand et al. Reference Legrand, Ducroz, Wagenbach, Mulvaney and Hall1998). In this study, ornithogenic soils showed higher NH3 emissions when pH was in the range of 7.5 to 9.0 (Fig. 10c). For the first time, our results also give a quantitative relationship between NH3 fluxes and pH in ornithogenic Antarctic soils.
Effects of temperature on NH3 emissions
The relationship between NH3 fluxes and temperature was examined over a wide range (4–30°C). A strong exponential correlation was obtained between NH3 emission and temperature from ornithogenic soils (Fig. 11). Several previous studies on animal waste have also found temperature to be a major factor in controlling the release of NH3 into the atmosphere (Dewes Reference Dewes1996, Sommer Reference Sommer1997, Aneja et al. Reference Aneja, Chauhan and Walker2000, Blunden & Aneja Reference Blunden and Aneja2008). The temperature dependence of NH3 emission may be explained by the fact that changes in temperature can directly influence chemical and biological processes (especially the biological breakdown of uric acid) occurring simultaneously in the penguin guano or ornithogenic soils (Legrand et al. Reference Legrand, Ducroz, Wagenbach, Mulvaney and Hall1998, Roelle & Aneja Reference Roelle and Aneja2002). High incubation temperatures stimulated the microbial breakdown of the easily mineralized organic substrates from animal waste, especially at the very beginning of decomposition (Dewes Reference Dewes1996, Aneja et al. Reference Aneja, Bunton, Walker and Malik2001). Additionally, the liquid phase mass transfer coefficients of NH3 in water are exponential functions of temperature in the range 5 to 30°C (Ibusuki & Aneja Reference Ibusuki and Aneja1984, Dasgupta & Dong Reference Dasgupta and Dong1986). In coastal Antarctica, the microbial decomposition of uric acid in penguin guano or ornithogenic soils might be accelerated due to the enhanced summertime temperature, which can lead to higher NH3 emissions into the local atmosphere. The results of this study provide a good quantitative relationship between NH3 flux from ornithogenic Antarctic soils and temperature.
Effects of moisture on NH3 emissions
In this study, penguin guano APG2 and ornithogenic materials OSEP2 and OSDM1 had particularly low water contents (32.9–62.9%) (Table I) and significantly enhanced NH3 emissions occurred in these samples during the initial two day incubation following water addition (Fig. 12). Previous experiments have showed a large transient NH3 pulse following water addition to dry soils, presumably driven by an increase in soil NH4+ concentrations and stimulation of microbial activity following soil wetting (McCalley & Sparks Reference McCalley and Sparks2008). However, NH3 emissions reduced from EPG2 during the initial three days following water addition, which may be due to particularly high water content (127.8%) (Table I). Similarly, some studies showed that increasing the water content, e.g. precipitation events, may reduce NH3 volatilization since more ammonia is tightly bound in solution (Whitehead & Raistrick Reference Whitehead and Raistrick1991, Blunden & Aneja Reference Blunden and Aneja2008). This study area has a cold and dry climate, and moisture is one of major limiting factors affecting the uric acid biological breakdown of Antarctic ornithogenic soils in summer due to high bacterial biomass (Speir & Ross Reference Speir and Ross1984). Therefore soil moisture conditions can have an important effect on NH3 emissions from penguin guano or ornithogenic soils.
Conclusion
In our laboratory experiments Antarctic penguin guano and ornithogenic soils showed potential high NH3 emissions, suggesting that sea animal colonies are a strong emission source of atmospheric NH3. Freezing-thawing cycle induced enhanced NH3 emissions from penguin guano and ornithogenic soils, confirming that FTC is an important factor influencing summer NH3 emissions from marine animal colonies in coastal Antarctica. In addition, temperature, TN content and pH are significant variables influencing NH3 flux. Our results provide a quantitative relationship between NH3 flux and TN, pH and temperature from ornithogenic Antarctic soils.
In coastal Antarctica, the number of marine animal colonies is large. The cycles of freezing and thawing in such sites are high throughout the summer, during which NH3 emissions may account for a large proportion of N annual flux from animal colonies on land. Field studies are now needed to investigate in situ NH3 emissions and associated environmental factors to validate our conclusions.
Acknowledgements
This work was supported by the Project of Knowledge Innovation of CAS (KZCX2-YW-QN510) and the Open Project of Key Laboratory for Polar Sciences of State Oceanic Bureau (KP2008004). We sincerely acknowledge the members of the 22nd Chinese Antarctic Research Expedition for assistance with the sample collection. The constructive comments of the reviewers are also gratefully acknowledged.


