Published online by Cambridge University Press: 03 March 2004
The simplified perturbation method of Vandenboomgaerde et al. (2002) is applied to both the Richtmyer–Meshkov and the Rayleigh–Taylor instabilities. This theory is devoted to the calculus of the growth rate of the perturbation of the interface in the weakly nonlinear stage. In the standard approach, expansions appear to be series in time. We build accurate approximations by retaining only the terms with the highest power in time. This simplifies and accelerates the solution. High order expressions are then easily reachable. For the Richtmyer–Meshkov instability, multimode configurations become tractable and the selection mode process can be studied. Inferences for the intermediate nonlinear regime are also proposed. In particular, a class of homothetic configurations is inferred; its validity is verified with numerical simulations even as vortex structures appear at the interface. This kind of method can also be used for the Rayleigh–Taylor instability. Some examples are presented.
The Rayleigh–Taylor (RT) and Richtmyer–Meshkov (RM) instabilities are involved in several physical phenomena, such as supernovas, inertial confinement fusion (ICF), and shock tube experiments. Several theoretical works have described the linear stage of the RM instability (Richtmyer, 1960; Fraley, 1986; Mikaelian, 1994; Yang et al., 1994; Velikovich, 1996; Wouchuk & Nishihara, 1996; Wouchuk, 2001). Perturbation methods (Nayfeh, 1973) have been used by several authors to describe the weakly nonlinear regime of interfacial instabilities (Ingraham, 1954; Holyer, 1979; Haan, 1991; Velikovich & Dimonte, 1996; Zhang & Sohn, 1997, 1999; Berning & Rubenchik, 1998). The small parameter is the initial wave steepness, a0 k, where a0 and k are the initial amplitude and the wave number of the interface, respectively.
In the previous International Workshop on the Physics of Compressible Turbulent Mixing (IWPCTM) conference, an efficient method for the perturbation theory in the weakly nonlinear RM instability was presented; it was a drastic simplification of the work carried out by Zhang and Sohn (1997). Their work follows previous work by Holyer (1979) concerning water waves. Our approach makes perturbation expansions for multimode configurations easily tractable. Furthermore, the simplicity of the model has brought out some features of the nonlinear evolution of the RM instability. It will be shown by comparing these results with two-dimensional numerical simulations, that these features that have been derived within the framework of the weakly nonlinear theory hold for the intermediate nonlinear stage.
The paper is organized as follows. In Section 2, we detail the perturbation theory. In Sections 3 and 4, it is applied to the mode selection process, and a class of homothetic perturbations is inferred for the RM instability. In Section 5, we apply the theory to the RT instability.
Two fluids 1 and 2 with densities ρ and ρ′, respectively, are studied once the interface has been accelerated. The flow is assumed to be incompressible and irrotational.
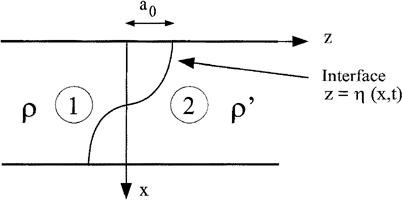
In this part, the interface is considered to be sine shaped (see Fig. 1). The velocity potentials are Φ and Φ′ for the fluids 1 and 2, respectively. The Atwood number is A = (ρ′ − ρ)/(ρ′ + ρ). Following Holyer (1979), the phenomenon is described by the motion equation of the interface in each fluid:


Sketch of the configuration.
and the momentum equation at the interface (Bernoulli's equation)

For the RT instability, g is a constant whereas for the RM instability, g is a Dirac function.
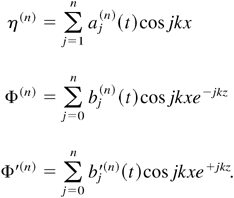
The system to be solved is composed of Eqs. (1)–(3). The unknowns are the interface shape η(x, t) and the two potentials Φ(x, z, t) and Φ′(x, z, t). Provided that a0 k is smaller than 1, perturbative expansions may be used. Each unknown is expanded as (Holyer 1979)

The nth term of these series is of the order of (a0 k)n. To solve the problem, these terms are further expanded as

The unknowns are now (aj(n)(t), bj(n)(t), b′j(n)(t)). The expansions (5) are used in Eqs. (1)–(3), and at the order n, the terms of the order of (a0 k)n are collected. The resulting system is solved and leads to n + 1 systems of differential equations.
It turns out that for the RT or RM instabilities, the small parameter is always multiplied by either eγt or σt, respectively; γ and σ are the linear growth rates. It is well known that in such perturbation expansions, an accurate approximation can usually be built with only the most secular terms (see, e.g., Bender & Orszag, 1978). The most secular term is defined as the term with the highest unbounded time expression. By inspection of the results of the full perturbation theory (Zhang & Sohn, 1997), up to the fourth order, we put as general forms for the most secular part of η(n), Φ(n), and Φ′(n), for the RM instability:

For the RT instability, eγt and γ must be used instead of σt and σ, respectively. The validity of such method for the multimode RM instability has been verified and reported in Vandenboomgaerde et al. (2002).
The perturbation theory derived in the previous section has a finite range of validity defined as a0 kσtv = 1. This range of validity can be increased with summation algorithms such as Padé approximants. An important issue in nonlinear interaction studies is to understand the mode selection process. In this section, we will see that using the approximate theory beyond the weakly nonlinear regime allows us to obtain qualitative results about the mode selection process. To study the late time interaction of two modes, we follow the same methodology as that used in Ofer et al. (1992) for the RT instability. In this paper, two-dimensional (2D) numerical simulations provide the time evolution of the shape of the interfaces which are then Fourier analyzed.
For the RM instability, the range of validity of the approximate theory, checked numerically, is tv = (a0 kσ)−1. As σ is proportional to k (Richtmyer, 1960), tv is proportional to k−2. For practicality, we present in this paper a nearby mode study in order to have near ranges of validity from the two modes. In a first step, 2D simulations of RM instability are performed with the code CADMÉE (Mügler et al., 1996, 2000). In these configurations, a 1.26 Mach number shock wave moves from helium to air. The two wave numbers of the initial interface perturbation are k1 = 274.889 m−1 and k2 = 314.159 m−1. The initial amplitudes for the two modes are either a01 = 10−3 m or a02 = 0.35 × 10⁻³ m. The postshocked Atwood number is A = 0.756. The final time of the 2D simulations is 1.8 × 10⁻³ s. At time as early as 4 × 10⁻⁴ s, mushroomlike features appear at the interface. This can be seen in Figure 2, which shows the isocurves of the concentration (c), c = 0.25, c = 0.5, and c = 0.75 at different times for the following two-mode configuration: {(k1, a01),(k2, a02)}.

One of the two-mode configurations. The two gases are helium and air. Interface shapes for t = 0, 0.4 ms, 0.8 ms, 1.2 ms, and 1.6 ms.
A spectral analysis of such shapes is performed. Figure 3a,c,e,g shows the results obtained from numerical simulations and compares the single-mode evolution with the two-mode growth of k1 and k2 for various initial amplitudes. Full and dashed lines represent single and two-mode dynamics, respectively.

Single- and two-mode configurations. Growth of the modes k1 and k2 versus time. Full and dashed lines represent the single-mode and two-mode dynamics, respectively. Curves a, c, e, and g are from CADMÉE simulations. Curves b, d, f, and h are from the approximate perturbation theory.
Conclusions about RM mode selection process are the same as the ones obtained in Ofer et al. (1992) about the RT instability.
Figure 3b,d,f,h shows the growths of k1 and k2, which are obtained with the P21 Padé approximant of the fifth order approximate perturbation expansion. Vertical bars on each curve indicate the range of validity of the perturbation expansion. It can be verified that theoretical and numerical results are in good agreement in the range of validity of the theory. Beyond that time, the P21 Padé approximant exhibits an oversaturated behavior: At large time, the growth from the extended approximate theory is roughly half the simulation values. However, the following qualitative remarks can be made: Figures 3a,b deals with the configuration {(k1, a02),(k2, a01)}. For the single-mode dynamics, the relative evolution of the two modes is qualitatively recovered by the theory. In the simulation of the two-mode dynamics, the mode k1 is suppressed, whereas the mode k2 behavior is only slightly modified by the interaction. In the same way, theoretical results show that the growth of the mode k1 saturates whereas the mode k2 is not perturbed.
Such a good qualitative agreement about the mode selection process is also found for the three other configurations. We believe that this agreement indicates that the mode selection process is driven by early time dynamics.
The amplitude a(t) of a single-mode interface is rearranged as follows:

The right-hand side of Eq. (7) can be considered as the Taylor expansion of a single function F [A, a0 kσt] . So, when the same physical parameter values for two configurations 1 and 2 are used (same Atwood number), and as σ is proportional to k, Eq. (7) gives

Equation (8) defines a class of homothetic configurations: For a given set of physical parameters, the growth of one configuration allows us to determine the growth of all the configurations of the same class.
To confirm this conclusion, we have run two simulations with the CADMÉE code. In these simulations, a 1.0962 Mach number shock moves from helium to air. The postshocked Atwood number is 0.764. The two configurations are: (a01, k1) = (0.35 × 10⁻³ m, 274.855 m−1) and (a02, k2) = (0.525 × 10⁻³ m, 224.418 m−1), which satisfies the equality a01 k12 = a02 k22. Figure 4a shows the growths of the perturbations obtained from the two-dimensional simulations. Full and mark-dotted lines represent configurations 1 and 2, respectively. Figure 4b shows the growths of the perturbation 1, obtained either from the simulation (full line) or from Eq. (8).

Homothetic single-mode dynamics. a: Growths of the perturbations 1 and 2 are plotted with full and mark-dotted lines, respectively. Results are obtained with the CADMÉE simulation. b: The growth of the perturbation 1. The full line is from the CADMÉE simulations. The mark-dotted curve is obtained from configuration 2 by using Eq. (8).
Numerical and theoretical results cannot be distinguished. The range of validity of the approximate theory for these two configurations is tvs = 0.72 × 10⁻³ s. Figure 4b shows that Eq. (8) is valid in the intermediate nonlinear regime. Furthermore, even when mushroom shapes appear, the homothetic transform allows us to determine one interface shape from the other one. Figure 5a shows the shapes of interfaces 1 and 2 at t = 2.87 × 10⁻³ s (full and mark-dotted lines, respectively).

Homothetic single-mode dynamics at t = 2.87 ms. a: Shape of perturbations 1 and 2 are plotted with full and mark-dotted lines, respectively. b: Shape of perturbation 1. The full line is from simulation. The mark-dotted curve is obtained from a homothetic transform of shape 2.
We have applied z and x homotheties of scale k2 /k1 = 0.82 to shape 2. The result is plotted in the mark-dotted line in Figure 5b. It has to be compared with shape 1 in full line. Once again, the agreement is excellent even for the vortex structures of the mushroom.
As explained in Section 2, simplified results can also be obtained for the RT instability. The range of validity of the expansions is now defined as a0 k exp(γt) = 1. The same algorithm is used as for the RM instability.
To check the accuracy of the approximate perturbation method, its predictions have been compared with simulations done by Menikoff and Zemach (1983). The physical parameters are g = 1, A = 1, k = 1, a0 = −0.01. This leads to tv = 4.6. In Figure 6, the amplitude of the spike and the bubble are plotted versus time. The 9th- and 11th-order approximate perturbation theory and the numerical results are in full and dashed lines, respectively.

Growths of the tips of the spike and the bubble. Ninth- and 11th-order perturbation results and numerical ones are plotted in full and dashed lines, respectively.
For t slightly greater that tv, the series diverges. However, within the range of validity, numerical and theoretical curves cannot be distinguished.
A qualitative comparison has been made with some results of Baker et al. (1980) concerning the influence of the Atwood number on the growth of the spike and bubble. For a small Atwood number, the spike and bubble have the same nonlinear growth; on the other hand, for an Atwood number close to 1, the spike grows faster than the bubble. The same conclusions can be found using the approximate perturbation theory.
We have developed an efficient way of deriving a perturbation method for the Richtmyer–Meshkov instability in the nonlinear regime. This model holds provided the flows are potential and incompressible. Solutions have been obtained as perturbation series. Such expansions can be drastically simplified by retaining, at each order, the terms with the highest power in time. Nonlinear behavior of interfaces can then be easily calculated even if high-order expansions are required. Several conclusions can be drawn from this study:
The kind of solution technique that has been used for the RM instability is appropriate to describe the weakly nonlinear regime of a single-mode RT instability. This has been checked against numerical simulation.

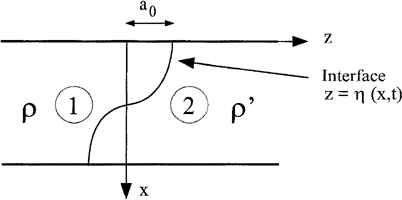
Sketch of the configuration.

One of the two-mode configurations. The two gases are helium and air. Interface shapes for t = 0, 0.4 ms, 0.8 ms, 1.2 ms, and 1.6 ms.

Single- and two-mode configurations. Growth of the modes k1 and k2 versus time. Full and dashed lines represent the single-mode and two-mode dynamics, respectively. Curves a, c, e, and g are from CADMÉE simulations. Curves b, d, f, and h are from the approximate perturbation theory.

Homothetic single-mode dynamics. a: Growths of the perturbations 1 and 2 are plotted with full and mark-dotted lines, respectively. Results are obtained with the CADMÉE simulation. b: The growth of the perturbation 1. The full line is from the CADMÉE simulations. The mark-dotted curve is obtained from configuration 2 by using Eq. (8).

Homothetic single-mode dynamics at t = 2.87 ms. a: Shape of perturbations 1 and 2 are plotted with full and mark-dotted lines, respectively. b: Shape of perturbation 1. The full line is from simulation. The mark-dotted curve is obtained from a homothetic transform of shape 2.

Growths of the tips of the spike and the bubble. Ninth- and 11th-order perturbation results and numerical ones are plotted in full and dashed lines, respectively.