Introduction
Seed quality is a multiple component characterization of seeds, including varietal and analytical purity, germination capacity, vigour, seed health and uniformity. Currently, testing for seed quality relies on physical and chemical as well as visual inspections, which are costly and time consuming. Furthermore, visual inspections are subjective and difficult to reproduce.
Visible features like colour, surface structure, morphology and seed size are determined by machine vision, primarily based on RGB (red, green and blue) cameras. Another optical sensing technology is near-infrared spectroscopy (NIRS) for the determination of chemical composition, both on the seed surface and internally. Hyperspectral imaging combines the two technologies and provides information on both spatial and spectral aspects (Huang et al., Reference Huang, Wang, Zhu, Qin and Huang2015). Rahman and Cho (Reference Rahman and Cho2016) have reviewed a number of non-destructive measurement techniques including machine vision, spectroscopy and hyperspectral imaging for the assessment of quality parameters of agricultural seeds. In particular, they found hyperspectral imaging to be a promising tool for seed quality aspects, as it combines machine vision and spectroscopy into one instrument. Applications of hyperspectral imaging in seed quality assessment are variety identification and classification, quality grading, detection of insect damage and fungi infection, and prediction of chemical composition (Huang et al., Reference Huang, Wang, Zhu, Qin and Huang2015). The spectral regions employed cover a broad range of spectra in the visible (380–780 nm) and NIR (780–2500 nm) region (Huang et al., Reference Huang, Wang, Zhu, Qin and Huang2015; Rahman and Cho, Reference Rahman and Cho2016). However, adoption of hyperspectral imaging by the seed industry requires a decrease of costs without compromising the accuracy of analysis (Dell'Aquila, Reference Dell'Aquila2007; Huang et al., Reference Huang, Wang, Zhu, Qin and Huang2015; Rahman and Cho, Reference Rahman and Cho2016).
Selecting only those spectra providing specific information about the quality aspect in question is one way of reducing costs, yet still maintaining the high quality assessment. Multispectral imaging (MSI) systems include light sources providing a restricted number of wavelengths, which will provide the specific spectra. Examples are reported from the food industry where the spectra from four wavelength bands provide 100% correct classification of damaged mushrooms (Esquerre et al., Reference Esquerre, Gowen, Downey and O'Donnell2012), and similarly Xing et al. (Reference Xing, Symons, Shahin and Hatcher2010) were able to distinguish sprouted from non-sprouted wheat kernels by the use of four specific wavelength bands.
The Organisation for Economic Co-operation and Development (OECD) defines the standards for the certification of seeds in the international trade, and the International Seed Testing Association (ISTA) develops, approves and disseminates methods for harmonized and standardized seed quality analysis. The Association of Official Seed Analysts (AOSA) has a similar function in the USA and Canada. The procedures of seed quality assessments are consolidated and globally accepted, and new technologies need to be thoroughly documented before approval is obtained. Both ISTA and AOSA recognize the need for new technologies for non-destructive, fast and reliable seed quality assessment to improve seed quality analysis and to reduce the cost of labour-intensive tests.
This review provides examples of applications of MSI for the assessment of physiological characteristics and determination of fungal infection. In addition, the results obtained by MSI in seed quality assessments are reviewed.
Seed development and maturity
Crops like sugar beet (Beta vulgaris) and spinach (Spinacia oleracea) have an indeterminate flowering pattern, which consequently leads to a non-uniform seed development and maturity pattern. Furthermore, the climatic conditions during seed production may affect the interval from anthesis to harvest time, resulting in seed lots with non-uniform maturity levels. Distinguishing empty or underdeveloped seeds from fully matured seeds is hardly possible by visual inspection, but their effect on the germination potential of a seed batch is significant (Tekrony and Hardin, Reference TeKrony and Hardin1969). In many studies on sugar beet seed performance, the underdeveloped seeds are considered to be the predominant reason for poor field establishment (TeKrony, Reference TeKrony1969; TeKrony and Hardin, Reference TeKrony and Hardin1969; Snyder, Reference Snyder1971; Śliwińska et al., Reference Śliwińska, Jing, Job, Job, Bergervoet, Bino and Groot1999). Sugar beet is an important commercial biennial crop with a global production of 185 million metric tons in 2017 (USDA, 2017). It is direct-seeded and the seed quality greatly affects field emergence uniformity and crop yield (Agrawal and Rakwal, Reference Agrawal and Rakwal2012).
During maturation, the amount of chlorophyll in the seed coat of many seed species decreases (Dell'Aquila, Reference Dell'Aquila2009), and Jalink et al. (Reference Jalink, Frandas, van der Schoor and Bino1998) reported chlorophyll fluorescence (CF) as a non-destructive marker for seed maturity and performance in white cabbage (Brassica oleracea). Following this finding, CF has been demonstrated to correlate with seed germination in pepper (Capsicum annuum) and spinach (Deleuran et al., Reference Deleuran, Olesen and Boelt2013; Kenanoglu et al., Reference Kenanoglu, Demir and Jalink2013).
X-ray provides a non-destructive evaluation method of the internal seed morphology associated with seed development (Dell'Aquila, Reference Dell'Aquila2009), and its application to predict germination capacity has been reported in bell pepper (Capsicum annuum) and tomato (Solanum lycopersicum) seeds (van der Burg et al., Reference van der Burg, Aartse, van Zwol, Jalink and Bino1994; Gagliardi and Marcos-Filho, Reference Gagliardi and Marcos-Filho2011; Gomes-Junior et al., Reference Gomes-Junior, Yagushi, Belini, Cicero and Tomazello-Filho2012; Silva et al., Reference Silva, Cicero and Bennett2013).
With the aim of comparing multispectral image analysis results from a non-uniform sugar beet seed lot, 20 sugar beet seeds in each of three maturity classes based on CF sorting according to Deleuran et al. (Reference Deleuran, Olesen and Boelt2013) were analysed by MSI technology. Multispectral images were captured by the VideometerLab multispectral imaging system (Videometer A/S, Hørsholm, Denmark). High resolution images (2056 × 2056 pixels) constituted images from 19 wavelengths ranging from 375 to 970 nm. The multispectral images of the sugar beet seeds were analysed by a normalized canonical discriminant analysis (nCDA) (Olesen et al., Reference Olesen, Nikneshan, Shrestha, Tadayyon, Deleuran, Boelt and Gislum2015; Shrestha et al., Reference Shrestha, Deleuran, Olesen and Gislum2015) to discriminate between maturity classes. The mean reflectance from the surface of the sugar beet seeds in the maturity classes 1 to 3 were different across the 19 wavelengths. The immature seeds (class 1) generally had a higher reflection in the visible range of the spectrum, whereas all three classes showed differences in the NIR spectrum. Chlorophyll fluorescence is correlated with the reflectance in wavelengths 435, 645 and 660 nm of this MSI system. As indicated in Fig. 1, the immature seeds have a higher reflectance compared with maturity classes 2 and 3 in those wavelengths, but the reflectance of classes 2 and 3 is almost overlapping in the visible spectrum.
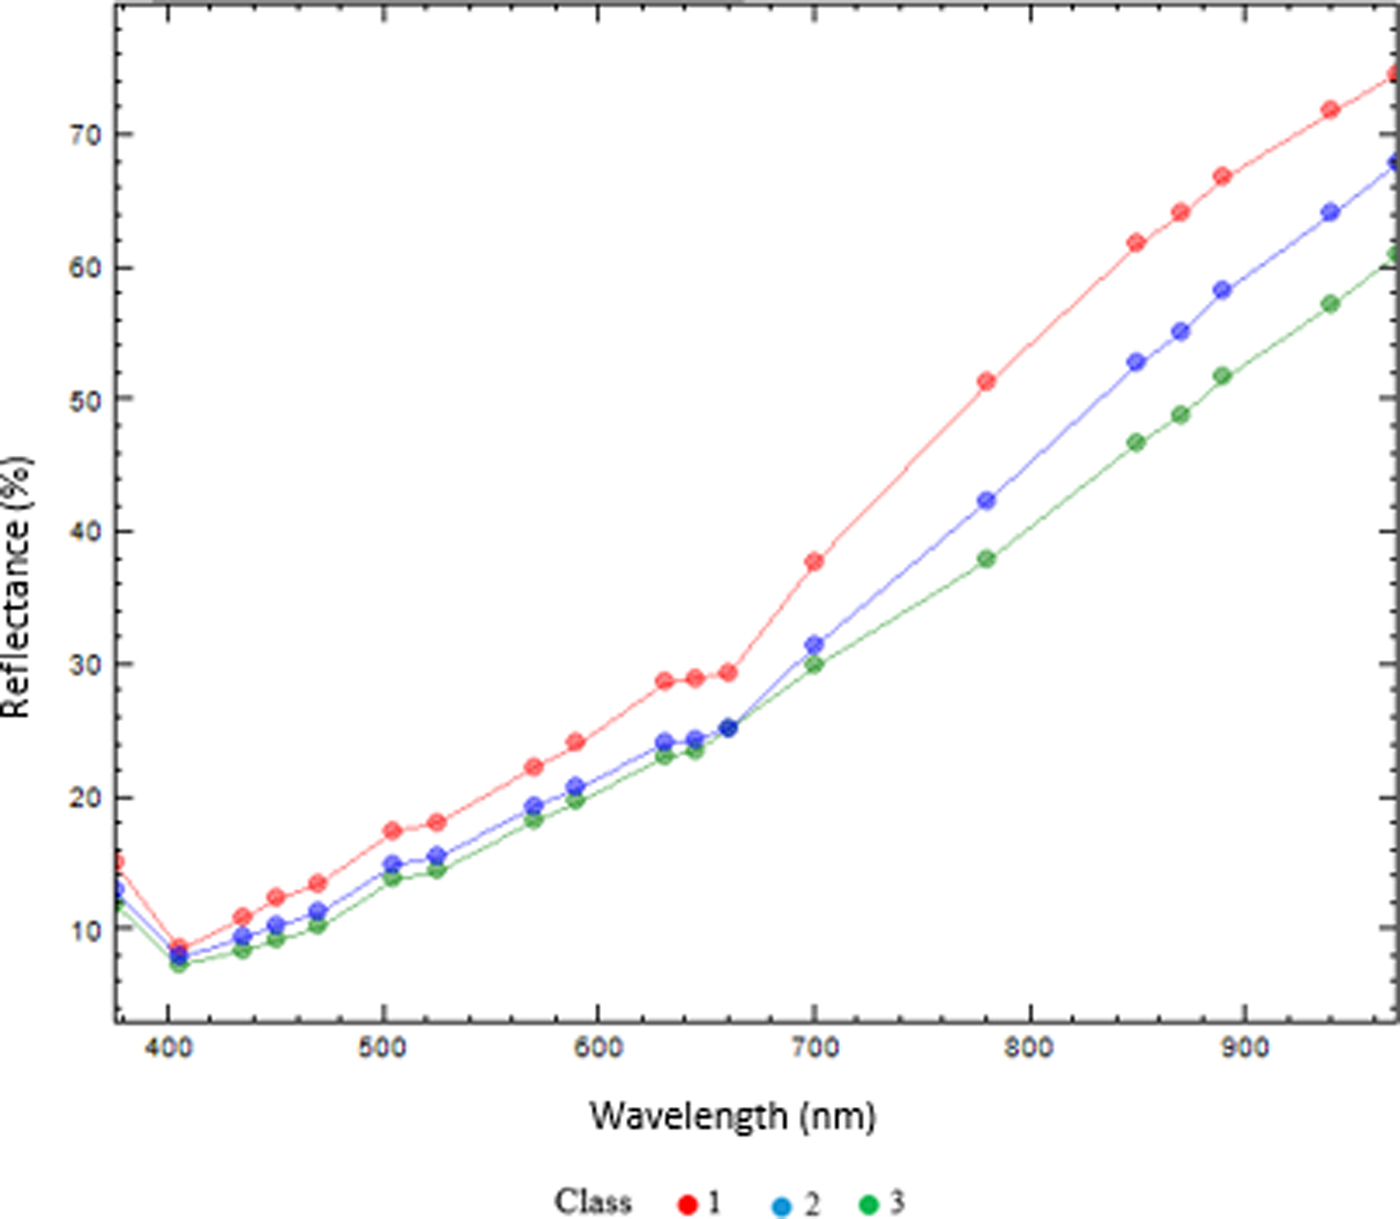
Figure 1. The mean reflectance (%) of the seed coat of sugar beet seeds in three maturity groups [group 1 (red): underdeveloped seeds; group 2 (blue): physiologically developed and ready for harvest; group 3 (green): seeds have passed physiological maturity].
In order to extract information from the multispectral images, 17 variables (representing seed shape, colour and binary features) were evaluated. The RegionMSImean calculates a trimmed mean of MSI transformed pixel values within the blob (each single seed) and RegionMSIthresh returns a relative number of pixels exceeding the threshold of MSI-transformation in blob region based on the nCDA model (derived from all three classes) in their setting. The output of the image analysis was exported for the statistical data analysis. Canonical discriminant analysis (CDA) in SAS (SAS, 9.3) was used as statistical method. CDA is a dimension-reduction technique related to principal component analysis and canonical correlation. By the use of a classification variable and several interval variables, the CDA derives canonical variables (linear combinations of the interval variables) that summarize between-class variation.
For the characterization of differences between the three maturity classes, stacked photos of one seed per maturity class and a selected CT (computed tomography) slice from the 3D X-ray image of the same seeds were acquired (Fig. 2). North Star Imaging Europe, Inspection Services Group provided the CT scans. The seed development and maturity levels are illustrated in Fig. 2A with the least mature seed (class 1) to the left. In parallel with this, the slice of CT scan in Fig. 2B illustrates the internal structure of the seed, which is not yet fully developed and has free cavity space.
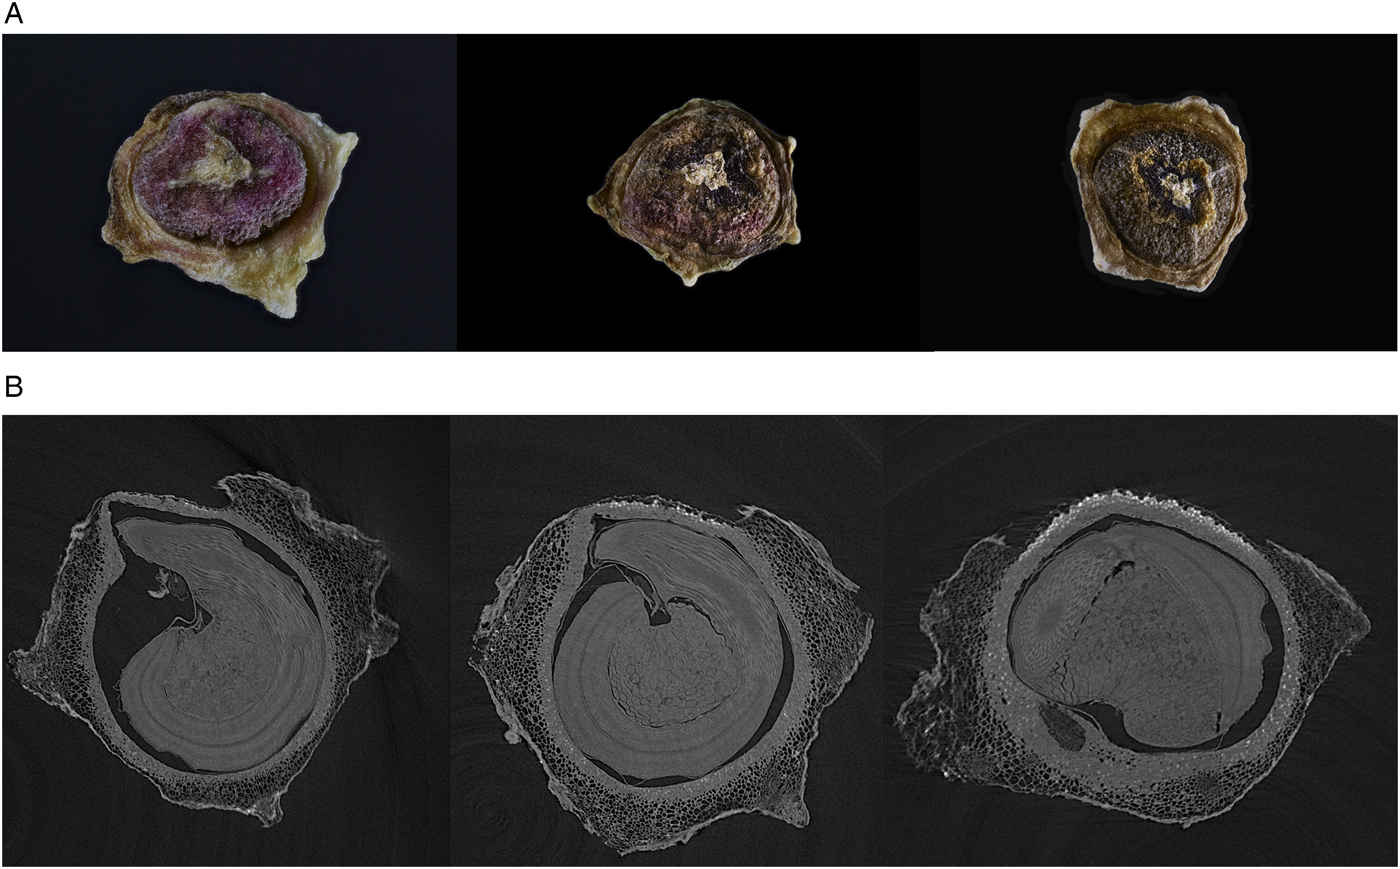
Figure 2. Three maturity groups of sugar beet seed. (A) RGB photo with maturity group 1 to the left; (B) slides of CT scan. Scans provided by North Star Imaging Europe, Inspection Services Group.
The CDA based on the surface characteristics from the MSI analysis classifies the sugar beet seeds into three distinctive classes (Fig. 3), which are identical with the three maturity levels from the CF reference analysis. The collection of seed colour, shape, texture and binary features identified three individual seed classes: (1) undeveloped, (2) physiologically developed seed, ready for harvest, and (3) seed past physiological maturity.

Figure 3. Classification of sugar beet seeds in three maturity groups (1–3) by plotting the can1 versus can2, derived from canonical discriminant analysis. Group 1: underdeveloped seeds, 2: physiologically developed and ready for harvest; 3: seeds have passed physiological maturity.
Figure 3 shows the scatter plot of the examined seeds classified into three classes according to the statistical analysis of the spectral information by plotting two derived variables of CDA (can1 and can2) for each assessed seed. Of the 60 seeds investigated in this study, 57 were classified in accordance with the CF classes, with a resulting 95% accuracy of classification in total. Comparing the MSI of each seed and the related CT scan (Fig. 2B) shows a good relationship between classification by the use of seed surface characteristics and seed development. MSI is therefore suggested as a reliable, non-destructive technology for the classification of seed development in sugar beet. The number of sugar beet seeds available, in particular the class 1, immature seed, did not allow for the characterization of germination capacity in this study. In castor bean (Ricinus cimmunis) MSI provided a model to predict viable from dead seed with an accuracy of 92% (Olesen et al., Reference Olesen, Nikneshan, Shrestha, Tadayyon, Deleuran, Boelt and Gislum2015).
Multispectral imaging technology has been used in many studies for evaluating fruit maturity but not in seeds (Hahn, Reference Hahn2002; Lleó et al., Reference Lleó, Barreiro, Ruiz-Altisent and Herrero2009; Baiano et al., Reference Baiano, Terracone, Peri and Romaniello2012; Rajkumar et al., Reference Rajkumar, Wang, Elmasry, Raghavan and Gariepy2012; Qin et al., Reference Qin, Chao, Kim, Lu and Burks2013). However, evaluating seed maturity by different methods shows that differences in the level of embryo development as a probable effect of insects, other species pollen stimulation, application of synthetic hormones, extreme temperature or inappropriate nutrition condition of plant may affect seed quality (Gustafson, Reference Gustafson1942; Hills, Reference Hills1963; Tekrony and Hardin, Reference TeKrony and Hardin1969).
Seed health
Seed deterioration caused by fungi is an important factor in seed quality during storage, processing and propagation (Barton, Reference Barton, Wrigley, Corke, Seetharaman and Faubion2016). Detection of fungi on seed is performed by inspection of the dry seed, washing tests, incubation methods, embryo count method or seedling symptom tests (Mathur and Kongsdal, Reference Mathur and Kongsdal2003). The preferred test method depends on the location of the spores, inoculum, etc. Furthermore, identification often requires sporulation and also expert knowledge (Lievens and Thomma, Reference Lievens and Thomma2005).
The combinations of the features from multispectral images captured by visual light wavelengths and NIR wavelengths have proved to be useful in the separation of infected seeds from uninfected seeds in several species (Bodevin et al., Reference Bodevin, Larsen, Lok, Carstensen, Jørgensen and Skadhauge2009; Olesen et al., Reference Olesen, Carstensen and Boelt2011; Jaillais et al., Reference Jaillais, Roumet, Pinson-Gadais and Bertrand2015; Vrešak et al., Reference Vrešak, Olesen, Gislum, Bavec and Jørgensen2016). In spinach seeds, multispectral imaging has been used to discriminate uninfected seeds from seeds infected by Stemphylium botryosum, Cladosporium spp., Fusarium spp., Verticillium spp. or Alternaria alternata with 80–100% classification rate (Olesen et al., Reference Olesen, Carstensen and Boelt2011). The potential of using spectral characteristics of specific fungal species is to provide a fast optical screening method for fungal contamination of seeds; however, development of new methods depends on reliable reference methods.
Seeds of barley (Hordeum vulgare) can be infected by a high number of fungi, including pathogens such as Fusarium graminearum, F. culmorum, F. poae, F. avenaceum and Pyrenophora teres but also a high number of non-pathogenic or slightly pathogenic taxa such as Alternaria, Epicoccum, Cryptococcus and Dioszegia. Fusarium spp. is a widely distributed fungus of high relevance in agriculture as it causes yield reductions in a range of agricultural crops, and many species in the genus produce mycotoxins responsible for serious quality deterioration. In malting barley, Fusarium also has a negative effect by causing gushing in beer (Christian et al., Reference Christian, Titze, Ilberg and Jacob2011).
With the aim of comparing multispectral image analysis data with DNA-based data from infected barley seeds, approximately 200 barley seeds assumed to be infected by fungi from different origins (Europe) and years (2012–2016) of cultivation were tested by multispectral analysis and by next generation sequencing (NGS) of the ITS (Internal Transcribed Spacer) from total DNA (Nicolaisen et al., Reference Nicolaisen, Justesen, Knorr, Wang and Pinnschmidt2014).
Prior to NGS evaluation, multispectral images of all the barley seeds were captured by a VideometerLab multispectral imaging system (Videometer A/S). A multispectral image consisted of images of 19 different wavelengths from visible to the near-infrared region in a range from 375 to 970 nm. Spectral information from the surface of seeds may be combined with information about size, shape and texture of the seeds for detection of fungal infection. The MS images of the barley seeds were analysed by an nCDA (Olesen et al., Reference Olesen, Nikneshan, Shrestha, Tadayyon, Deleuran, Boelt and Gislum2015; Shrestha et al., Reference Shrestha, Deleuran, Olesen and Gislum2015) to discriminate fungi. A more detailed description of nCDA data analysis can be found in Shrestha et al. (Reference Shrestha, Topbjerg, Ytting, Skovgaard and Boelt2018) and Olesen et al. (Reference Olesen, Nikneshan, Shrestha, Tadayyon, Deleuran, Boelt and Gislum2015).
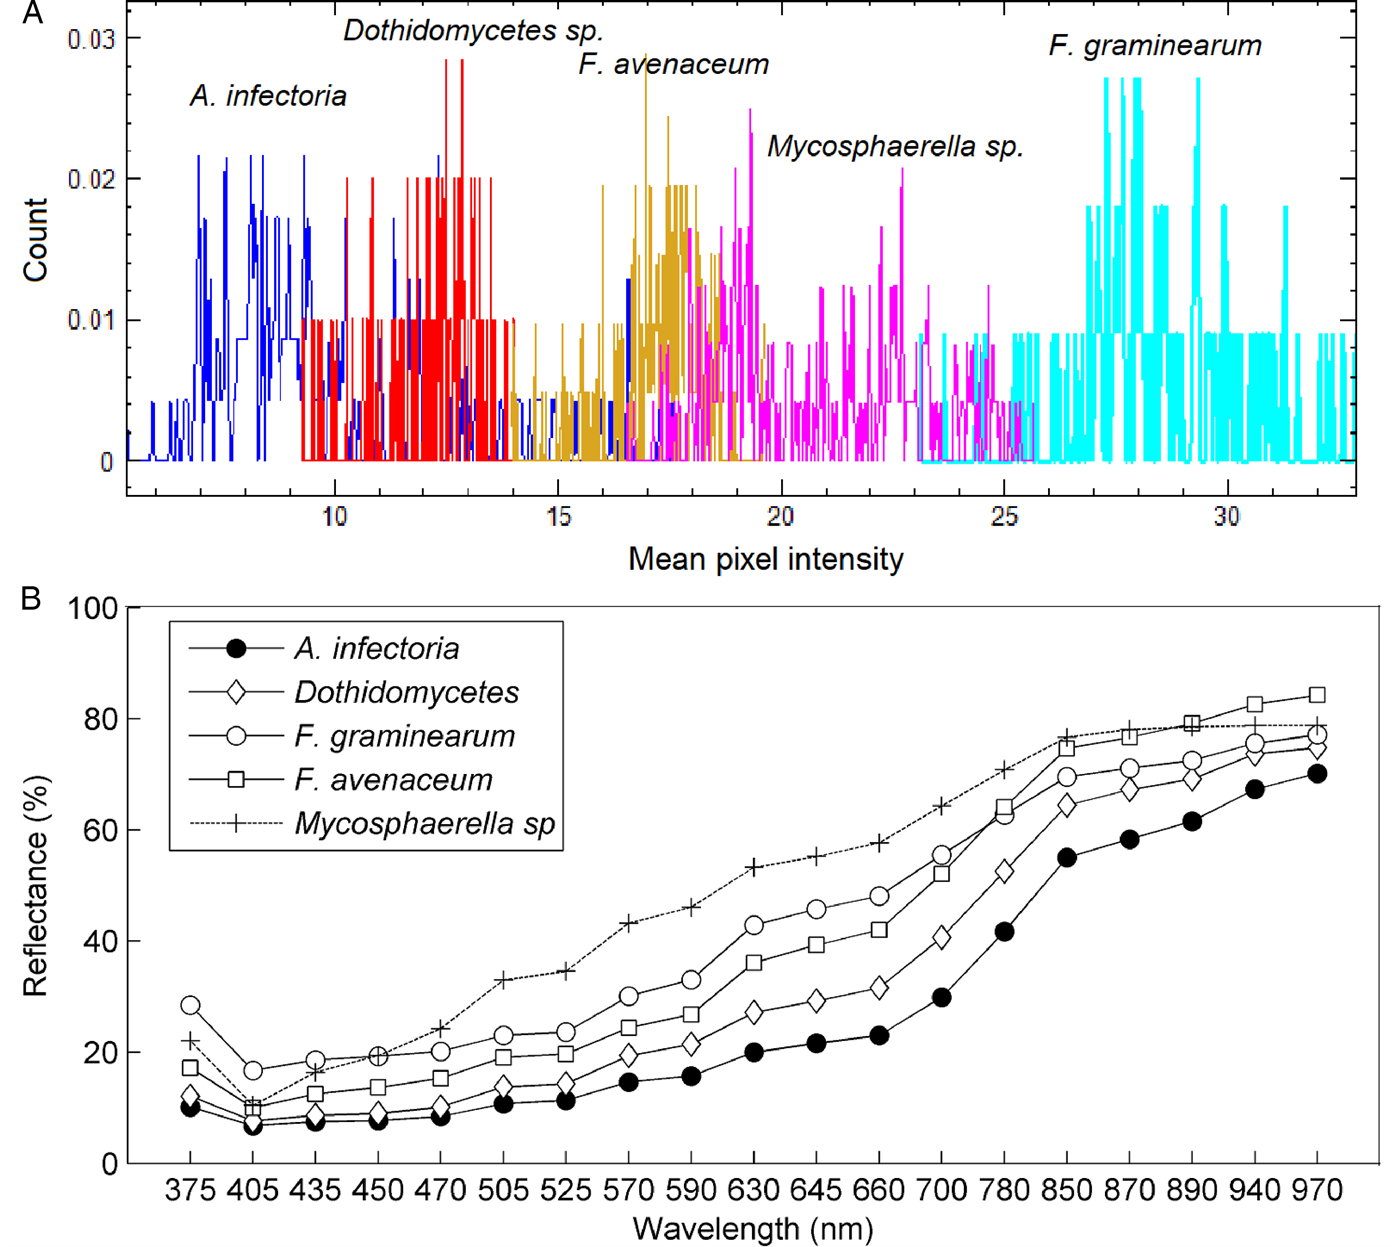
From the NGS, approximately 2–4000 reads were obtained from each seed and these were subsequently identified to species level. The main fungal genera identified were Fusarium, Pyrenophora, Epicoccum, Didymella, Alternaria, Bipolaris and Microdochium. The fungal composition and quantities on each seed varied significantly. Some seeds were infected mainly by a single fungus and some were infected by multiple fungi. A total of 48 seeds primarily infected by a single fungus species viz. Alternaria infectoria, Dothidomycetes sp., Fusarium graminearum, Fusarium avenaeum and Mycosphaerella tassiana were used for the multivariate data analysis to identify the causal fungal species.
The barley seeds infected with the different fungal species showed considerable variation in mean pixel intensities (Fig. 4a). The seeds infected with F. graminearum and Mycosphaerella tassiana had distinct differences in mean pixel intensities (Fig. 4a). The remaining infected seeds also showed variations, although the mean intensities of groups overlapped each other. A similar trend observed in Fig. 4b was that the spectral signatures of the infected seeds had variation in mean reflectance. The variation in spectral signatures showed the possibility of developing a chemometric method for separating the infected seeds.

Figure 4. Mean pixel intensity (a) and mean reflectance (b) of barley seeds infected with Alternaria infectoria, Dothidomycetes sp., Fusarium graminearum, Fusarium avenaceum and Mycosphaerella tassiana.
An nCDA analysis involving five classes (i.e. each fungus class) of infected seeds showed differences among the infected seeds (Fig. 5). Each pixel of an nCDA-transformed image represented a score calculated by the nCDA model. It determined the score in a way that maximized variation between the classes and reduced variation within a class (Olesen et al., Reference Olesen, Nikneshan, Shrestha, Tadayyon, Deleuran, Boelt and Gislum2015). The nCDA model showed contrasting differences between Fusarium spp. and others (Fig. 5). The nCDA model did not show significant differences between the two Fusarium spp.; however, a colour feature CIELab L*, which relates to the brightness/darkness, showed a tendency of separation between them (Fig. 6). The results suggest the possibility of using multispectral imaging for identifying different fungal species in barley seeds. However, the nCDA model can be significantly enhanced by using additional steps such as hierachical/step-wise factorial classification or pairwise comparisons (Shrestha et al., Reference Shrestha, Deleuran, Olesen and Gislum2015; Kimuli et al., Reference Kimuli, Wang, Lawrence, Yoon, Ni and Heitschmidt2018) to acquire distinctive discrimination among the fungal species. For instance, a step-wise classification between the two Fusarium species can significantly increase the separation, as shown in Fig. 7.
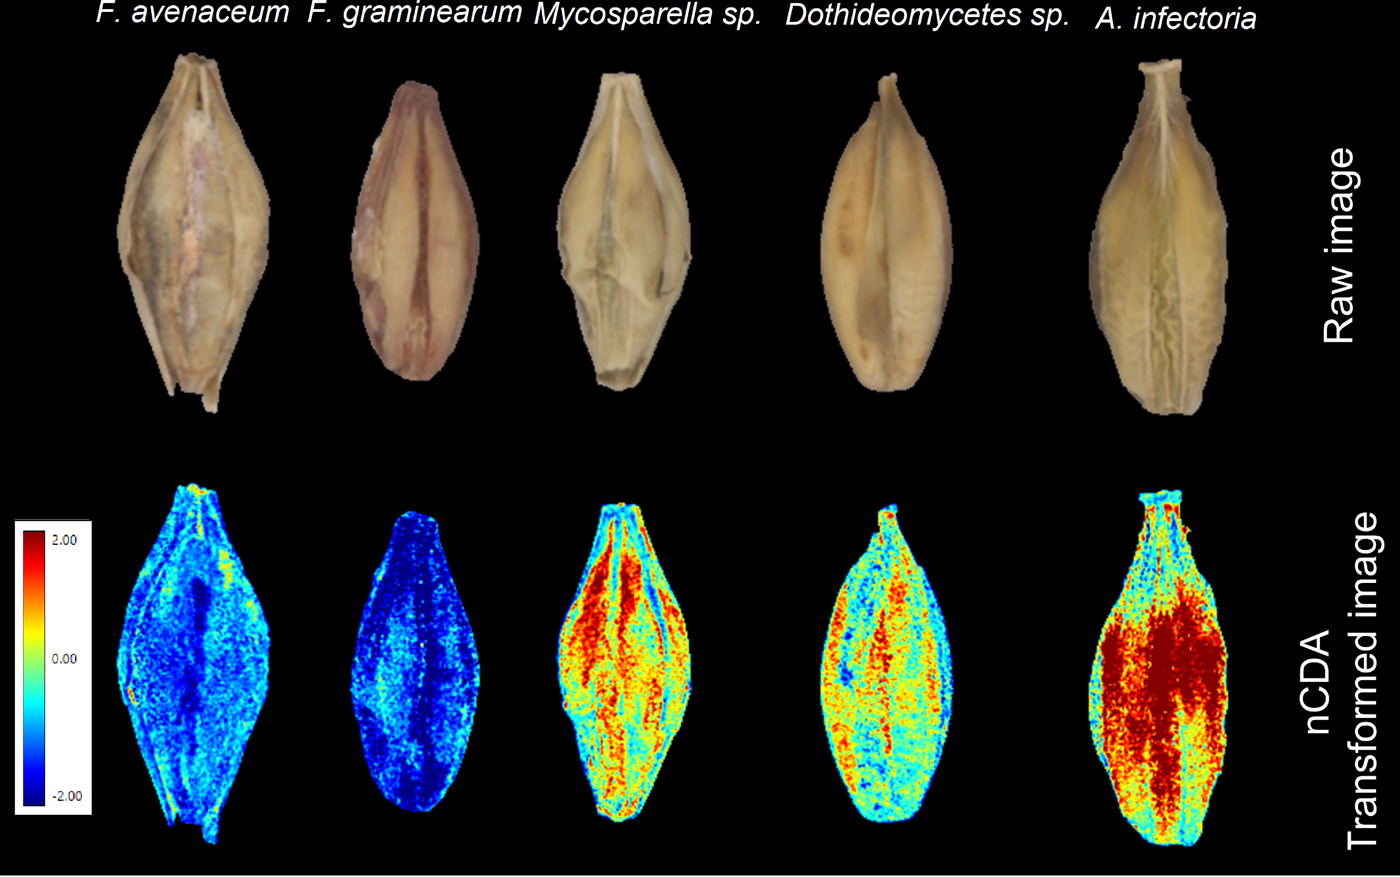
Figure 5. Raw images of the barley seeds and corresponding transformed image by the nCDA model.

Figure 6. nCDA scores plot showing the clustering of the barley seeds infected by the five different fungi species. Each score is a mean intensity of the nCDA transformed seed image.

Figure 7. A stepwise nCDA classification of Fusarium avenaceum and Fusarium graminearum (top: raw image; bottom: subsequent transformed image).
A proper validation of a developed model is essential for a multivariate image analysis to assess the robustness and reproducibility of the results (Shetty et al., Reference Shetty, Min, Gislum, Olesen and Boelt2011). However, the nCDA model could not be validated due to availability of only few and disproportionate samples of the five fungal infected seeds. Previous studies have shown the potential of multispectral imaging in detecting or identifying a specific fungus species (Bauriegel et al., Reference Bauriegel, Giebel, Geyer, Schmidt and Herppich2011; Dammer et al., Reference Dammer, Möller, Rodemann and Heppner2011; Jaillais et al., Reference Jaillais, Roumet, Pinson-Gadais and Bertrand2015; Leplat et al., Reference Leplat, Mangin, Falchetto, Heraud, Gautheron and Steinberg2018) in wheat seeds with high accuracy. The study dealt with identifying several fungal species in barley seeds. The seeds examined had a diverse background such as genetic (different varieties), environment (year and region of cultivation) and ageing apart from the fungal infection. These factors have an influence on the discriminatory ability of the imaging system (Shrestha et al., Reference Shrestha, Knapič, Žibrat, Deleuran and Gislum2016). Considering this, the results obtained are promising and show the prospect of developing a method that can identify several fungal infections in seeds simultaneously.
Other applications of multispectral imaging
Varietal purity is a very important aspect in plant breeding programmes, seed production, genebank management and in the trading of seed in general. Therefore, any non-destructive, fast and reliable method for the identification and discrimination of varietal purity will be of interest. Recent studies have shown the potential of MSI combined with chemometric methods for the varietal identification of transgenic Bacillus thuringiensis rice seeds (Oryza sativa) and the discrimination of two varieties, respectively conventional and glyphosate-resistant soybean seeds (Glycine max) and their hybrid descendants (Liu et al., Reference Liu, Liu, Lu, Chen, Yang and Zheng2014, Reference Liu, Liu, Lu, Chen, Chen, Yang and Zheng2016). In tomato, Shrestha et al. (Reference Shrestha, Deleuran, Olesen and Gislum2015) examined eleven varieties/accessions either all together or pairwise with their offspring for varietal identification and discrimination. By the use of MSI and multivariate data analysis the classification accuracy obtained was between 100 and 86%. International genebanks handle a large number of seed accessions and the evaluation of seed phenotype is usually done by visual inspection. Seed accessions are evaluated on arrival to the genebank to determine if the accession is new or already exists in store. Furthermore, the phenotype is evaluated when accessions have been regenerated to assure that the newly harvested seed is true to type to the stored sample. These procedures are very time consuming and require highly skilled and patient staff. Hansen et al. (Reference Hansen, Hay and Carstensen2015) demonstrated that MSI could classify 20 diverse rice varieties with 93% accuracy.
A further application of MSI is the determination of insect damage (Ma et al., Reference Ma, Wang, Liu, Lu, Chen, Chen, Yang and Zheng2015; Sendin et al., Reference Sendin, Manley and Williams2018) and other crop and weed seeds (Sendin et al., Reference Sendin, Manley and Williams2018) have recently been documented.
Concluding remarks
From the applications presented and reviewed, it is concluded that MSI has a potential for seed quality assessment, in particular for those components associated with surface structure and chemical composition, seed colour, morphology and size. MSI is a non-destructive, reliable and fast tool with a potential for the detection and characterization of fungi, insect damage, varietal purity and components associated with seed development and quality aspects.