


Introduction
Blood glucose level (BGL) is a core vital sign that is routinely performed by paramedics when assessing patients in the out-of-hospital setting. Reference Strote, Cloyd, Rea and Eisenberg1 While BGL is most commonly measured in patients experiencing suspected hyper- or hypo-glycemic episodes, it plays an important role in determining the broader physiological status of patients presenting with medical illness or major traumatic injury.
In the context of out-of-hospital care, paramedics most commonly measure BGL via a “finger-prick” technique in which a lancet is used to pierce the skin superficially on the tip of a finger. A small sample of capillary blood is squeezed from the finger and applied to an electrode, or “test strip,” then inserted into a calibrated point-of-care, hand-held glucometer. These glucometers are usually designed and engineered to analyze samples of blood of capillary origin and are capable of returning a BGL measurement within seconds. An alternative approach, less commonly seen in practice, involves testing BGL using blood of venous origin drawn from a vein after an intravenous (IV) cannula has been inserted. Reference Funk, Chan, Lutz and Verdile2 Anecdotally, this practice occurs when IV access is already in place, or will be in place, before a “finger-prick” BGL can or has been taken, often with the rationale that this approach will cause less discomfort to the patient. A concern with this approach relates to the accuracy of the BGL measurement arising from venous blood when analyzed using a capillary sample calibrated glucometer. Secondary to this is whether any such inaccuracy could have clinically significant impacts on subsequent decision making.
The aim of this prospective study was to compare mean difference in BGL between venous and capillary blood from healthy volunteers when measured using a capillary-based, hand-held, point-of-care glucometer.
Methods
Study Design
The study utilized a prospective comparative observational design.
Setting
The study was conducted within the School of Science and Health at Western Sydney University, Penrith, New South Wales, Australia.
Participants and Recruitment
Participants were non-fasted students or staff at Western Sydney University, constituting a healthy volunteer population. In order to be eligible for inclusion, participants had to be 18 years or older and be a current student or staff member at the University. Participants were excluded if they were aged greater than 65 years, taking anticoagulant medication, or were immunosuppressed due to medication or illness.
Participants were recruited by posters, flyers, and an email containing the participant information form.
Sample Size Calculations
Previous research was inconclusive, but some results indicated a potential difference of approximately 1.0mmol/l may exist between venous and capillary samples. With acceptance of Type 1 error (alpha) at 0.5% and Type 2 error (beta) at 20.0%, a sample size of 36 participants was required to provide the appropriate statistical power to detect a difference of 1.0mmol/l (SD = 1.5), should such a difference exist. Considering a failure or dropout rate of 10.0%, a sample size of 40 was identified.
Data Collection and Process Flow
Data were collected from February through March 2018. Once consent was confirmed and eligibility determined, data were collected from each participant over a period of 15 minutes. A 20-gauge IV cannula was inserted into the dorsal aspect of the hand or cubital fossa on the anterior aspect of the elbow, through which 0.5ml of venous blood was extracted and applied directly to the glucometer electrode for measurement. Immediately following this, a small lancet was used to extract a capillary sample from a fingertip of the same participant, which was applied directly to a separate glucometer electrode. Prior to lancing, the finger was cleaned with alcohol and left to air-dry for 30 seconds before extraction was performed. The BGL measurement was undertaken using a calibrated point-of-care glucometer designed to analyze capillary samples that had passed system accuracy testing according to DIN EN ISO 15197 (Optimum Xceed; Abbott Diabetes Care Inc.; Chicago, Illinois USA). The manufacturer of the glucometer had no involvement in the research.
Data Analysis
Data analysis was performed using Microsoft Excel 2010 (Microsoft Corp.; Redmond, Washington USA). Descriptive statistics were generated to describe participant demographics (age and gender) and mean with standard deviation (SD) or median with inter-quartile range (IQR) for normal and non-normally distributed data, respectively. Given that the samples being compared in each research question came from the same participant, these were deemed to be paired samples. To compare differences in mean values between sample groups, a paired t-test was used, with statistical significance established at a probability of .05. An a priori decision was made that a difference of 1.0mmol/l would constitute a clinically significant difference. Pearson’s correlation coefficient was used to assess correlation between venous and capillary BGL.
Ethics Approval
Approval to conduct the study was granted by the Western Sydney University Human Research Ethics committee.
Results
There were 41 participants who consented to participate and on whom data collection commenced. Of these, five were excluded from the final analysis as either a venous or capillary sample was not collected, thus not constituting complete paired samples. The final analysis was therefore performed using paired samples from 36 participants.
Fifty-three percent of participants were female (19/36), and the mean age was 26 years (SD = 8.3).
The BGL values were similar between the two groups. The capillary group had a range of 4.3mmol/l, with the lowest value being 4.4mmol/l and 8.7mmol/l the highest. The venous group had a range of 2.7mmol/l, with the lowest value being 4.1mmol/l and 7.0mmol/l the highest.
For the primary research question, the mean BGL for the venous sample group was 5.3mmol/l (SD = 0.6), compared to 5.6mmol/l (SD = 0.8) for the capillary group. This represented a statistically significant difference of 0.3mmol/l (P = .04), but it did not reach the a priori established point of clinical significance (1.0mmol/l).
The correlation scatter plot is shown in Figure 1. Pearson’s correlation coefficient for capillary versus venous indicated moderate correlation (r = 0.42).
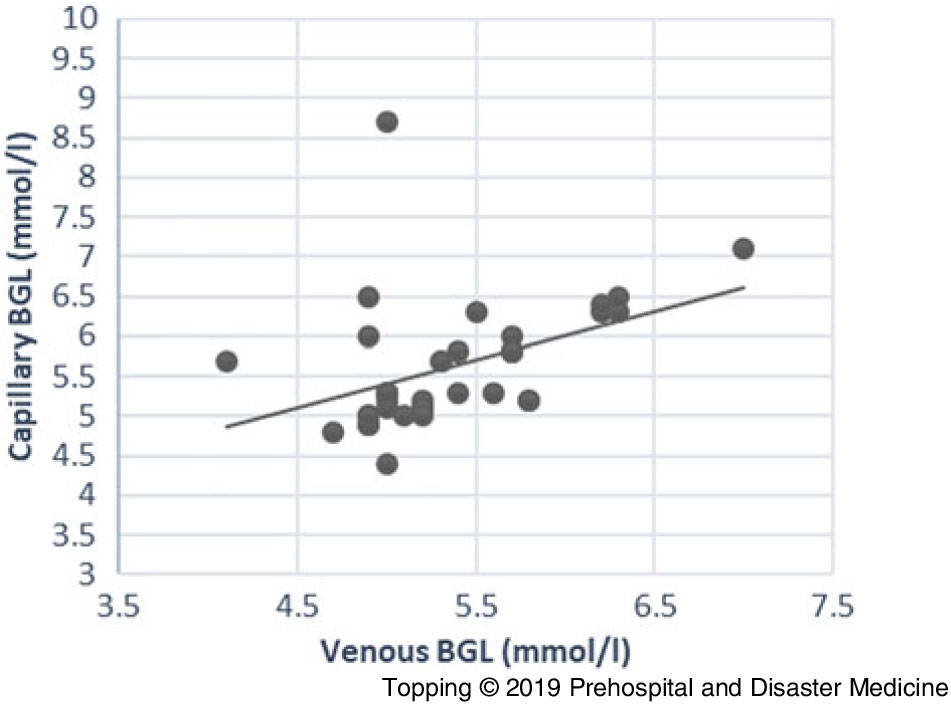
Figure 1. Correlation Scatter Plot for Capillary versus Venous BGL (n = 36 Paired BGLs). Abbreviation: BGL, blood glucose level.
Discussion
This prospective observational study comparing BGL taken from venous samples to those from capillary samples when measured using capillary-based, hand-held, point-of-care glucometry has demonstrated a small but statistically significant difference in value. However, the demonstrated difference did not constitute a clinically significant difference based on the a priori determined 1.0mmol/l clinical significance threshold.
The finding of no clinically significant difference is consistent with studies by Boyd, et al Reference Boyd, Leigh and Stuart3 and Funk, et al. Reference Funk, Chan, Lutz and Verdile2 Boyd, et al reported a difference of 0.33mmol/l (capillary 7.66mmol/l versus venous 7.99mmol/l) in their 2005 study involving 20 adult patients in an emergency department. Reference Boyd, Leigh and Stuart3 That finding was statistically significant, but did not in their view meet the threshold for clinical significance. When comparing results of that study with the present one, the different patient populations must be noted; Boyd, et al sampled from non-critically unwell emergency department patients while the present study’s participants were healthy volunteers in a non-clinical setting. In their 2005 study of 97 healthy adult volunteers, using a study design and population very similar to the present study, Funk, et al reported a difference of 0.29mmol/l (capillary 5.8mmol/l versus venous 6.09mmol/l). Reference Funk, Chan, Lutz and Verdile2 A larger mean difference was found by Kumar, et al in 2004 Reference Kumar, Sng and Kumar4 who reported a glucometer-measured difference of 0.93mmol/l in a comparison of venous versus capillary BGL in a population of 170 healthy army volunteers in Singapore. This difference was closer to the threshold for clinical significance used in the present study (1.0mmol/l). While there is consistency amongst these three studies involving adult participants, greater variance in results has been reported when venous versus capillary BGL is measured in special populations, such as neonates, where measured BGLs include hypo- and hyper-glycemic readings, or where participants had current acute illnesses in a clinical setting. Reference Atkin, Dasmahapatra, Jaker, Chorost and Reddy5–Reference Weiner, Faustich, Burns, Fraser, Whitaker and Klugman8 Application of these current data to populations other than adults should therefore be avoided.
This issue of whether the participants in these studies are healthy volunteers or are patients receiving care for acute illness must be highlighted, as several studies have reported conflicting results. Previous research has described clinically significant differences between venous and capillary BGL in patients with various acute illness or abnormal physiology. In a 1991 study of 64 patients, Atkins, et al explored the impact of hypotension on venous and capillary BGL measurement. Reference Atkin, Dasmahapatra, Jaker, Chorost and Reddy5 They measured venous and capillary BGL via glucometer and laboratory blood test, comparing results in a group of hypotensive patients to a normotensive group, and found capillary BGL to be inaccurate in the hypotensive group. More recently in 2015, Yaraghi, et al compared venous to capillary BGL measurements in a group of 98 hospital patients with coma; they reported no significant difference. Reference Yaraghi, Mood and Dolatabadi6
With regard to correlation, the present study found weak to moderate correlation between the venous and capillary groups (coefficient = 0.42). In comparison, Funk, et al reported poor correlation (r = 0.24) in their similar study of healthy volunteers with BGLs largely within normal ranges and in whom acute illness was not present, Reference Funk, Chan, Lutz and Verdile2 and Kumar, et al moderate correlation (r = 0.5) in their population of 170 healthy army soldier volunteers. Reference Kumar, Sng and Kumar4 Again, the healthy status of participants in these studies and the normal ranges of the BGLs measured should be highlighted, as higher correlation has been reported by Yaraghi, et al in a population of acutely unwell patients (r = 0.93). Reference Yaraghi, Mood and Dolatabadi6
In totality, considering these present results and those of the research conducted previously, it would be appropriate to suggest that in the context of healthy, non-fasted people in a non-clinical setting, venous or capillary blood samples could be used interchangeably to measure BGL using a point-of-care glucometer engineered for capillary blood testing. However, the moderate correlation result suggests the optimal approach would be to use capillary blood for point-of-care testing. This would be particularly applicable in a clinical setting, where patients will in most instances be unwell to some level of acuity or have deranged physiology; while not seen in the present study, the existing evidence indicates greater differences in measurement between venous and capillary samples. Defaulting to capillary sampling and measurement would be recommended in that context.
Limitations
There are several limitations in light of which the results presented herein should be considered. The study population were healthy volunteers and the study was conducted in a non-clinical context. The healthy status of participants resulted in relatively narrow BGL ranges and none within hypo- or hyper-glycemic ranges, making generalization of these results to a clinical population with acute illness unreliable. A single measurement for venous and capillary samples was performed for each participant. It is possible that measurement error could occur at the machine level in some samples; however, the reported error ranges described in the specifications of the glucometer are minimal and most likely not have impacted significantly on the results of the study. The International Organization for Standardization (ISO; Geneva, Switzerland), against which point-of-care glucometers are tested, ISO 15197, indicates that there should +/- 0.8mmol/l for 95% of measurements taken. Reference Freckmann, Schmid, Baumstark, Rutschmann, Haug and Heinemann9
Conclusion
In healthy, non-fasted people in a non-clinical setting, a statistically significant, but not clinically significant, difference was found between venous- and capillary-derived BGL when measured using a point-of-care, capillary-based glucometer. Correlation between the two was moderate. In this context, using venous samples in a capillary-based glucometer is reasonable providing the venous sample can be gathered without exposure of the clinician to risk of needle-stick injury. In clinical settings where physiological derangement or acute illness is present, capillary sampling would the optimal approach.
Conflicts of interest
none

