Geopolymers are alkali-activated (alumino)silicate cementitious materials that have been used in construction materials, fire-resistant materials and heavy-metal adsorption and solidification (Davidovits, Reference Davidovits1991; Temuujin et al., Reference Temuujin, Minjigma and Rickard2009; Shaqour et al., Reference Shaqour, Ismeik and Esaifan2017; Ng et al., Reference Ng, Alengaram, Wong, Mo, Jumaat and Ramesh2018; Esaifan et al., Reference Esaifan, Warr, Grathoff, Meyer, Schafmeister, Kruth and Testrich2019; Rasaki et al., Reference Rasaki, Zhang, Guarecuco, Tiju and Yang2019; Padilla et al., Reference Padilla, Guzman, Molina and Poveda-Jaramillo2020). The typical manufacturing process of geopolymers involves the addition of an alkaline activator (a mixed solution of sodium or potassium hydroxide and sodium or potassium silicate) to a poorly crystallized or amorphous aluminosilicate material such as fly ash or metakaolin (MKn) and subsequent mixing and curing at a moderate temperature (20–95°C). Geopolymers present a three-dimensional network structure that is composed of SiO4 and AlO4 tetrahedral units linked together by bridge oxygen atoms. The empirical formula for geopolymers is as follows:

where M is a cation such as potassium (K) or sodium (Na), n is the degree of polycondensation, z is 1–3 and w is the amount of binding water (van Deventer et al., Reference van Deventer, Provis and Duxson2007). According to the z value, geopolymers are classified as poly(sialate) (PS), poly(sialate-siloxo) (PSS) or poly(sialate-disiloxo) (PSDS) (Davidovits, Reference Davidovits2008).
Na-PS presents a sodalite cage structure formed by connected single four- and six-membered rings (Davidovits, Reference Davidovits2008), from which hydroxysodalite, faujasite and zeolite A are built (Buchwald et al., Reference Buchwald, Zellmann and Kaps2011). Therefore, geopolymers may be regarded as zeolite precursors, whereby hydroxysodalite, faujasite and zeolite A can form in Na-geopolymers with lower Si/Al ratios (Takeda et al., Reference Takeda, Hashimoto and Iwata2012; Duan et al., Reference Duan, Li and Lu2015). In recent years, the in situ preparation of zeolites by geopolymerization has received much attention because it is a simple and low-cost process compared with the traditional hydrothermal method (Ge et al., Reference Ge, Tang, Cui, He and Zhang2014; Liguori et al., Reference Liguori, Aprea, Roviello and Ferone2019). However, K-geopolymers are less suitable for zeolite formation because K favours the formation of less ordered structures, favouring the formation of geopolymeric networks, which are amorphous (Duxson et al., Reference Duxson, Fernández-Jiménez, Provis, Lukey, Palomo and van Deventer2007a; Hu et al., Reference Hu, Bernsmeier, Grathoff and Warr2017). Therefore, K-zeolite formation has been reported rarely in previous studies on geopolymers. de Moraes Pinheiro et al. (Reference de Moraes Pinheiro, Font, Soriano, Tashima, Monzó, Borrachero and Payá2018) observed that zeolite K-I (K2Al2Si2O8⋅3.8H2O) and potassium gismondine (K2Al2Si2O8⋅3H2O) formed in KOH-activated geopolymers after curing at 65°C for 7 days using blast furnace slag as the starting material. Zeolite K-I was also observed in clay-based geopolymers activated with 5 M KOH solution after curing for 4 months, while K-chabazite formed after such curing for 1 year (El Hafid & Hajjaji, Reference El Hafid and Hajjaji2015). In addition, zeolite K, zeolite V, zeolite X and zeolite F were identified in KOH-activated geopolymers immersed in NaCl solutions after ageing for 28 days (Fu et al., Reference Fu, Ye, Zhu, Fang and Zhou2020). From the aforementioned studies, it is concluded that a long curing time is necessary for geopolymer transformation into K-zeolite.
Cadmium (Cd) is ranked as the seventh most toxic heavy metal among environmental pollutants by the Agency for Toxic Substance and Disease Registry (ASTR 2017). Industrial development and intensive agriculture release large amounts of Cd, resulting in the Cd contamination of soil. Cd-contaminated soils are a global environmental concern, causing damage not only to human health and ecology, but there are also significant economic implications with respect to reclamation and restoration costs (Semenzin et al., Reference Semenzin, Critto, Carlon, Rutgers and Marcomini2007). In China, Cd is the most widespread heavy-metal pollutant in soils(Hu et al., Reference Hu, Shao, Ni, Fu, Hu and Zhou2020); urgent remediation is required. The technology of in situ immobilization with amendments remediates soils contaminated by heavy metals (Amanullah et al., Reference Amanullah, Ping, Li and Zhang2015). Zeolite is a valuable amendment for heavy-metal immobilization in soils because of its large specific surface area and ion-exchange capacity (Ansari Mahabadi et al., Reference Ansari Mahabadi, Hajabbasi, Khademi and Kazemian2007; Shi et al., Reference Shi, Shao, Li, Shao and Du2009; Zhao et al., Reference Zhao, Huang, Liu, Hu, Zhao and Wang2020). In addition, zeolite is also a potential soil conditioner that can improve soil fertility, infiltration and hydraulic conductivity and control soil pH (Szerement et al., Reference Semenzin, Szatanik-Kloc, Jarosz, Bajda and Mierzwa-Hersztek2021). K-zeolite is more suitable than Na-zeolite for heavy-metal immobilization in paddy soils because it may serve as an effective slow-release potassium fertilizer (Zwingmann et al., Reference Zwingmann, Mackinnon and Gilkes2011; Najafi-Ghiri et al. Reference Najafi-Ghiri2014); Na+ is not considered to be an essential nutrient and its excess adversely affects the growth of plants (Hasegawa et al., Reference Hasegawa, Bressan and Pardo2020; Zhu, Reference Zhu2001). Investigation of the in situ synthesis of K-zeolite by geopolymerization with a short curing time and its application to remedy Cd-contaminated paddy soils was therefore deemed worthwhile.
In geopolymer and zeolite synthesis, the OH– ion acts as a reaction catalyst and the alkaline metal cation acts as a structure-forming element (Duxson et al., Reference Duxson, Mallicoat, Lukey, Kriven and van Deventer2007b). Suzuki et al. (Reference Suzuki, Wakihara, Itabashi, Ogura and Okubo2009) studied the cooperative effect of Na+ and K+ in forming a framework of ferrierite zeolite and concluded that K+ contributed to the formation of the building units of ferrierite, while Na+ contributed to the final crystallization so as to order the building units in a (Na, K)-system. Based on this observation, the present work attempts to synthesize zeolites using a KOH/NaOH mixed alkaline solution as an activation agent and a curing time of 24 h for geopolymerization. Metakaolin was selected as the starting material because of its high reactivity and purity compared to other materials such as fly ash, slag and natural clay (Zhang et al., Reference Zhang, Sheng, Wang and Xu2012; Autef et al., Reference Autef, Joussein, Poulesquen, Gasgnier, Pronier and Sobrados2013). The factors that influence zeolite formation were investigated using X-ray diffraction (XRD) analysis, and then K2O/M2O–H2O/SiO2 and K2O/M2O–OH–/SiO2 binary zeolite crystallization phase diagrams were obtained. Finally, the immobilization potential of Cd(II) in paddy soil of the respective geopolymer-supported zeolites was evaluated.
Materials and methods
In situ synthesis of zeolites transformed from geopolymer precursors
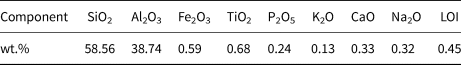
The MKn raw material was purchased from JingYang Kaolin Company, Shanxi Province, China. The chemical composition of MKn as determined by X-ray fluorescence (XRF; PANalytical B.V. Company Axios Advanced, The Netherlands) is listed in Table 1. The cadmium nitrate (Cd(NO3)2), sodium hydroxide (NaOH) and potassium hydroxide (KOH) used in this study were analytical reagent (AR) grade and were purchased from Sinopharm Chemical Reagent Co., Ltd (China). NaOH and KOH were dissolved in deionized water to obtain NaOH/KOH mixed-alkaline solutions.
Table 1. Chemical composition of MKn as determined by XRF analysis.

LOI = loss on ignition.
Deionized water, MKn and the mixed-alkaline solution were mixed thoroughly with a NJ-160A mechanical blender (Wuxi Jianyi Experiment Co., Ltd, China), producing a homogeneous paste. The molar composition of the paste was: xK2O:yNa2O:SiO2:0.39Al2O3:zH2O (the Al2O3/SiO2 molar ratio of MKn was 0.39 as calculated from Table 1). Then the paste was poured into 20 mm × 20 mm × 20 mm steel cubic moulds and cured at 80°C at a relative humidity of 95 ± 5% for 24 h. Lastly, the samples were demoulded and ground to powders below 300 mesh with a pestle and mortar for characterization.
Sample characterization
The mineralogical composition of the synthesized materials and MKn was determined by XRD using a Bruker AXS D8 Advance diffractometer (Germany) with a graphite monochromator, using Cu-Kα radiation, 40 kV and 40 mA in the range 5–90°2θ with a scanning speed of 2° min–1. The morphology of the samples was characterized with a SU8010 field emission scanning electron microscope (FESEM; Hitachi Company, Japan) at an acceleration voltage of 2 kV. Uncoated samples were used. Fourier-transform infrared (FTIR) spectra of the synthetic products and MKn were collected with resolution of 2 cm–1, in the spectral range of 400–4000 cm–1 on a Thermo Nicolet Nexus spectrometer (USA), using the KBr pellet technique. The specific surface area and pore volume of the synthesized samples were determined with a Micromeritics ASAP 2020 instrument by N2 adsorption/desorption at 77 K on materials degassed at 200°C for 10 h prior to analysis. The micropore (pore size <2 nm) volume (V mic) and micropore area (S mic) were calculated using the t-plot method. The mesopore (2 nm < pore size < 50 nm) volume (V mes) was calculated with the Barrett–Joyner–Halenda (BJH) method. The specific surface area (S BET) values were determined using the Brunauer–Emmet–Teller (BET) method.
Construction of binary zeolite crystallization phase diagrams
Based on the XRD traces, the K2O/M2O–H2O/SiO2 binary zeolite crystallization phase diagram (namely the zeolite types as functions of the K2O/M2O and H2O/SiO2 molar ratios) and the K2O/M2O–OH–/SiO2 binary zeolite crystallization phase diagram (namely the zeolite types as functions of the K2O/M2O and OH–/SiO2 molar ratios) were constructed.
Immobilization of Cd(II) in paddy soil
The uncontaminated paddy soil was collected from 20 cm of topsoil in the suburb of Yiyang, Hunan Province, using a five-point sampling mode, then mixed and air dried. The <2 mm fraction was artificially polluted with aqueous solutions of Cd(II) in the form of Cd(NO3)2. The soil samples were mixed thoroughly and cultivated under natural conditions for 20 days, maintaining a water content of 70%. The dosage of Cd(II) was 5 mg kg–1.
Soil pH was determined using a PHS-3C pH meter with a soil/water ratio of 1:2.5 (w/v). The available potassium in the soil was extracted with ammonium acetate (pH = 7) based on the Chinese Standard NY T 889-2004 and analysed by inductively coupled plasma optical emission spectrometry (ICP-OES; SPECTRO Analytical Instruments GmbH, USA). Analyses were performed in triplicate and the results were expressed as the average values with standard deviation (σ).
The representative geopolymer-supported zeolites were added to the contaminated soil in dosages of 2, 4, 6 and 8 wt.% and then were thoroughly mixed. The amended soil was adjusted to 70% of the water content and incubated for 2 days at room temperature. Then the bioavailable Cd content of the soil was determined according to the Chinese standard HJ804-2016. Briefly, the soil sample and diethylenetriaminepentaacetic acid (DTPA) extraction solution were added into the extraction bottle at a liquid/solid ratio of 2:1. The suspension was agitated on a HY-2A thermostatic water bath oscillator (Shanghai Lichen Instrument Co., Ltd, China) at 20 ± 2°C for 2 h at 160–200 rpm and was filtered through a medium-speed quantitative filter paper. The filtrate was analysed for bioavailable Cd concentration using ICP-OES. Three replicates were obtained for each sample and the means with standard deviation (σ) were reported.
The immobilization efficiency (R) of Cd(II) was calculated from Equation 2:

where c i and c e (mg kg–1) represent the average bioavailable Cd contents in the soil before and after immobilization, respectively.
Results and discussion
K2O/M2O–H2O/SiO2 binary zeolite crystallization phase diagram
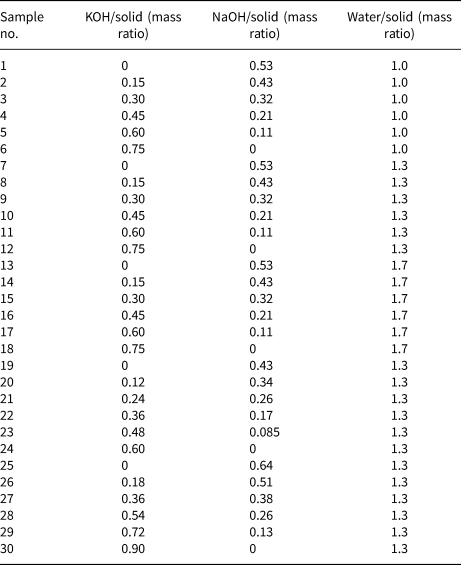
Figure 1 shows the XRD traces of the MKn raw material and the synthesized samples with the chemical composition of xK2O:yNa2O:SiO2:0.39Al2O3:zH2O (x/(x + y) varying from 0 to 1, z varying from 5.5 to 9.3 and x + y = 1.36). The K2O/M2O (x/(x + y))–H2O/SiO2 (z) binary zeolite crystallization phase diagram with a fixed M2O/SiO2 molar ratio (x + y) of 1.36 is shown in Fig. 2. The detailed mixture proportions of samples 1–18 (Fig. 2) are listed in Table 2, and the structures, secondary building units (SBUs) and chemical formulae of the zeolites formed in samples 1–18 (Fig. 2) are summarized in Table 3.
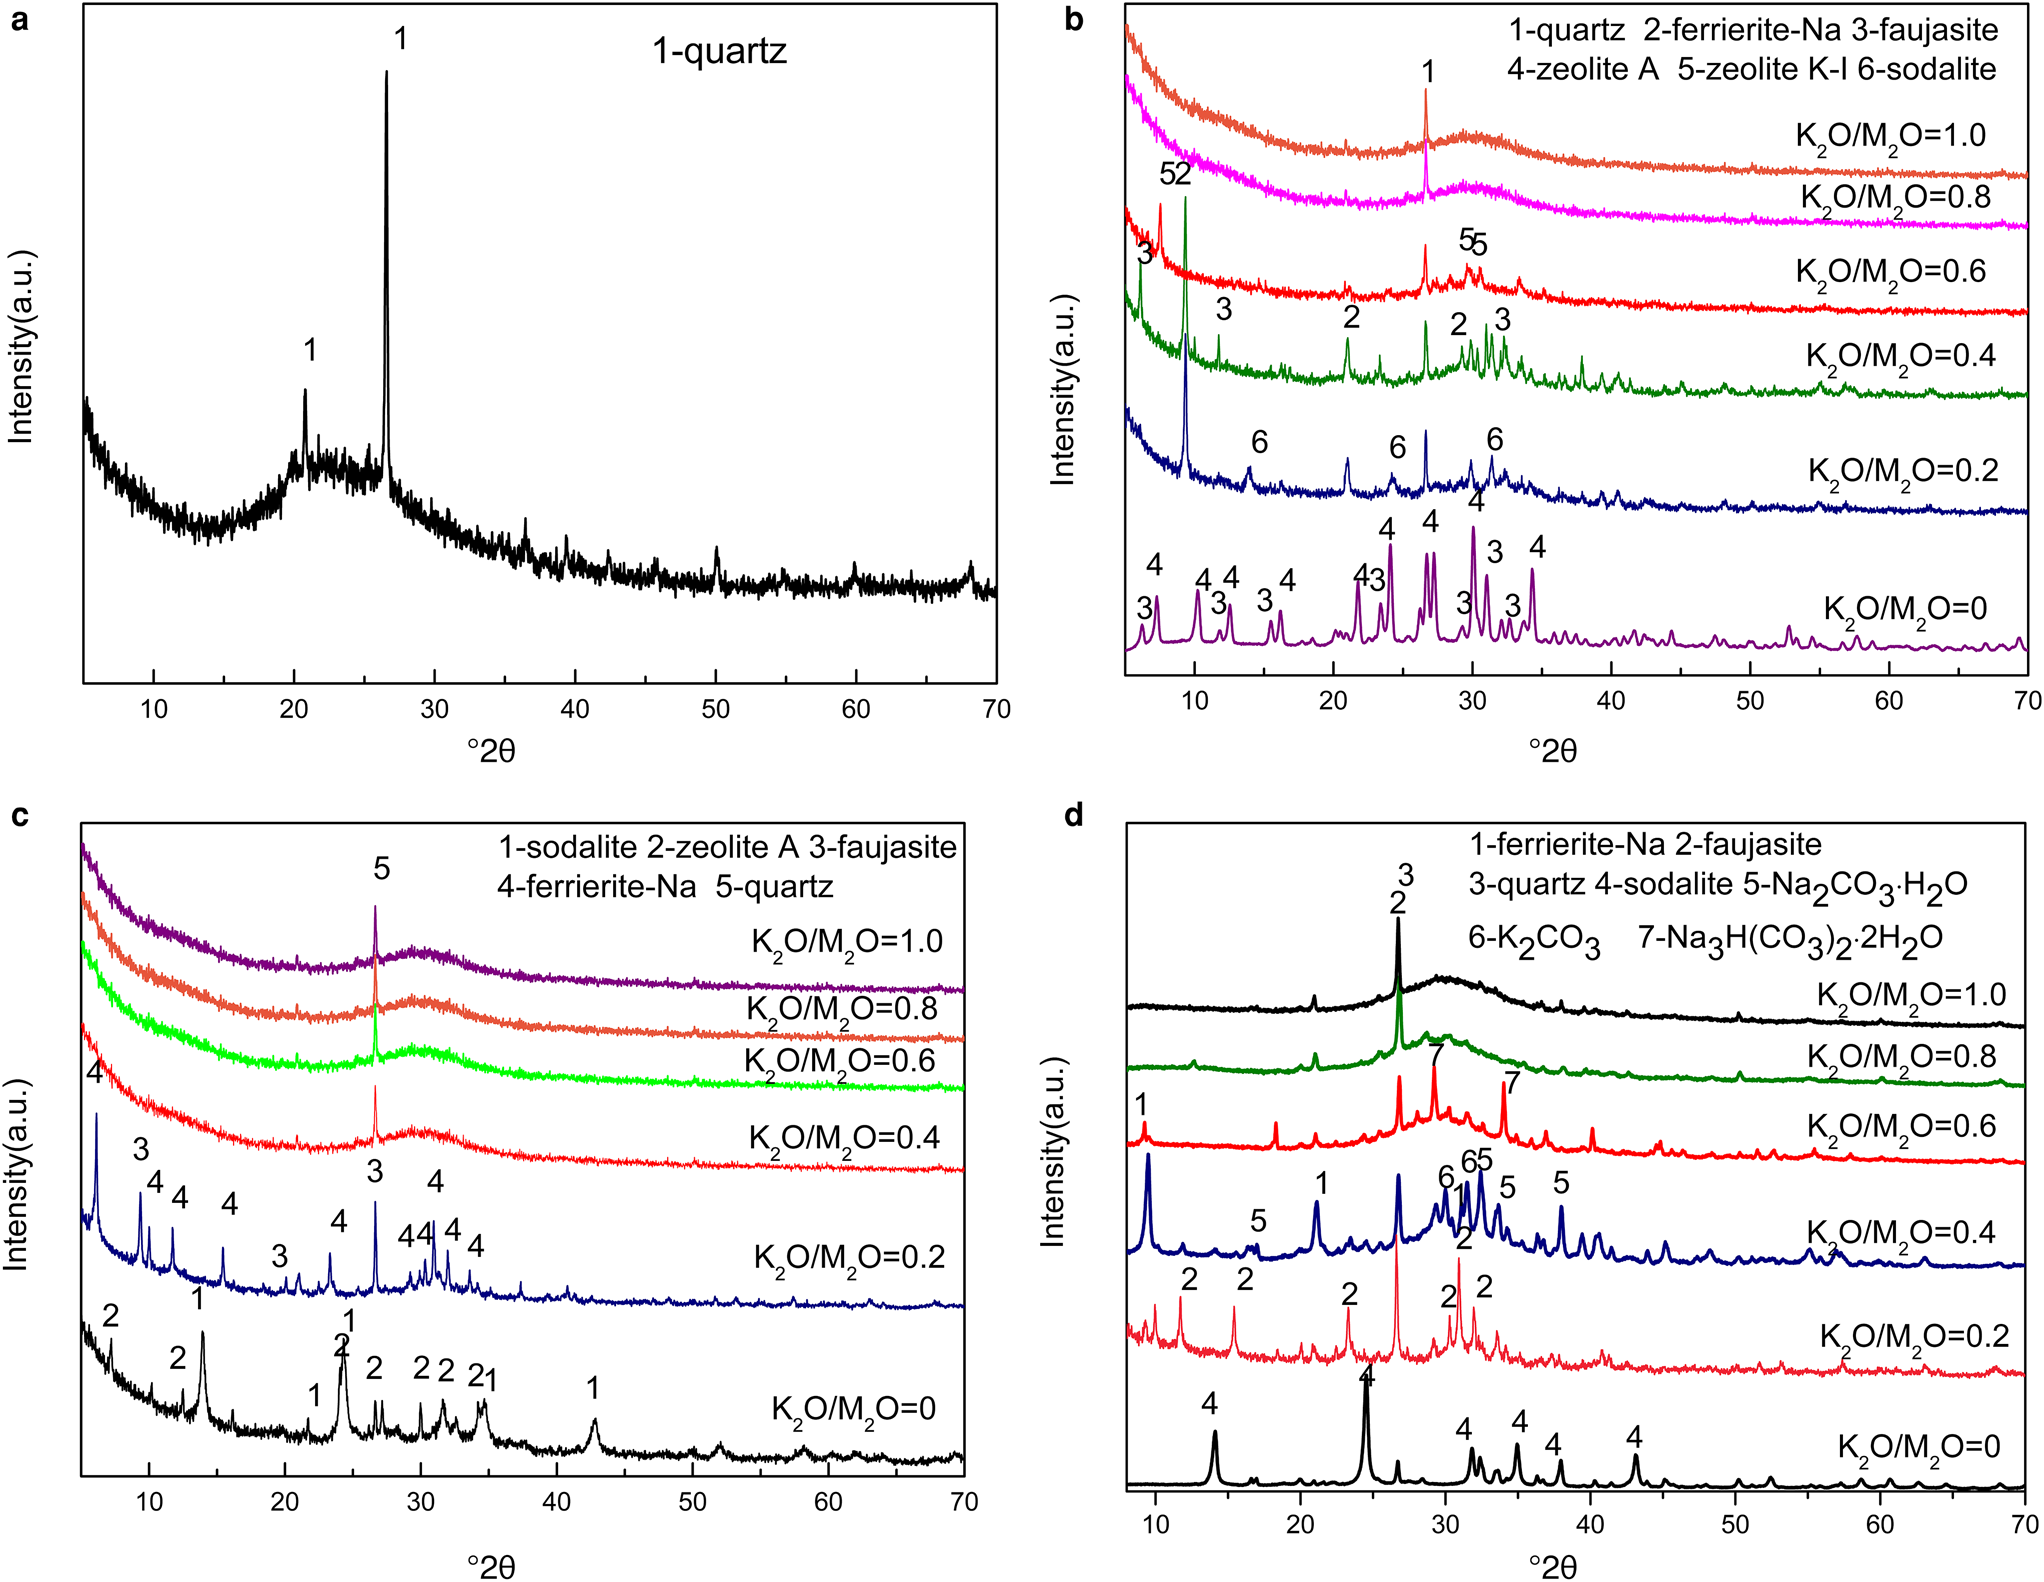
Fig. 1. XRD traces of (a) MKn raw material and geopolymer samples with H2O/SiO2 ratios of (b) 5.5, (c) 7.4 and (d) 9.3 at the OH–/SiO2 ratio of 1.36.
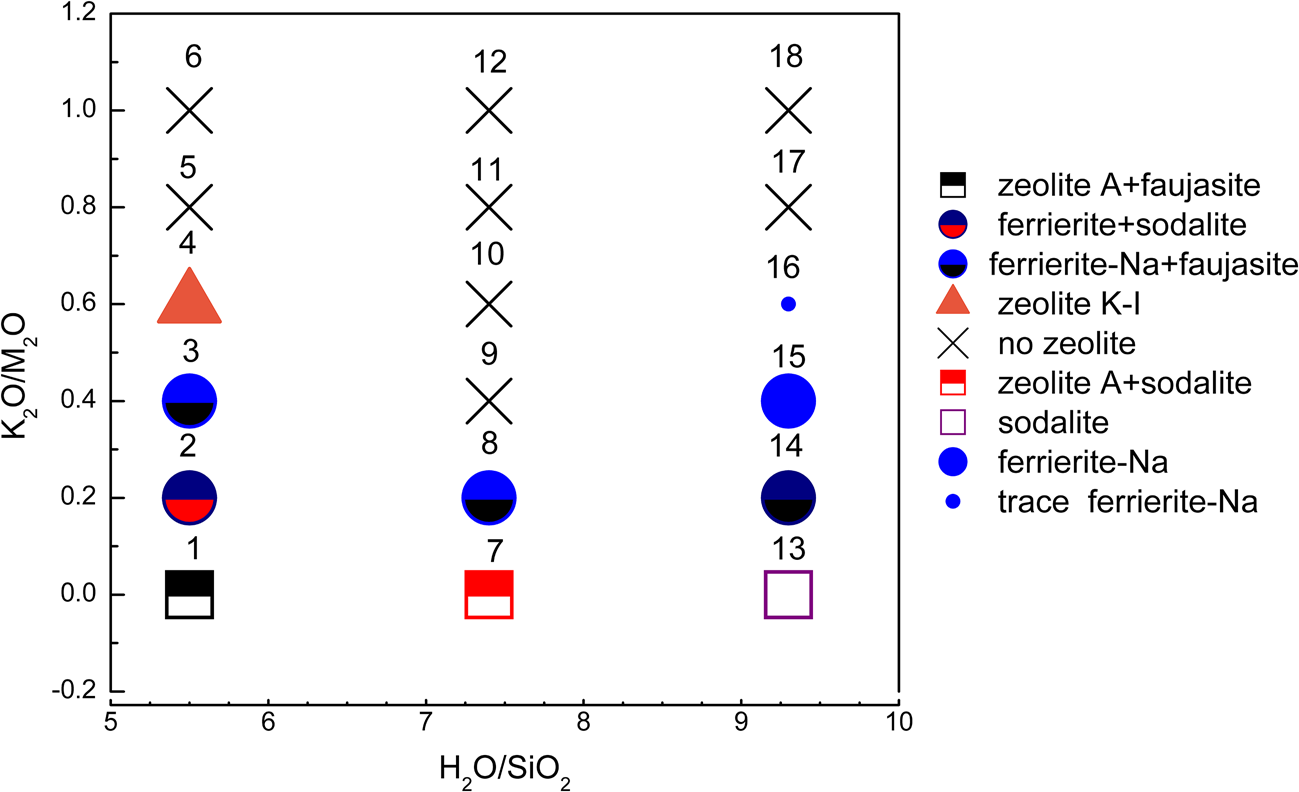
Fig. 2. K2O/M2O–H2O/SiO2 binary zeolite crystallization phase diagram of geopolymer samples activated with NaOH/KOH mixed alkaline solution. The sample numbers are marked at the top of each sample symbol.
Table 2. Detailed mixture proportions of the various samples.

Table 3. Zeolite structures formed in the geopolymers activated with the NaOH/KOH mixed solution (www.izastructure.org/databases).
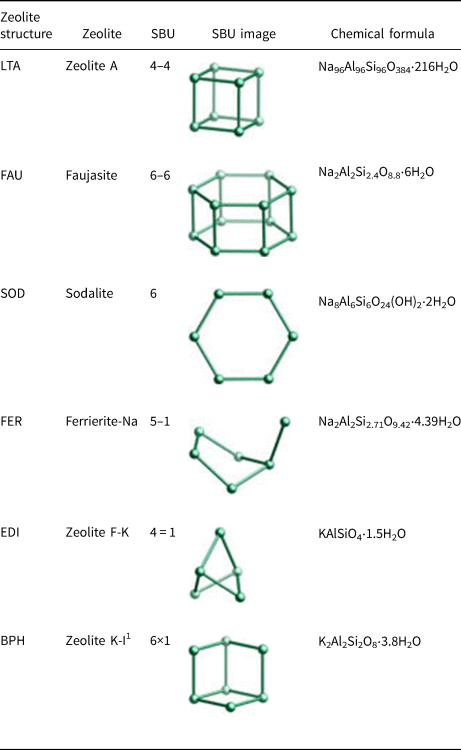
1 Zeolite K-I is identical to Linde Q (Sherman, Reference Sherman1977).
The MKn raw material is mainly amorphous, as is indicated by the hump at ~23°2θ (Duxson et al., Reference Duxson, Fernández-Jiménez, Provis, Lukey, Palomo and van Deventer2007a), with trace quartz impurity. In Na-geopolymers (K2O/M2O = 0), the formation of sodalite (PDF#81-0705), zeolite A (PDF#39-0222) and faujasite (PDF#28-1036) with a sodalite cage as a composite building unit was favoured. Sodalite tended to occur in samples with greater H2O/SiO2 as opposed to lower H2O/SiO2, which favoured zeolite A formation.
Ferrierite-Na (PDF#43-0557), which is fundamentally constructed from five-membered rings, appeared or became the dominant zeolite type over the K2O/M2O range of 0.2–0.4. In the Na-aluminosilicate system, the crystallization area for ferrierite is limited to a very narrow region (Suzuki et al., Reference Suzuki, Wakihara, Itabashi, Ogura and Okubo2009); therefore, it was only occasionally detected in Na-geopolymers.
The zeolite K-I (PDF#18-0988), a K-zeolite that was discovered in the 1950s (Sherman, Reference Sherman1977), was only found in sample 4 (K2O/M2O = 0.6, H2O/SiO2 = 5.5). Zeolite K-I probably formed due to the greater alkaline concentration of the solution (i.e. a lower H2O/SiO2 ratio at a constant OH–/SiO2 ratio).
When the K2O/M2O ratio exceeded 0.6, almost no zeolite could be observed and a hump at ~28°2θ ascribed to the amorphous geopolymer appeared (Duxson et al., Reference Duxson, Fernández-Jiménez, Provis, Lukey, Palomo and van Deventer2007a). This confirmed that in the K2O–Na2O–SiO2–Al2O3–H2O geopolymer system, an excessive K+ content prevented zeolites from crystallizing because the large ionic size of K+ favours the formation of large silica oligomers (Duxson et al., Reference Duxson, Mallicoat, Lukey, Kriven and van Deventer2007b), hindering the movement and reorganization of ions to form crystals (Fu et al., Reference Fu, Ye, Zhu, Fang and Zhou2020). This also suggested that Na+ plays a significant role in ordering the SBUs.
Finally, the appearance of Na2CO3⋅H2O (PDF#72-0578), K2CO3 (PDF#87-0730) and Na3H(CO3)2⋅2H2O (PDF#75-1195) in some samples should be attributed to the reaction between the excessive NaOH or KOH and CO2 in air.
K2O/M2O–OH–/SiO2 binary zeolite crystallization phase diagram
Figure 3 shows the XRD traces of the synthesized samples with chemical composition xK2O:yNa2O:SiO2:0.39Al2O3:zH2O (x/(x + y) = 0–1, x + y = 1.09 or 1.63 and z = 7.4). The K2O/M2O (x/(x + y))–OH–/SiO2 (x + y) binary zeolite crystallization phase diagram with a fixed H2O/SiO2 molar ratio (z) of 7.4 is shown in Fig. 4. The detailed mixture proportions of samples 19–30 (Fig. 4) are listed in Table 2, and the structures, SBUs and chemical formulae of the zeolites formed in samples 19–30 (Fig. 4) are summarized in Table 3.

Fig. 3. XRD traces of geopolymer samples with OH–/SiO2 ratios of (a) 1.09 and (b) 1.63 at the H2O/SiO2 ratio of 7.4.
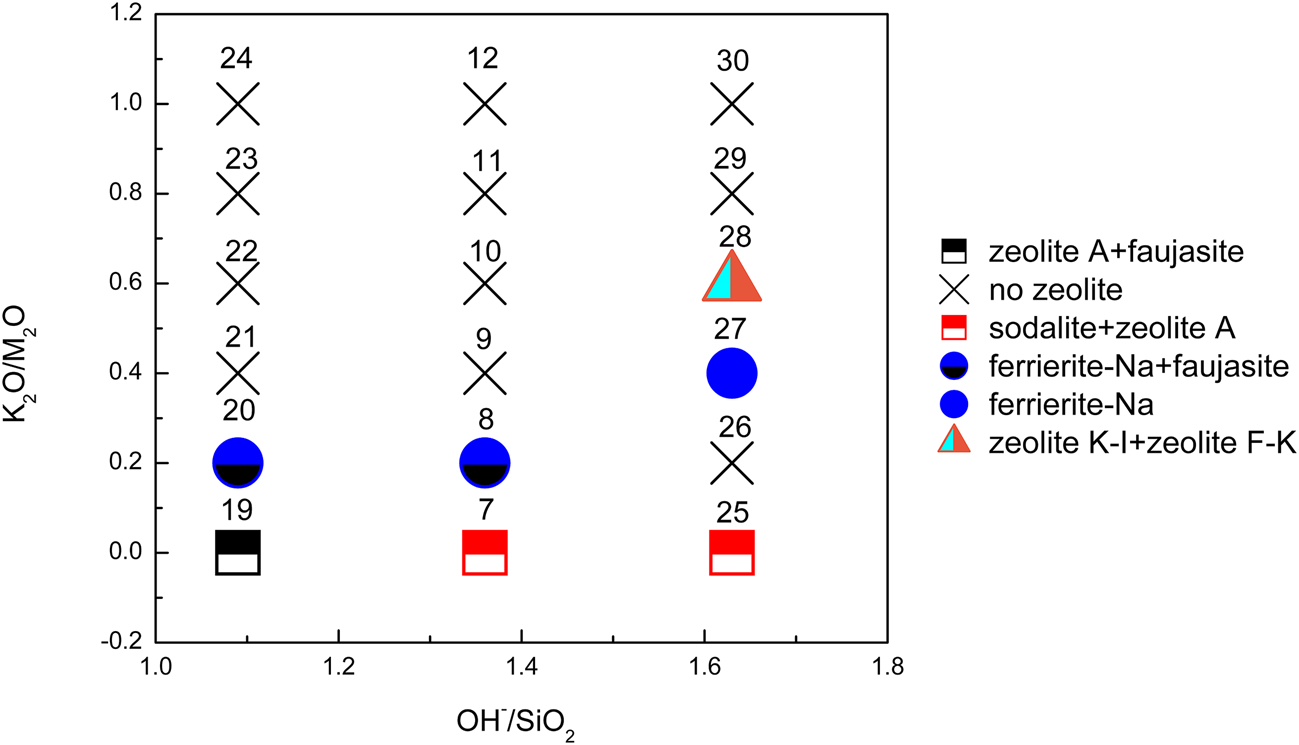
Fig. 4. K2O/M2O–OH–/SiO2 binary zeolite crystallization phase diagram of geopolymer samples activated with NaOH/KOH mixed-alkaline solution. The sample numbers are marked at the top of each sample symbol.
In Na-geopolymers, sodalite, zeolite A and faujasite remained the dominant zeolites. Zeolite A appeared over the complete OH–/SiO2 ratio range. By contrast, sodalite preferentially formed at higher OH–/SiO2 ratios, whereas lower OH–/SiO2 ratios favoured the presence of faujasite. This was in agreement with previous published studies (Król et al., Reference Król, Rózek and Roźek2018; Rózek et al., Reference Rózek, Król and Mozgawa2018).
Ferrierite was still detected in geopolymer samples synthesized using solutions with a K2O/M2O ratio range of 0.2–0.4. At the K2O/M2O ratio of 0.6, zeolites (zeolite K-I and zeolite F-K (PDF#38-0216)) were observed only in the samples with the highest OH–/SiO2 ratio (= 1.63), confirming that the synthesis of these two zeolites takes place at greater alkali concentrations. Zeolite F-K is also a K-zeolite that was discovered in the 1950s (Sherman, Reference Sherman1977). The chemical composition of zeolite K-I and zeolite F-K is the same as kaliophilite (KAlSiO4) except for the amount of zeolitic water, verifying that K-PS has a kaliophilite-like structure (Davidovits, Reference Davidovits2008). Zeolites occur essentially as alteration products of (Na, Ca)-aluminosilicates such as nepheline and plagioclase. K-aluminosilicates (kalsilite, leucite, sanidine) are more resistant to hydrothermal degradation than other species, resulting in abundant K-zeolites in nature (Davidovits, Reference Davidovits2008). In the present study, a novel in situ synthesis method for K-zeolites by geopolymerization is proposed.
No zeolites were observed in the samples with K2O/M2O ratios >0.6. Carbonates including Na2CO3⋅H2O, NaHCO3 (PDF#74-1203) and Na3H(CO3)2⋅2H2O were also identified in some of the end products.
FESEM analysis of representative samples
The FESEM images of representative samples (samples 2, 8, 22, 25 and 28) are shown in Fig. 5. Sample 22, which was the only sample without zeolite formation, mainly consisted of geopolymers with a disordered morphology (Fig. 5a). In sample 2, the ferrierite particles ~2 μm in diameter consisted of stacked rectangular crystals, and the sodalite appeared to have a ball-like morphology (Lee et al., Reference Lee, Khalid and Lee2016) with an average diameter of ~1 μm (Fig. 5b). The ferrierite crystals in sample 8 had a similar morphology to that of sample 2; walnut-shaped chabazite (Duxson et al., Reference Duxson, Mallicoat, Lukey, Kriven and van Deventer2007b) was occasionally found on the surface of ferrierite particles (Fig. 5c). Zeolite A in sample 25 displays a grape-like morphology consisting of clusters of agglomerated block crystals with an average diameter of ~100 nm (He et al., Reference He, Cui, Liu, Wang, Zhang and Liu2013), and the sodalite has a similar morphology and an average diameter similar to that of sample 2. In sample 28, the cubic-shaped crystal probably belongs to zeolite F-K and the plate-like crystal is possibly zeolite K-I (Sherman, Reference Sherman1977).
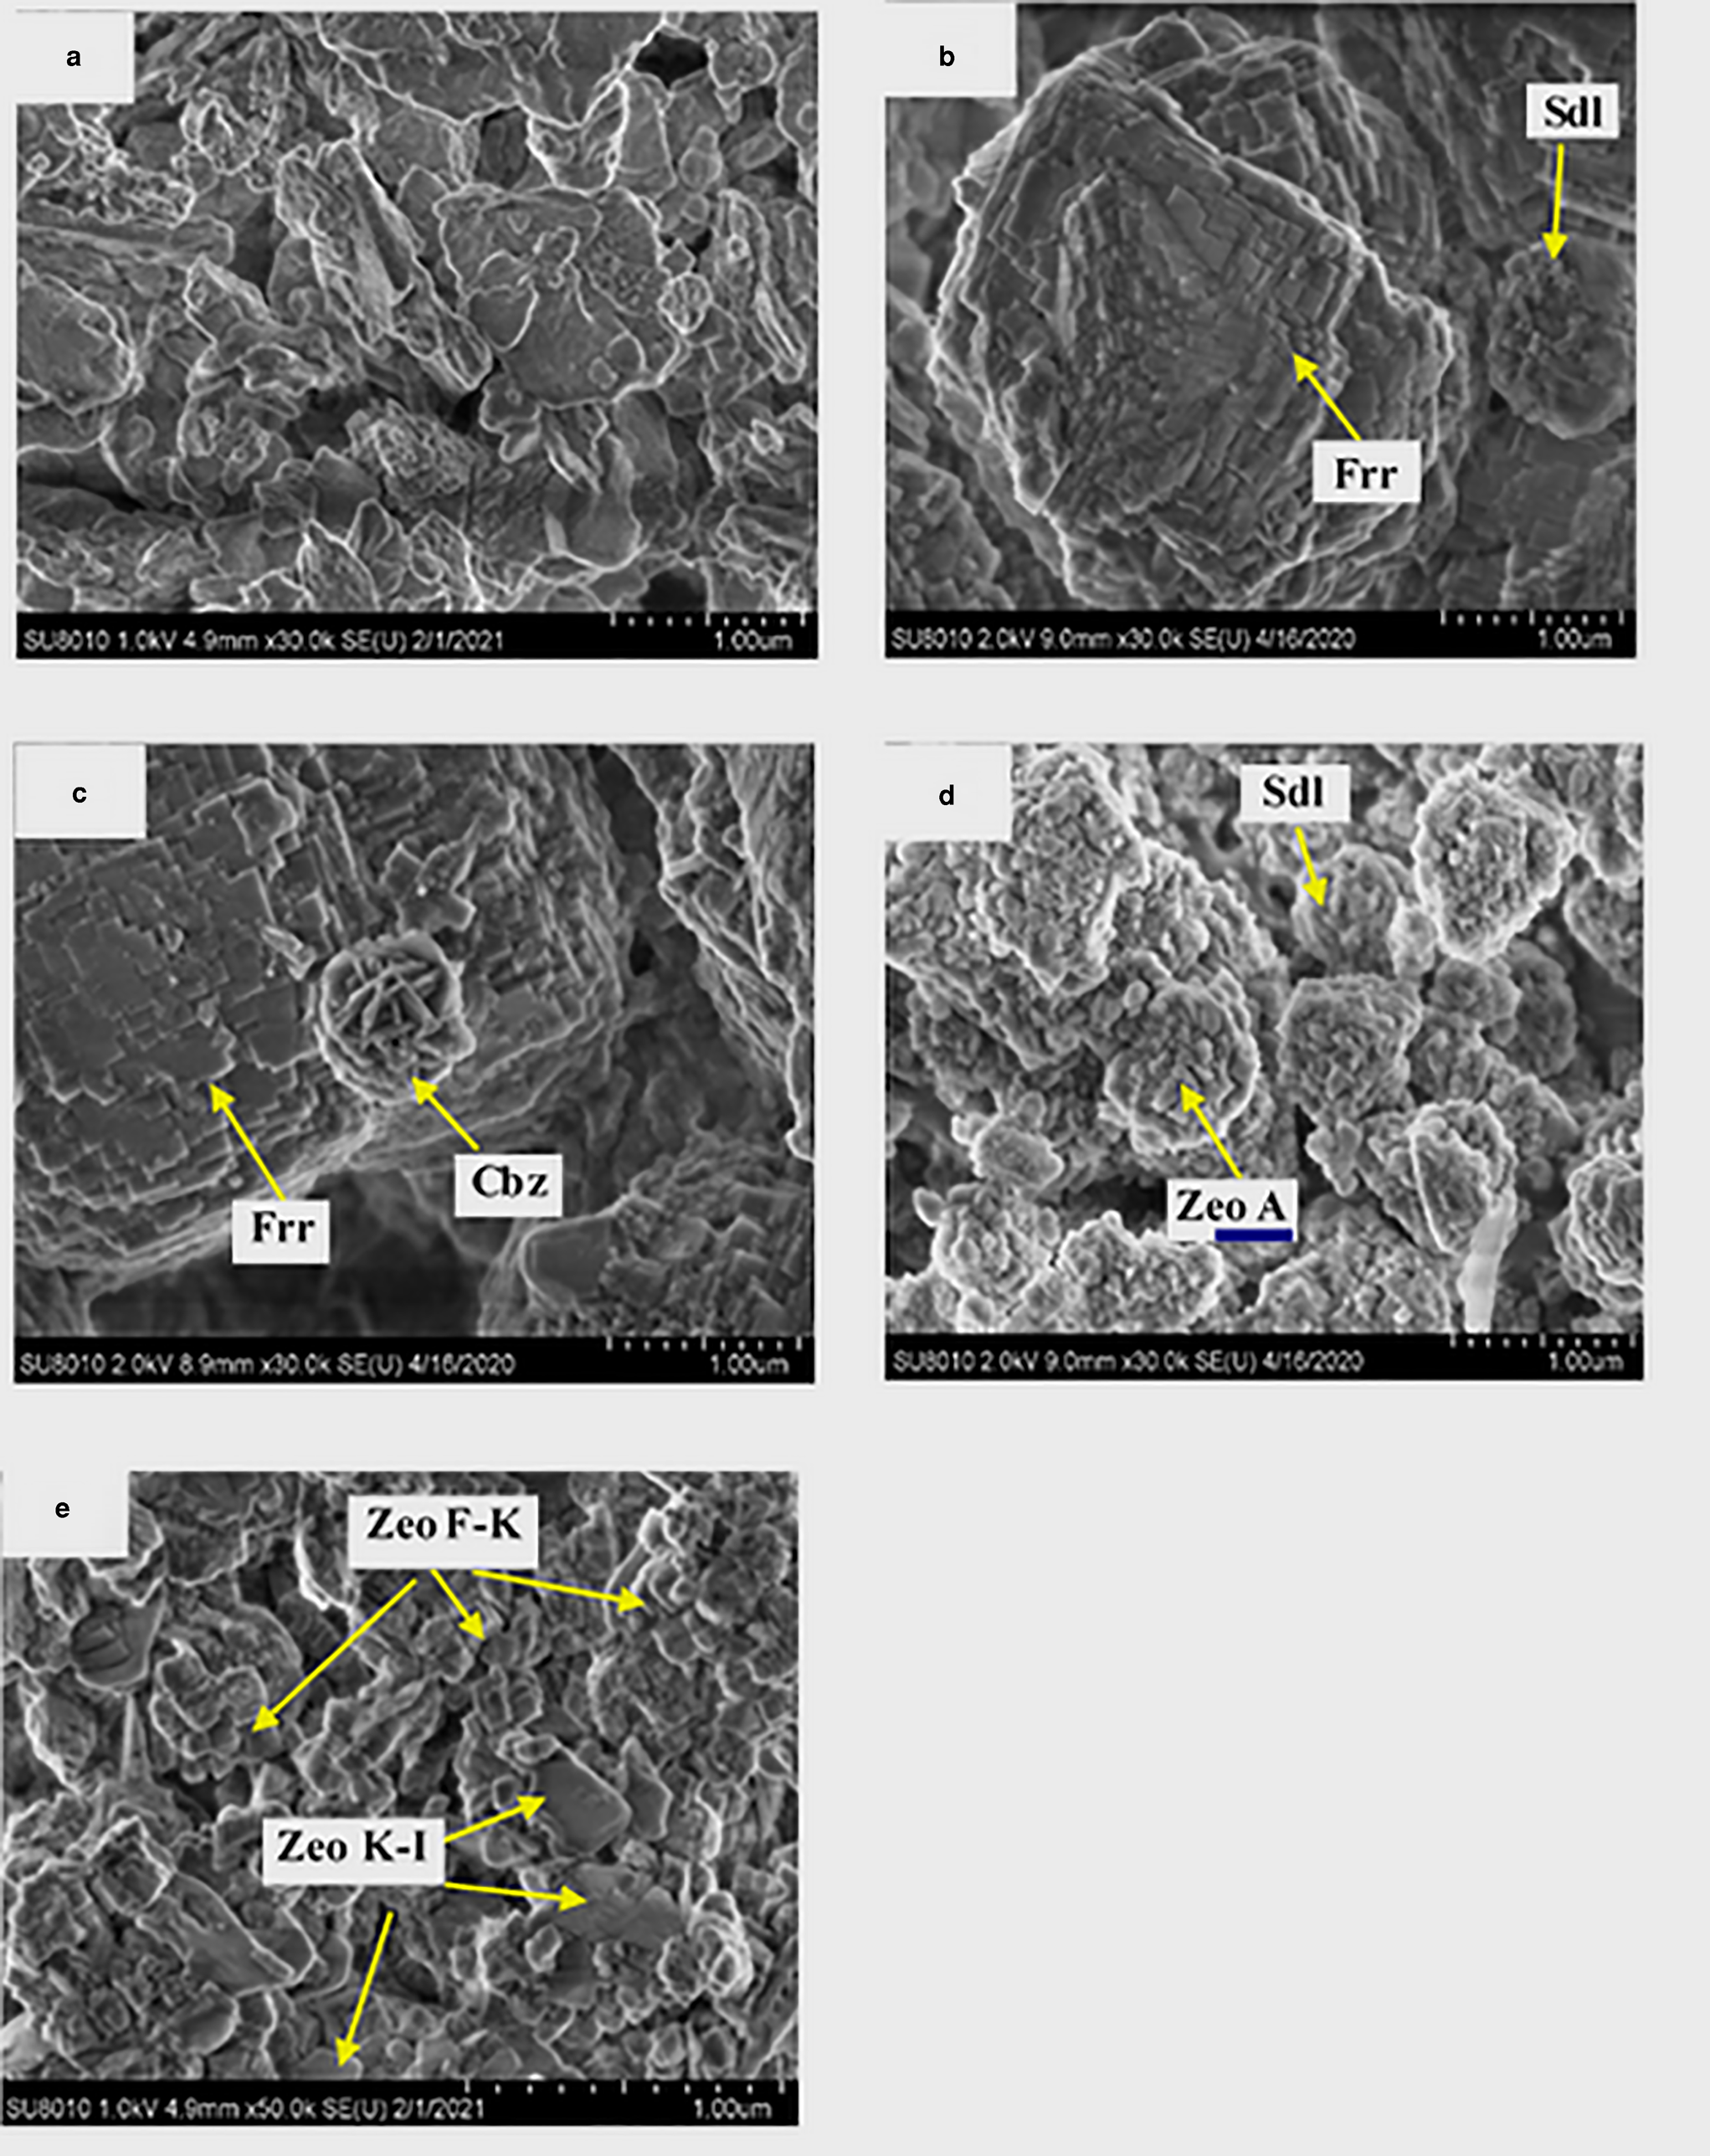
Fig. 5. FESEM images of representative samples: (a) sample 22, (b) sample 2, (c) sample 8, (d) sample 25, (e) sample 28. Cbz = chabazite; Frr = ferrierite; Sdl = sodalite; Zeo A = zeolite A; Zeo F-K = zeolite F-K; Zeo K-I = zeolite K-I.
FTIR analysis of representative samples
Figure 6 shows the FITR spectra of MKn and representative samples (samples 8, 22, 25 and 28). For MKn, the band at 808 cm–1 is a characteristic peak of Al(VI)–O bonds, and that at 1143 cm–1 is attributed to the Si–O–T (T = Si or Al) asymmetric stretching vibration (Temuujin et al., Reference Temuujin, Minjigma and Rickard2009). After geopolymerization, the former band disappeared and the latter band shifted to ~990 cm–1 due to the transformation of Al(VI) or Al(V) present in MKn to Al(IV) (Duxson et al., Reference Duxson, Fernández-Jiménez, Provis, Lukey, Palomo and van Deventer2007a). The bands at 3450 and 1637 cm−1 were ascribed to O–H stretching and bending modes of adsorbed molecular water (Liguoria et al., Reference Liguori, Aprea, Roviello and Ferone2019), and the band at 1460 cm–1 was due to the O–C–O stretching vibration (Liu et al., Reference Liu, Yan, Zhang, Wang, Zhou and Zhou2016). In addition, the bands in the range 400–900 cm–1 were different for the various samples. In sample 22 (without zeolite formation), the bands at 466, 584 and 715 cm–1 were related to the Al–O/Si–O bending, Si–O–Al bending and Si–O–Si/Si–O–Al symmetric stretching vibrations, respectively, of geopolymer (Liu et al., Reference Liu, Yan, Zhang, Wang, Zhou and Zhou2016). The broad band at ~565 cm–1 was assigned to the vibration of six-membered rings and double four-membered rings of zeolite A and sodalite (Rózek et al., Reference Rózek, Król and Mozgawa2019) in sample 25 (K2O/M2O = 0). The bands at 460 and 664 cm–1 are also characteristic of these two zeolites (Huang et al., Reference Huang, Han and Yi2012; Yao et al., Reference Yao, Li, Xia, Ye and Zhang2009). In sample 8 (K2O/M2O = 0.2), the overlap of bands at 563 cm–1 assigned to the five-membered ring vibration of ferrierite (Jansen et al., Reference Jansen, van der Gaag and van Bekkum1984) and at 565 cm–1 assigned to the double six-membered ring vibration of faujasite (Liu et al., Reference Liu, Yan, Zhang, Wang, Zhou and Zhou2016) resulted in a broad band at ~564 cm–1. Small amounts of K+ in the starting geopolymer gel might prevent the formation of zeolite A or sodalite with four-membered rings as SBUs and facilitate the formation of ferrierite with five-membered rings as SBUs (Isobe et al., Reference Isobe, Moteki, Tanahashi, Kimura, Kamimura, Itabashi and Okubo2012). In addition, the band at 460 cm–1 is due to the Al–O/Si–O bending vibration of faujasite and ferrierite, and the weak bands at 669 and 695 cm–1 correspond to TO4 (T= Si or Al) tetrahedral symmetric stretch vibrations of faujasite and ferrierite, respectively (Jansen et al., Reference Jansen, van der Gaag and van Bekkum1984; Liu et al., Reference Liu, Yan, Zhang, Wang, Zhou and Zhou2016). For sample 28 (K2O/M2O = 0.6), the bands at 569 and 610 cm–1 were assigned to the zigzag eight-membered ring vibration of zeolite K-F (Wong et al., Reference Wong, Awala, Vincente, Retoux, Ling and Mintova2017), and the bands at 440, 664 and 877 cm–1 might be the characteristic peaks of zeolite K-I (Zhang et al., Reference Zhang, Zhao and Liu2007).
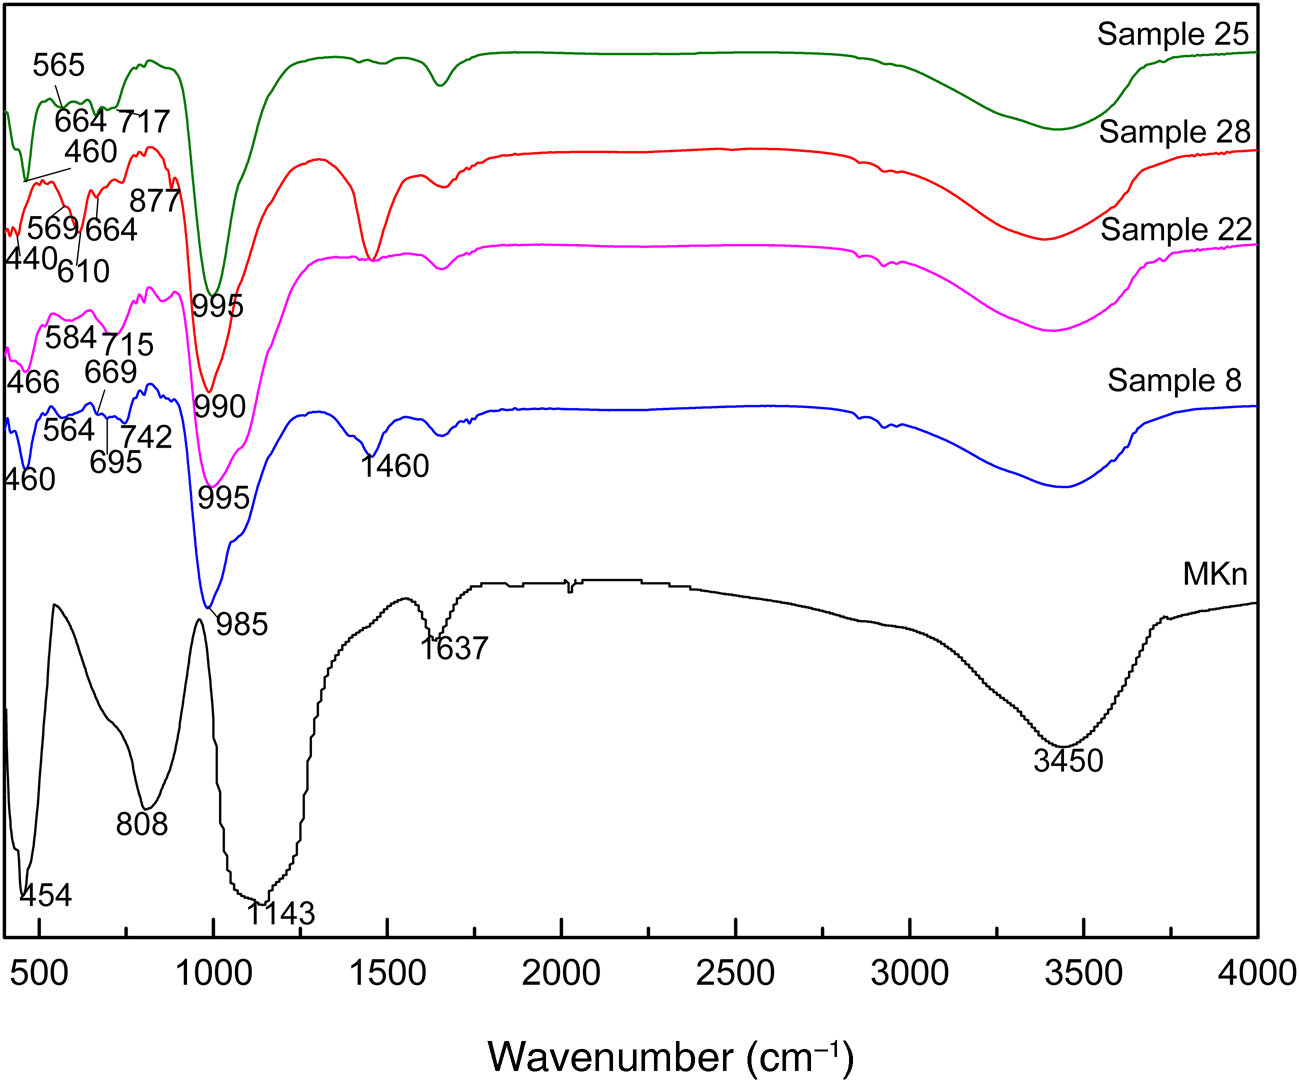
Fig. 6. FTIR spectra of the MKn raw material and representative geopolymer samples.
Porosity and specific surface area analysis of representative samples
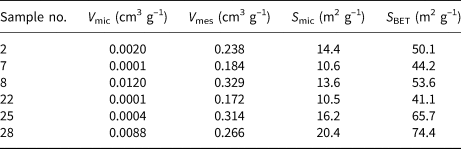
The N2 adsorption–desorption isotherms of the representative samples are illustrated in Fig. 7 and the specific surface areas and pore volumes of the samples are summarized in Table 4. All analysed samples showed type IV isotherms based on the classification of the International Union of Pure and Applied Chemistry (IUPAC) (Ariharan et al., Reference Ariharan, Viswanathan and Nandhakumar2017). At low relative pressure (P/P 0 < 0.05) a small and quick uptake was observed, indicating the existence of small micropores characteristic of zeolites (Ariharan et al., Reference Ariharan, Viswanathan and Nandhakumar2017). An H3-type hysteresis loop in the IUPAC classification occurring in all samples is considered characteristic of mesoporous materials that may be produced by interparticle spaces (Lee et al., Reference Lee, Khalid and Lee2016). In general, these samples demonstrate the coexistence of micropores and mesopores. These conclusions correspond well with the results listed in Table 4. The samples containing zeolites (samples 2, 7, 8, 25 and 28) had greater S BET values (44.2–74.8 m2 g–1) and pore volumes than the sample without zeolite formation (sample 22), which is in good agreement with previous studies on the in situ synthesis of zeolites by geopolymerization (He et al., Reference He, Cui, Liu, Wang, Zhang and Liu2013; Tang et al., Reference Tang, Ge and Wang2015, Reference Tang, He and Wang2016). Note, however, that sample 22 has a similar pore volume and specific surface area to sample 7, which supports the idea that amorphous geopolymers contain nanocrystalline zeolites that cannot be detected by XRD (Provis et al., Reference Provis, Lukey and van Deventer2005).
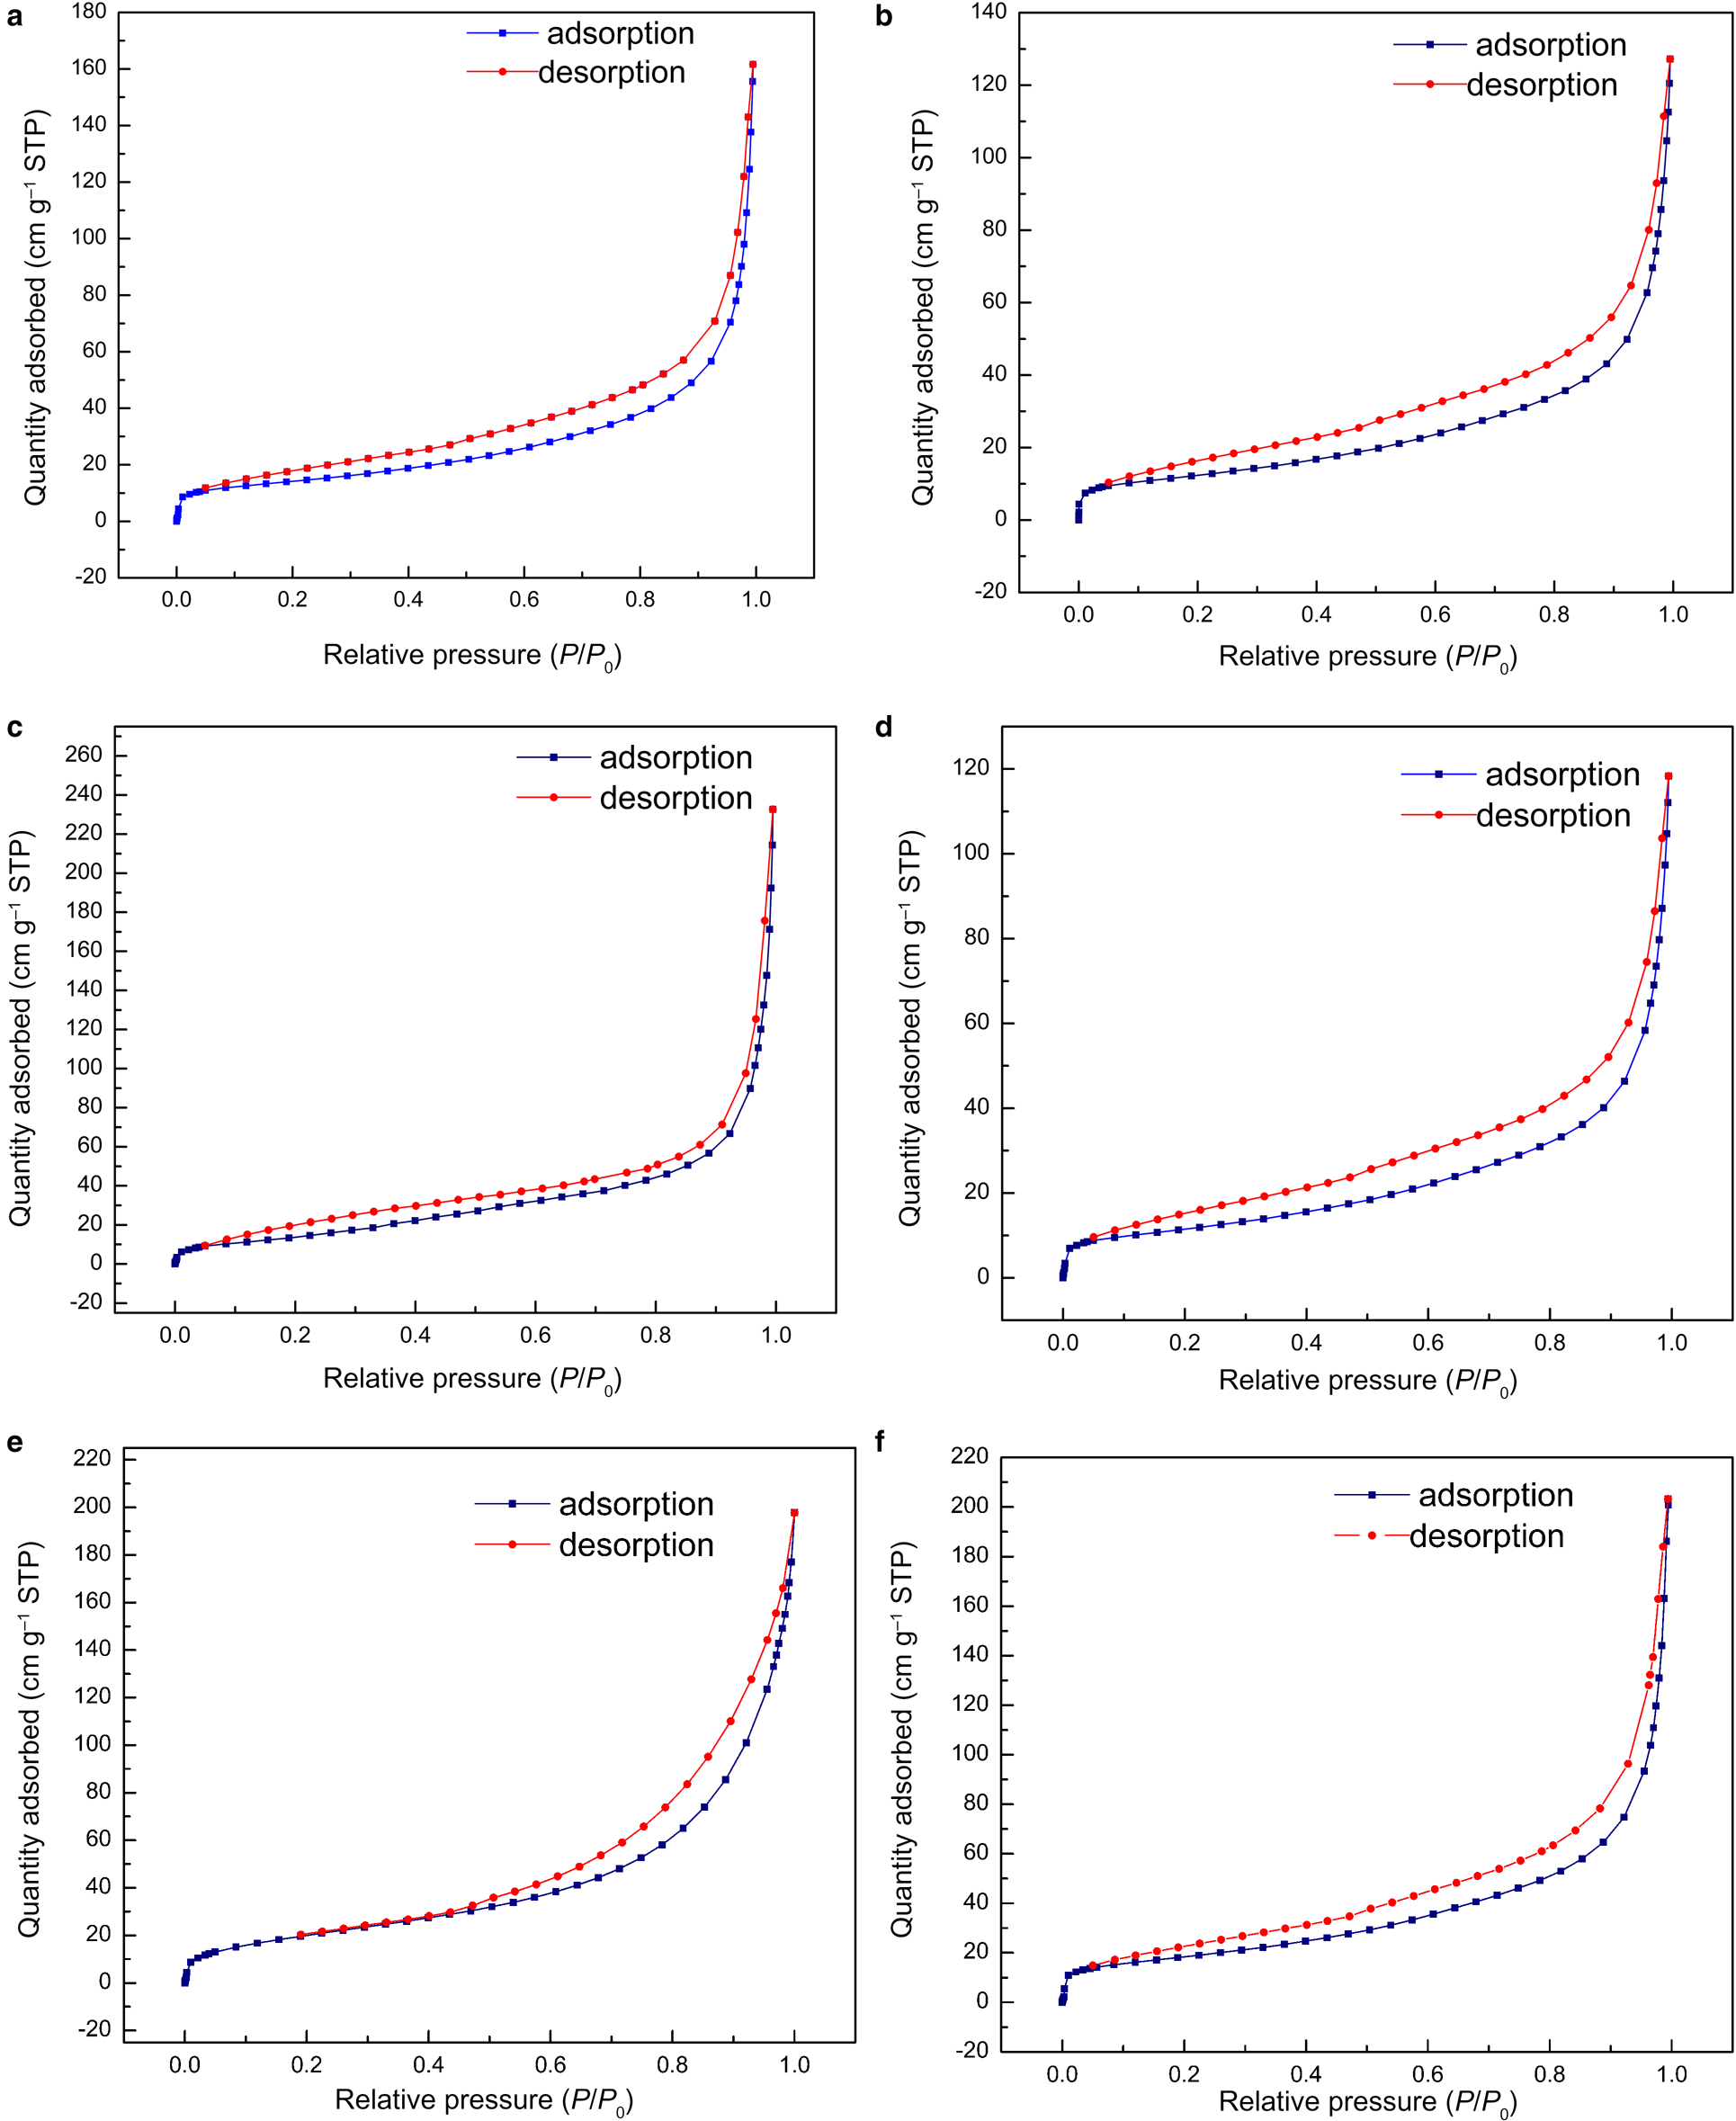
Fig. 7. N2 adsorption–desorption isotherms at 77 K of (a) sample 2, (b) sample 7, (c) sample 8, (d) sample 22, (e) sample 25 and (f) sample 28. STP = standard temperature and pressure.
Table 4. Specific surface areas and pore volumes of the representative samples. V mic and V mes are micropore and mesopore volumes, respectively, and S mic is the specific surface area due to micropores. S BET is the total specific surface area.

Cd(II) immobilization potential of geopolymer-supported zeolites in paddy soil
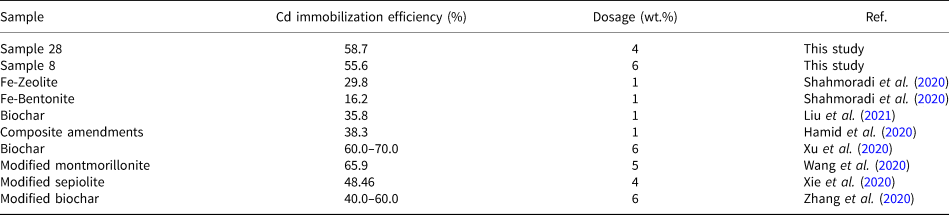
Two representative samples (samples 8 and 28) were selected to immobilize Cd(II) in paddy soil. The samples were fully washed to remove excess Na+ and K+ before being added to the soil. The immobilization efficiencies calculated using Equation 2 for soils containing various amounts of the two representative samples are shown in Fig. 8. The Cd(II) immobilization efficiency increased with the dosage until it reached 6 wt.% for sample 8 or 4 wt.% for sample 28. For greater dosages, the efficiency remained constant for sample 8 or increased slightly for sample 28. The maximum immobilization efficiency reached 58.7% for sample 28, being slightly greater than that for sample 8 (55.6%). This may be attributed to the greater S BET of sample 28 (see Table 4). Compared with the Cd immobilization efficiency evaluated by extractable Cd content in soils using other sorbents (see Table 5), the performance of geopolymer-supported zeolites in this study was better than that of natural minerals (e.g. zeolite, bentonite and sepiolite) and similar to that of biochar.
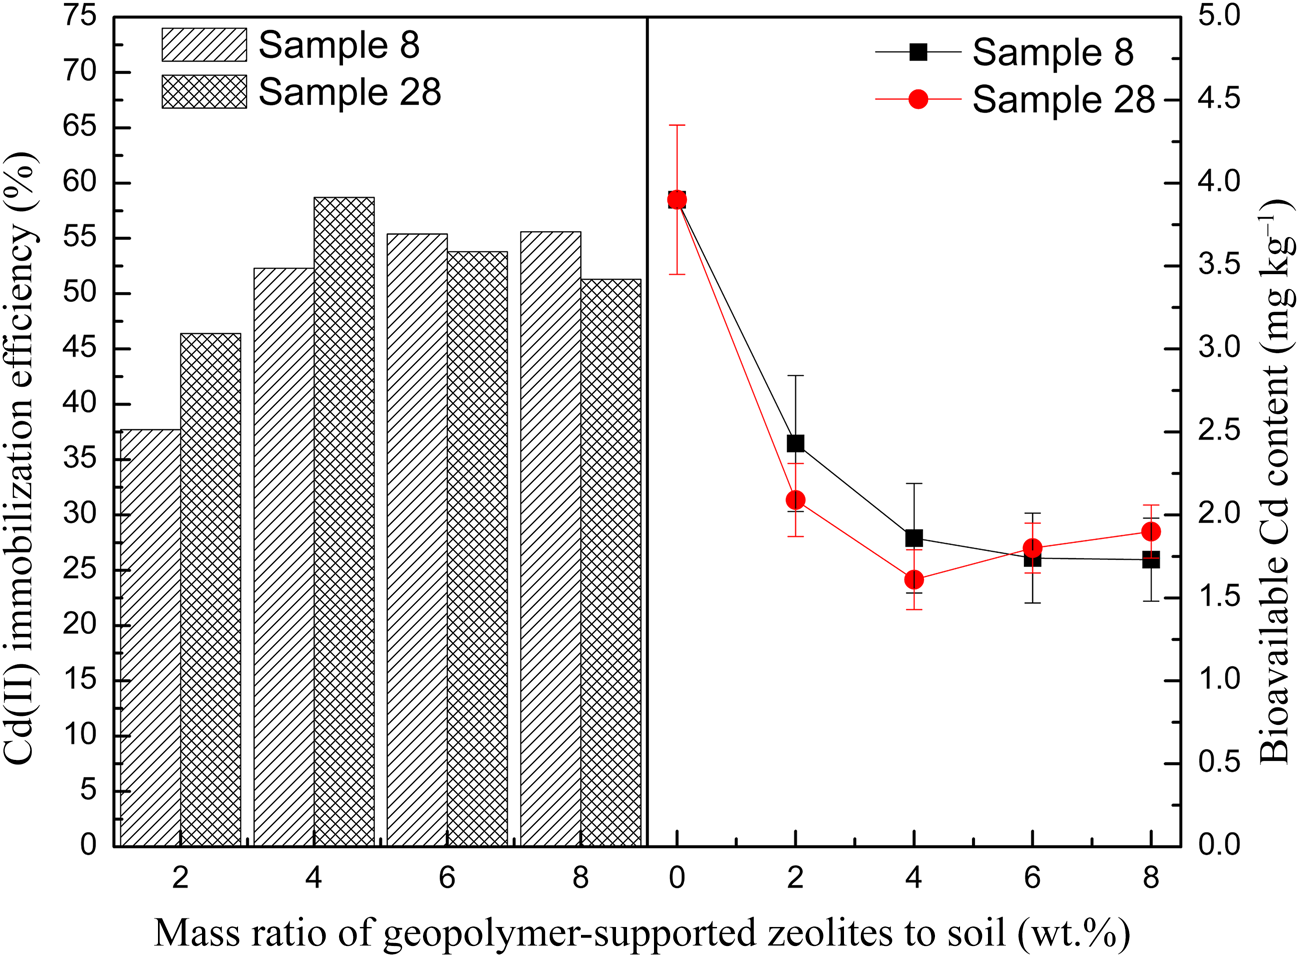
Fig. 8. Immobilization efficiency of Cd(II) and bioavailable Cd content in paddy soil for representative samples activated with a NaOH/KOH mixed solution.
Table 5. Reported results on the immobilization capacity of various adsorbents of Cd2+.

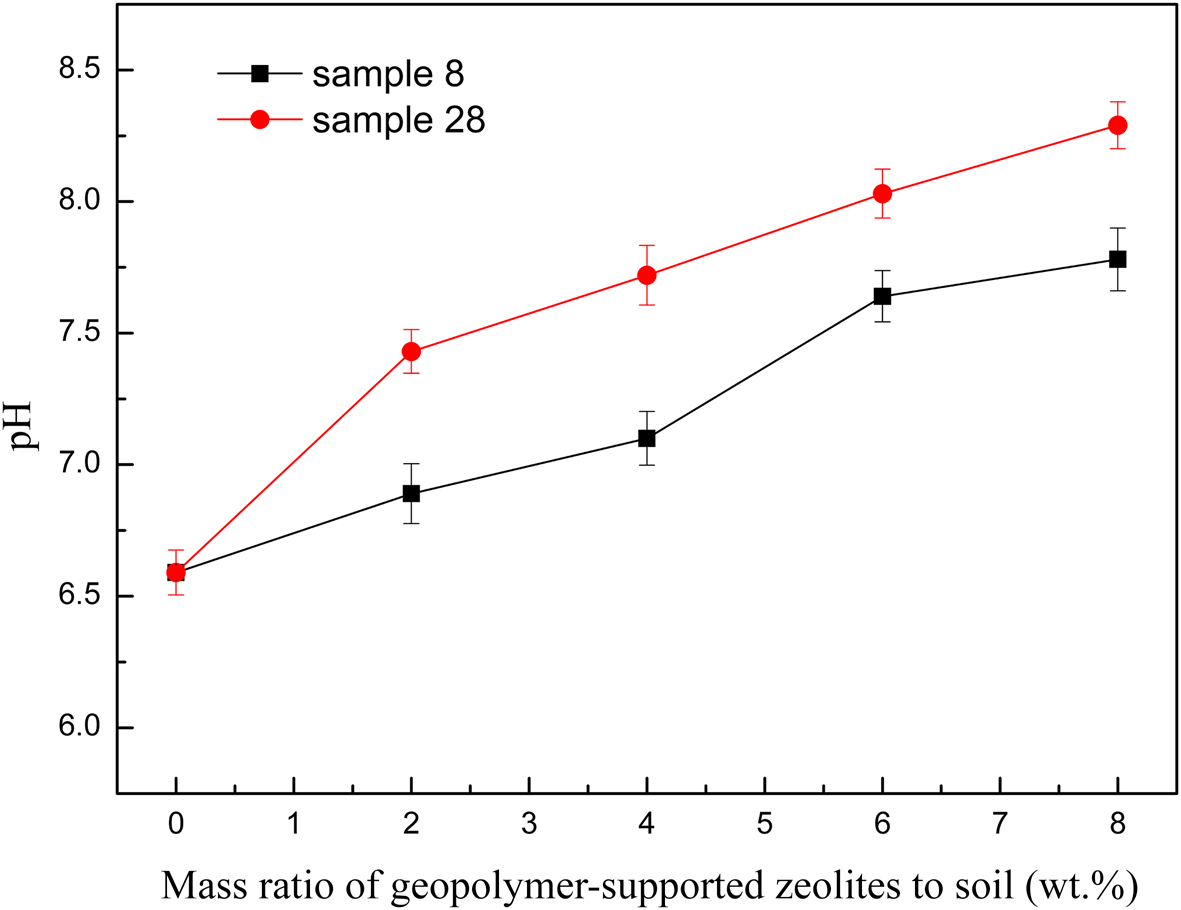
Some previous studies (Shaha et al., Reference Shaha, Abul Kashem and Osman2012; Hamid et al., Reference Hamid, Tang, Hussain, Usman, Gurajala and Rashid2020; Liu et al., Reference Liu, He, Liu, Monrenegro, Ellis, Li and Baligar2021) indicated that an increase of soil pH with alkaline materials may be associated with improved Cd precipitation and adsorption. In this study, the pH value increased with the addition of greater amounts of geopolymer due to the alkaline nature of the material added (Fig. 9). However, the Cd(II) immobilization efficiency was not related to the pH value over the geopolymer-supported zeolite dosage range of 4–8 wt.%. This may be due to the competitive adsorption of excessive free Na+ and K+ at greater zeolite dosages, which decreased the Cd(II) adsorption capacity of the soil (Zhou et al., Reference Zhou, Xu, Zhao and Ji2003). Furthermore, K+ has been reported to have a more negative effect on the Cd adsorption capacity of soils (Ren et al., Reference Ren, Wu, Deng, Tang and Li2020), which may explain the slight lower immobilization efficiency of sample 28 at a dosage of 6–8 wt.%.

Fig. 9. The relationship between the pH value of the soil and increasing contents of two representative geopolymer samples.
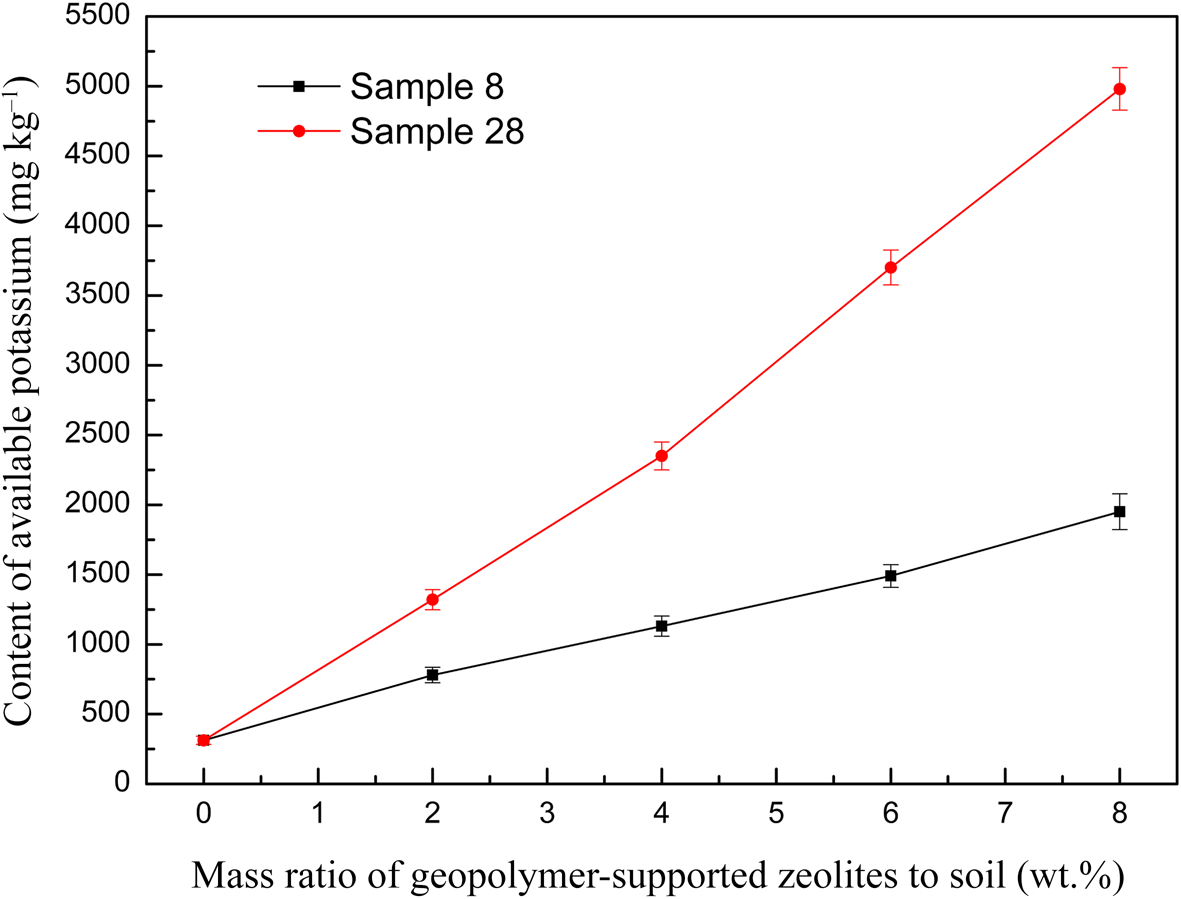
Figure 10 shows the available potassium content in the soil at various dosages of geopolymer-supported zeolites. A nearly linear increase of available potassium content with increasing dosage in the soil was observed; sample 28 with a greater K2O/M2O ratio provided more potassium to the soil. Therefore, this material is especially suitable for application in potassium-deficient soils. However, whether such a large potassium content is beneficial to the growth of crops should be examined in detail in a future study.

Fig. 10. The relationship between the available potassium content of the soil and the dosage of two representative geopolymer samples.
Summary and conclusions
(Na, K)-zeolites were synthesized from geopolymer precursor phases with NaOH/KOH mixed-alkaline activator solutions and were used to develop K2O/M2O–H2O/SiO2 and K2O/M2O–OH–/SiO2 binary zeolite crystallization phase diagrams. Zeolite A, faujasite and sodalite tended to form over the K2O/M2O ratio range of 0–0.2, ferrierite could be observed at the K2O/M2O ratio range of 0.2–0.4 and zeolite K-I and zeolite F-K (two K-zeolites) appeared only in samples with a K2O/M2O ratio of 0.6 at greater alkali concentrations. When the K2O/M2O ratio exceeded 0.6, zeolite formation was hindered. It is assumed that the cooperative effect of K+ and Na+ favours zeolite crystallization in geopolymer samples activated with NaOH/KOH mixed alkaline solutions. Most of the zeolites in the geopolymer material demonstrated an agglomerated appearance under FESEM. The samples containing zeolites were characterized by the coexistence of mesopores and micropores and a S BET in the range of 44.2–74.8 m2 g–1. In situ synthesis by geopolymerization with NaOH/KOH mixed alkaline solution as the activator provides a novel method for zeolite preparation, especially for K-based zeolites.
The geopolymer-supported zeolites show considerable efficiency at immobilizing Cd(II) from a paddy soil (55.6–58.7% at 4–6 wt.% dosage). The pH and the available potassium content of the soil increased with increasing dosage. However, the influence of this on crop growth needs to be studied further through plant-growing experiments.
Financial support
The authors acknowledge support from the Natural Science Foundation of Hunan Province, China (Grant No. 2020JJ4157), the Undergraduate Training Program for Innovation and Entrepreneurship of Hunan Province (Grant No. S202011527032) and the Natural Science Foundation of China (Grant No. 51678225).