INTRODUCTION
Hydroxyapatite (HAp, Ca10(PO4)6OH2), due to its similarity to the mineral component of the bone, is widely used in biomedical applications. Applications range from artificial eye (Colen, Reference Colen2000) in non-load-bearing to hip and dental implants (Geesink et al., Reference Geesink, de Groot and Klein1987) for improved biological fixation in load-bearing application. However, its poor mechanical properties, such as its brittleness, limits bulk utilization of HAp in the latter. In such applications, the material is rather applied as a coating on metallic substrates such as Ti, Ti alloy, and Cr, thereby combining the excellent mechanical properties of the metal with the osse-integration ability of the bioactive material (de Groot et al., Reference de Groot, Geesink, Klein and Serekian1987). Thermal spraying, due to a number of advantages, is often the technique of choice in depositing the coating to the substrate. The high temperature present in the plasma melts and thermally decomposes the powder (Yang et al., Reference Yang, Wang, Chang and Wu1995), resulting in reduced crystallinity (Gross et al., Reference Gross, Benrdt and Herman1998) and undesirable metastable phases (Gross and Berndt, Reference Gross and Berndt1998). The latter includes such phases as tricalcium phosphate (TCP), tetracalcium phosphate (TTCP), and calcium oxide. These phases have shown to be more soluble in simulated body fluids (Ducheyne et al., Reference Ducheyne, Radin and King1993) and hence may compromise the stability and integrity of the coating (Klein et al., Reference Klein, Patka, Wolke, de Bliek-Hogervorst and de Groot1994). Additionally, differences in thermal expansion coefficients of the coating and substrate materials can lead to the development of residual stresses on cooling (Matejicek et al., Reference Matejicek, Sampath, Brand and Prask1999). Although a significantly biological performance has been achieved (Habibovic et al., Reference Habibovic, Li, van der Valk, Meijer, Layrolle, van Blitterswijk and de Groot2005), problems regarding long-term mechanical stability still persists. In this work, laboratory X rays, having shallow penetration depth, were employed for near-surface studies of changes in phase composition, crystallinity, and residual stress induced by spraying as well as the subsequent incubation process. The possible interplay between these factors was also investigated.
EXPERIMENTAL METHODS
Sample preparation
Hydroxyapatite powder (CAPTAL 90 batch P215), with a size distribution of 120±20 μm, was plasma sprayed onto medical grade Ti–6Al–4V alloy supplied by Biomaterials Limited, North Yorkshire, UK. The powder was supplied by Plasma Biotal Ltd., Tideswell, UK. Disks of 5 mm thickness cut from a 20 mm diameter rod were grit blasted with alumina particles of irregular shape with sizes ranging between 0.5 and 1 mm for improved adhesion. The substrates were then cleaned ultrasonically for 10 min in 10% Tickopur solution mixed with de-ionized water at a temperature of approximately 40°C. Grain morphology was irregular in shape as shown by electron micrograph in Figure 1a.
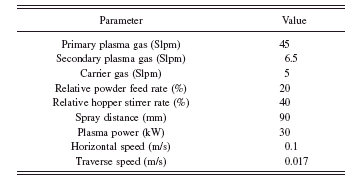
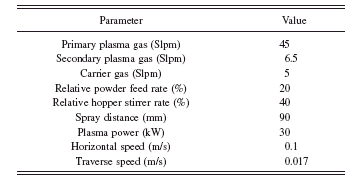
A closer examination shows that the grains are a conglomerate of small crystals. Hence, they have a porous microstructure [see Figure 1b]. Plasma spraying of the substrates was done under atmospheric conditions using a PT M-1000 system equipped with a Sulzer Metco F4 MB plasmatron. The desired plasma heating was provided by a mixture of hydrogen and argon gases. The latter was also used as the carrier gas to transport the powder into the plasma. No external medium was applied to the coating-substrate system for cooling. The powder was injected externally into the plasma following the normal direction of the plasma plume axis. Details of the coating parameters are shown in Table I.
Incubation experiment
To mimic in vivo changes induced within the physiological environment, the as-sprayed samples were immersed in revised simulated body fluid (rSBF). The solution was based

Figure 1. Scanning electron microscopy of the starting hydroxyapatite powder: (a) normal magnification and (b) high magnification showing porous nature of the individual particles.
on Kokubo’s formulation (Kokubo et al., Reference Kokubo, Kushitani, Sakka, Kitsugi and Yamamuro1990) consisting of different amounts of salts in de-ionized water. Compared to human blood plasma, it has a similar ionic concentration but is protein and enzyme free. During the incubation experiment, the temperature and pH of the solution were kept at 36°C and 7.4, respectively. Monitoring of the pH was done electronically with adjustment carried out by adding NaOH. The solution was continuously stirred to avoid any formation and build-up of precipitates. The samples were placed in an incubator maintained at 36±1°C for periods of 1, 7, 28,
TABLE I. Parameters used in the plasma spray of Ti–6Al–4V substrate.

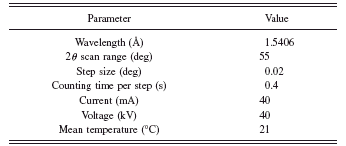
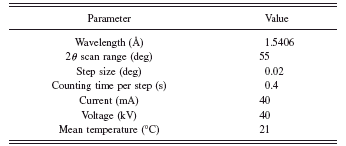
TABLE II. D8 Advance measurement details of the sprayed and incubated coatings.

and 56 days. The volume V(l) of the rSBF used for incubating the samples was calculated as follows:
where A is the coated area to be immersed in the solution. After incubation, the samples were rinsed with de-ionized water and dried at 100°C for 24 h.
Morphology and phase identification
The morphology of the starting powder and deposited layers were investigated by scanning electron microscopy. Phase identification was carried out using X-ray diffractometry techniques. Measurements were carried out on a Bruker D8 Advance diffractometer operated in parallel beam geometry. Probing was done using the 8 keV CuK α radiations with the scattered beam collected using a Lynx eye detector. Details of the measurement parameters are shown in Table II.
Analysis of data for qualitative and quantitative phase identification was done using both Bruker (2007) EVA v13 (Diffracplus) and TOPAS v4.2 (Coelho, Reference Coelho2007) softwares, respectively. The latter employed Rietveld refinement with the starting structure files supplied by the manufacturer’s database and was also utilized for crystallinity examination.
Strain determination
The effect of stress on a polycrystalline sample is a change in the lattice spacing of the diffracting lattice planes, which in 0D and 1D diffractometry is characterized by a shift in the corresponding diffraction peak position. In 2D X-ray diffraction (2D XRD), the presence of residual stresses is indicated by the distortion of the corresponding Debye rings. The theory of stress determination employing 2D XRD is well documented (He et al., Reference He, Preckwinkel and Smith2000). The strain tensor, ε i j, determined in the sample coordinate system S 1S 2S 3, with sample orientation (ω,ϕ,ψ), and distortion of the diffraction ring in a particular direction (η,2θ) are related by

where f i j are the strain coefficients, ln(sinθ 0/sinθ) is the diffraction cone distortion for a particular (η,2θ) position, and θ 0 is the peak position for a stress-free material. The strain tensor components can then be determined by least-squares fitting of Eq. (2). Using Hooke’s law and assuming isotropic conditions, the above equation can be expressed in terms of the stress tensor components as

where p i j are constants. The above equation can be reduced further in the case of a biaxial stress state. Strain measurements were carried out on a Bruker D8 Discover X-ray diffractometer. The beam optics included a graphite monochromator and a 0.8 mm diameter collimator on the primary side, while the diffracted beam was collected using a High Star two-dimensional detector. A laser-video alignment system, with an accuracy of ∼20 μm, was used for sample positioning. Measurements were performed with CuK α radiation in side-inclination mode (Noyan and Cohen, Reference Noyan and Cohen1987). Due to shielding of the detector at high sample tilt angles, measurements were limited to maximum tilt angle of 77° in 2θ.
The diffraction data were analyzed using Bruker (2008) LEPTOS software (Diffracplus). The software first bins the Debye ring into slices of required width and thickness. The sliced data are then reduced into Cartesian format and η-integrated into 1D diffraction profiles. The profile peaks are then fitted with a function of choice such as parabolic, PV, etc., for the determination of peak position. The calculated peak positions from the previous step are then used in least-squares fitting of Eq. (2) for the determination of tensor components.
RESULTS AND DISCUSSION
Figure 2 shows the electron micrograph of the as-sprayed and incubated coatings. The as-sprayed coating surface has a typical plasma sprayed morphology characterized by glassy regions, resulting from the complete flattening and quenching of molten particles [see Figure 2a]. Partially molten and unmolten particles, in the form of hemispheres, can be seen scattered across the surface. Cracks, suggesting the presence of residual stresses, can also be seen running across the surface. Within the first 7 days of incubation, the surface indicated an increased roughness [see Figure 2b], with the partially molten and unmolten particles as well as the glassy regions disappearing. This is due to the dissolution of loosely bound particles and thermally decomposed phases.
Upon closer examination, the onset of small spherical precipitates, as indicated by a black circle in Figure 2b, can be seen across the surface. The continued dissolution enlarges the initial pore size to a large open volume as indicated by white circles. Surface morphology of the coating incubated for 28 days is shown in Figure 2c. From the figure, it can be seen that with further immersion time, the precipitates increase in both number and size covering a bigger surface area as illustrated by the black circle. In addition to the increase in size and number of precipitates, thin needle-shaped fibers start to appear (see the white circles). After 56 days of incubation, the coating shows more and more surface being covered by a precipitate layer, as shown

Figure 2. Scanning electron micrograph of the as-sprayed and immersed coatings: (a) as sprayed, (b) 7 days, (c) 28 days, and (d) 56 days incubated.
in Figure 2d. TEM studies previously done by other authors (Lu and Leng, Reference Lu and Leng2004) have identified the precipitates as octacalcium phosphate.

Figure 3. Superposed powder diffraction pattern of HAp coatings exposed to incubation for different periods.
Powder diffraction
The X-ray diffraction patterns of the HAp powder superimposed on the as-sprayed HAp and incubated coatings are shown in Figure 3. The patterns show that in addition to the initial HAp phase, new phases with corresponding peaks at 2θ positions ∼29°, 30°, and 37° can be seen in the figure. Previous work by other authors have identified as the phases as TTCP, TCP, and CaO, resulting from thermal decomposition. It can be seen that, within the first day of incubation, the calcium oxide peak at ∼37° 2θ has disappeared, while a decrease in the intensity of the tricalcium phosphate and tetracalcium phosphate peaks, indicated by the solid and dashed arrows in the figure, is noticeable.
For an incubation period of seven days, the tricalcium phosphate can barely be seen whilst the calcium oxide peak has completely disappeared and the TTCP peaks are still visible. This is in agreement with Chern Lin et al. (Reference Chern Lin, Liu and Ju1994), who showed that most impurities disappear within the first 10 days. With further incubation, the peak intensity of HAp continues to decrease, as can be seen in the pattern of the 28 days incubated sample. After 56 days of further incubation, all the thermally decomposed peaks have significantly disappeared. An increasing peak broadening, more pronounced at high 2θ around 90°, leads to fusing of overlapping peaks, as shown in the patterns of the 28 and 56 day incubated samples. The weight fractions of the different phases, determined using TOPAS v4 at various stages of incubation, are presented in Figure 4. The figure shows that, in all incubation stages, HAp remains the main phase.
The two major phases, HAp and TTCP, show an opposite trend. In the former, the weight percent increases from 65.94±0.4% to 81.83±0.33% within the first 7 days followed by a gradual decrease before saturating at ∼69%. On the other hand, TTCP decreases from ∼16% to ∼8.0% in the same period followed by a dramatic increase before saturation around 19%. The apparent increase in HAp after 7 days of incubation is due to dissolution of the thermally decomposed phases leaving behind the more stable HAp. This is a testimony to Radin and Ducheyne (Reference Radin and Ducheyne1992), whose studies have shown that the thermally decomposed products dissolve faster as compared to the original crystalline HAp. They

Figure 4. Phase distribution of HAp with incubation time.
have also reported nearly two orders of magnitude in dissolution of sprayed coatings as compared to the starting powder. The dissolution rate increases in the following order (Sun et al., Reference Sun, Berndt, Khor, Cheang and Gross2002):
The acronyms ACP and DCP refer to amorphous calcium phosphate and dicalcium phosphate, respectively. The reduction in HAp observed at intermediate periods can be attributed either to an increased dissolution of HAp after the 7 days, which according to Eq. (4) is not possible, or the existence of a phase composition gradient within the coating thickness. The latter is most likely the case as a result of a possible temperature gradient created during spraying. Such a gradient will have implications on the phase composition of the coating. The dissolution of the outer regions of the coating will expose such a depth dependence of the phase as it removes these regions of the coating. However, Fazan and Marquis (Reference Fazan and Marquis2000) showed that the dissolution process does not continue monotonically with incubation time. At some point, a maximum is reached from which it starts declining or remains constant. A saturated solution nucleates and precipitates, forming bonelike apatite nanocrystals on the coating surface, as shown in Figs.4c and 4d. This has a “shielding” effect on the dissolving ions, reducing or inhibiting further dissolution, as illustrated by the stabilization of both phases at longer immersion periods i.e., from 28 days onwards.
Crystallinity
Figure 5 shows the variation of crystallinity with incubation time. The as-received powder showed crystalline of 99.85%, which upon spraying became slightly amorphous at 90.5%. This is attributed to a quenching effect of the molten splat whereby the individual atoms or molecules are “frozen” on impact inhibiting their rearrangement into a crystalline pattern. As with HAp weight fraction, the crystallinity increases from 90.5% to maximum of ∼98% within the first 7 days, before decreasing and stabilizing at 81% at 56 days of incubation. Amorphous calcium phosphate, being one of the

Figure 5. Variation of degree of crystallinity with incubation time.
more soluble phases, dissolves quickly leaving behind a more crystalline coating. Again the behavior of the pattern follows the same explanation as that of phase composition.
Residual stress
Figure 6 shows the normal residual stress tensor of HAp coating incubated for varying times. The stress tensor components were calculated using X-ray elastic constants of hydroxyapatite, S 1=−2.48×10⁻⁶ MPa−1 and 1/2S 2=11.5×10⁻⁶ MPa−1(Nye, Reference Nye1957) for the 213 reflections. The Kroner–Eshelby interaction model was assumed in the calculations.
Both the normal tensor components (σ 11 and σ 22) are tensile for the as-sprayed coating, decreasing from 135 to 30 MPa and 79 to 40 MPa, respectively. The shear components showed negligible stresses. Yang et al. (Reference Yang, Chang and Lee2003), performing similar investigations on rectangular samples, recorded a compressive surface stress of 44 MPa in the as-sprayed coating, relaxing to 21.2 MPa after 28 days of incubation. The theoretically expected tensile stresses in the as-sprayed coating have also been reported by other authors. Both Brown et al. (Reference Brown, Turner and Reiter1994) and Sergo et al. (Reference Sergo, Sbaizero and Clarke1997), although employing different techniques, recorded the tensile stresses. The observed relaxation of the normal stresses can be attributed to an increase in porosity density as well as open volume defects resulting from dissolution.
CONCLUSION
Near-surface in vitro studies of HAp coatings, for penetration depth <10 μm, were carried out using X-ray diffractometry. Results showed that the first 7 days of coating immersion are crucial for the dissolution of thermally decomposed products and amorphous phase as illustrated by significant changes in phase composition and coating crystallinity. The intermediate period showed solution precipitation on the surface dominating, thereby “shielding” the underlying coating from further dissolution. Dissolution of the soluble phases in the early stages of incubation relaxed the normal residual stress components, σ 11 and σ 22, before stabilizing at longer immersion periods.

Figure 6. Variation of normal residual stress tensor of HAp coatings with incubation: (a) σ 11 and (b) σ 22.
ACKNOWLEDGMENTS
The authors are indebted to Margitta Hengst, Department of Mineralogy, Technische Universität Bergakademie, Freiberg, Germany for providing the samples. The work was sponsored by the German Federal Ministry of Research and Technology (BMBF) and National Research Foundation of the Republic South Africa within the research project “Characterisation and determination of residual stress in bioactive coatings and layered structure” Project Code No. 39.6.G0B.6.A.


