There is growing concern about the concentrations of potentially harmful elements (PHEs) in soil, which may be present as a result of natural geological processes or as a consequence of anthropogenic activities. The latter are particularly important in urban environments, where a variety of transport, energy, construction industry and waste-disposal functions has resulted in soil pollution. PHEs are of interest here because of their possible deleterious effects on human health, and include arsenic (As) (Chen et al. Reference Chen, Chiou, Hsu, Hsueh, Wu and Chen2010), chromium (Cr) (ATSDR 2012) and lead (Pb) (Wright et al. Reference Wright, Dietrich, Ris, Hornung, Wessel, Lanphear, Ho and Rae2008). PHEs enter the human body from soil through one of three principal exposure pathways: ingestion, inhalation and dermal contact (Environment Agency 2009b). As such, many countries around the world have regulatory regimes in place to limit the quantity of PHEs in soil and restrict human exposure (e.g., DEFRA 2014).
Deciding whether the risk of adverse health effects from chronic exposure to chemicals in soil is unacceptable often requires a human health risk assessment (HHRA). One aspect of a HHRA involves comparing representative soil concentrations with regulatory assessment criteria to determine whether a particular land use – e.g., residential – is suitable for its intended purpose. In the UK, these criteria are usually referred to as generic/site-specific assessment criteria (GAC/SSAC) (Environment Agency 2004, 2009b) or soil screening levels (DEFRA 2014). According to Nathanail (Reference Nathanail, McCaffrey, Earl, Foster, Gillett and Ogden2005), GAC ‘should represent contaminant concentrations below which there is no unacceptable risk to human health'. These criteria provide a cautious approach to any risk assessment. Exceedance of these criteria does not necessarily mean that land is unsuitable for its intended use; rather, that detailed investigation is required to examine the validity of a potential source, pathway or receptor linkage for a given chemical and its associated land use (Environment Agency 2009a; DEFRA 2014), resulting in the production of SSAC.
To determine the concentration of metals in soils for HHRA, elemental analysis of PHEs in soil, almost regardless of method, is a relatively expedient (<10 days) and low-cost (<£50 per sample) way to measure the total amount contained in a sample. However, such analyses do not account for the biological or chemical availability of the elements, thereby potentially overestimating the risk and leading to the unnecessary remediation or blighting of land that would otherwise be developable (CIEH 2009). The biological and chemical availability of soil contaminants to humans are proportional to the total concentration present in a given sample. Human oral bioaccessibility is the concentration of a chemical compound dissolved from the soil into solution within the gastro-intestinal compartment and is potentially available for uptake by absorption (Wragg et al. Reference Wragg, Cave, Basta, Brandon, Casteel, Denys, Gron, Oomen, Reimer, Tack and Van de Wiele2011). Human oral bioavailability is the fraction of a chemical compound in soil that, once solubilised, is absorbed across gastro-intestinal epithelial cells and is available for distribution to internal target tissues and organs (Denys et al. Reference Denys, Caboche, Tack, Rychen, Wragg, Cave, Jondreville and Feidt2012). Assessment criteria derived using bioaccessibility data for the ingestion pathway in the UK are an effective basis for reducing conservatism in risk assessment, and, over the past decade or so, have gained broad regulatory acceptance (Nathanail et al. Reference Nathanail, McCaffrey, Earl, Foster, Gillett and Ogden2005; Environment Agency 2009b). In vivo bioavailability data are expensive and raise important ethical issues (Wragg et al. Reference Wragg, Cave, Basta, Brandon, Casteel, Denys, Gron, Oomen, Reimer, Tack and Van de Wiele2011; Denys et al. Reference Denys, Caboche, Tack, Rychen, Wragg, Cave, Jondreville and Feidt2012); thus, in response, in vitro bioaccessibility tests have been developed, which, although costlier than analysis of the total PHE, assist in providing a surrogate for in vivo bioavailability data. Although either bioavailable or bioaccessible data can be used in risk assessment, these measures do not provide information on the solid-phase fractionation of elements in soil (often described as chemical availability). This information is important as it can lead to improvements in the understanding of how and why elements are biologically and chemically accessible, assisting with risk-based land management by providing an additional line of supporting evidence to the decision-making process when the development of contaminated land for human use is being considered (Farmer et al. Reference Farmer, Graham, Thomas, Licona-Manzur, Paterson, Campbell, Geelhoed, Lumsdon, Meeussen, Roe, Conner, Fallick and Bewley1999; Denys et al. Reference Denys, Caboche, Tack, Rychen, Wragg, Cave, Jondreville and Feidt2012; Wragg & Cave Reference Wragg and Cave2012).
The chemical availability of contaminants in soil is often determined using sequential chemical extractions (Cave et al. Reference Cave, Milodowski and Friel2004). Such methods are used to characterise the solid-phase fractionation of elements in soils and sediments and use a series of increasingly aggressive reagents (Bacon & Davidson Reference Bacon and Davidson2008), or, in more recent research (Wragg et al. Reference Wragg, Cave and Gregory2007, Reference Wragg, Cave and Gregory2014a; Wragg & Cave Reference Wragg and Cave2012; Reis et al. Reference Reis, Patinha, Wragg, Dias, Cave, Sousa, Batista, Prazeres, Costa, Ferreira da Silva and Rocha2014), use a sequence of acid extractions of increasing strength. The elements of interest in soil are distributed amongst a series of physico-chemical phases of the matrix, that can be classed as: (1) exchangeable fraction; (2) specifically adsorbed fraction and those associated with carbonates; (3) iron (Fe) and manganese (Mn) oxides; (4) organic matter and sulphides; and (5) mineral lattice (Cave et al. Reference Cave, Milodowski and Friel2004). Sequential extraction methods can generate a large amount of data that need processing in order to assist with the interpretation of the results. This can require a combination of analytical and statistical techniques to collectively produce results that can be used to describe the soils under investigation. One such method is the Chemometric Identification of Substrates and Element Distributions (CISED) and its associated self-modelling mixture resolution (SMMR) algorithm (Cave et al. Reference Cave, Milodowski and Friel2004). Bacon & Davidson (Reference Bacon and Davidson2008) provide a review of the CISED method, which has been used to assist with understanding the solid-phase distribution of elements in soil (Cave et al. Reference Cave, Milodowski and Friel2004; Giacomino et al. Reference Giacomino, Abollino, Malandrino and Mentasti2011) and explain the possible solid-phase associations of the bioaccessible portions of a number of PHEs in soil, including As, cadmium, Cr, nickel (Ni), Pb and antimony (Gal et al. Reference Gal, Hursthouse and Cuthbert2006, Reference Gal, Hursthouse and Cuthbert2007; Wragg et al. Reference Wragg, Cave, Basta, Brandon, Casteel, Denys, Gron, Oomen, Reimer, Tack and Van de Wiele2011, Reference Wragg, Cave and Gregory2014; Wragg & Cave Reference Wragg and Cave2012).
The aim of this study was to determine the solid-phase distribution of As, Cr and Pb to improve understanding of the controls on the bioaccessibility of these PHEs in Glasgow soils.
1. Materials and methods
1.1. Sampling location
Glasgow is Scotland's largest city, with a population of around 600,000, covering an area of approximately 180km2 (National Records Scotland 2016). The city has a long history of heavy industry, which has left a legacy of polluted soil (Farmer & Lyon Reference Farmer and Lyon1977; Gibson & Farmer Reference Gibson and Farmer1983; Farmer et al. Reference Farmer, Graham, Thomas, Licona-Manzur, Paterson, Campbell, Geelhoed, Lumsdon, Meeussen, Roe, Conner, Fallick and Bewley1999; Fordyce et al. Reference Fordyce, Brown, Ander, Rawlins, O'Donnell, Lister, Breward and Johnson2005, Reference Fordyce, Nice, Lister, Dochartaigh, Cooper, Allen, Ingham, Gowing, Vickers and Scheib2012, Reference Fordyce, Everett, Bearcock and Lister2018; Davidson et al. Reference Davidson, Urquhart, Ajmone-Marsan, Biasioli, da Costa Duarte, Díaz-Barrientos, Grčman, Hossack, Hursthouse, Madrid, Rodrigues and Zupan2006; Madrid et al. Reference Madrid, Diaz-Barrientos, Ruiz-Cortes, Reinoso, Biasioli, Davidson, Duarte, Grcman, Hossack, Hursthouse, Kralj, Ljung, Otabbong, Rodrigues, Urquhart and Ajmone-Marsan2006; Ajmone-Marsan et al. Reference Ajmone-Marsan, Biasioli, Kralj, Grčman, Davidson, Hursthouse, Madrid and Rodrigues2008) that is also typical of many other industrial cities worldwide (Johnson et al. Reference Johnson, Demetriades, Locutura and Ottesen2011; Sharma et al. Reference Sharma, Basta and Grewal2015). Principal activities that have led to this in Glasgow include mining for coal, minerals or aggregates, and heavy industry such as ship building, steel and iron manufacturing, railway engineering, car manufacturing, transport (particularly the use of leaded petrol during the 20th Century), energy generation and, until the 1960s, the world's largest chromite ore processing plant (Farmer et al. Reference Farmer, Graham, Thomas, Licona-Manzur, Paterson, Campbell, Geelhoed, Lumsdon, Meeussen, Roe, Conner, Fallick and Bewley1999; Fordyce et al. Reference Fordyce, Nice, Lister, Dochartaigh, Cooper, Allen, Ingham, Gowing, Vickers and Scheib2012, Reference Fordyce, Everett, Bearcock and Lister2018). The disposal of chromite ore processing residue (COPR) from the chromite plant to landfill has led to localised pollution, with Cr concentrations of up to 15,600mgkg–1 reported in soil in Glasgow (Farmer et al. Reference Farmer, Graham, Thomas, Licona-Manzur, Paterson, Campbell, Geelhoed, Lumsdon, Meeussen, Roe, Conner, Fallick and Bewley1999; Bewley et al. Reference Bewley, Jeffries, Watson and Granger2001).
Fordyce et al. (Reference Fordyce, Everett, Bearcock and Lister2018) report ranges in total concentration for As (<0.9–850mgkg–1), Cr (34–5334mgkg–1) and Pb (12–9937mgkg–1) in 2333 urban topsoils collected across the Glasgow conurbation as part of the British Geological Survey (BGS) Geochemical Baseline Survey of the Environment (G-BASE) Programme. As a result of urban pollution, median Cr (102mgkg–1) and Pb (125mgkg–1) concentrations are significantly elevated in urban topsoils relative to rural topsoil medians for Scotland (Cr: 41mgkg–1; Pb: 23mgkg–1; Paterson Reference Paterson2011). Arsenic was not determined in Scottish rural soils (Paterson Reference Paterson2011). Topsoil Cr concentrations are higher than most other UK cities as a result of the history of chromite ore processing in the city (Fordyce et al. Reference Fordyce, Brown, Ander, Rawlins, O'Donnell, Lister, Breward and Johnson2005, Reference Fordyce, Everett, Bearcock and Lister2018). In contrast, Fordyce et al. (Reference Fordyce, Brown, Ander, Rawlins, O'Donnell, Lister, Breward and Johnson2005) report that topsoil As concentrations in Glasgow are lower than other UK cities (median range 10–53mgkg–1). The median Pb concentration in Glasgow falls within those reported (40–225mgkg–1) for the other UK studies considered by Fordyce et al. (Reference Fordyce, Brown, Ander, Rawlins, O'Donnell, Lister, Breward and Johnson2005). A comparison of As, Cr and Pb concentrations in Glasgow soils with HHRA criteria indicated exceedances for Cr. Following possible health concerns about Cr in particular (Farmer & Jarvis 2009), methods to assess soil bioaccessibility were optimised for Cr to inform HHRA. These included the application of the Unified Barge Method (UBM) (Denys et al. Reference Denys, Caboche, Tack, Rychen, Wragg, Cave, Jondreville and Feidt2012) and CISED (Cave et al. Reference Cave, Milodowski and Friel2004) methodologies to selected soils from Glasgow. Whilst the primary focus of these investigations was Cr, the bioaccessibilities of As and Pb were also determined. The results of the UBM bioaccessibility assessments for Cr and Pb have been documented previously (Broadway et al. Reference Broadway, Cave, Wragg, Fordyce, Bewley, Graham, Ngwenya and Farmer2010; Farmer et al. Reference Farmer, Broadway, Cave, Wragg, Fordyce, Graham, Ngwenya and Bewley2011; Appleton et al. Reference Appleton, Cave and Wragg2012a, Reference Appleton, Cave and Wraggb, Reference Appleton, Cave, Palumbo-Roe and Wragg2013).
1.2. Sample selection, collection and preparation
1.2.1. Sample selection
The 27 soils used in this study comprised 21 samples selected from those collected in 2001–2002 as part of the BGS G-BASE survey of the Glasgow area (Fordyce et al. Reference Fordyce, Nice, Lister, Dochartaigh, Cooper, Allen, Ingham, Gowing, Vickers and Scheib2012, Reference Fordyce, Everett, Bearcock and Lister2018) and six collected in 2005 from locations in areas previously identified as at least potentially contaminated with Cr from COPR disposal (Broadway et al. Reference Broadway, Cave, Wragg, Fordyce, Bewley, Graham, Ngwenya and Farmer2010). The 21 samples in the former group were selected on the basis of G-BASE sites, where previous X-ray fluorescence analysis had shown that the total concentrations of Cr, Pb and As exceeded the UK soil assessment criteria adopted at that time for the observed land use (e.g., gardens and recreational land), with a high potential for contact with the human population, especially children. These included one sample in Muirend taken from a sports ground known to be impacted by COPR waste (Broadway et al. Reference Broadway, Cave, Wragg, Fordyce, Bewley, Graham, Ngwenya and Farmer2010). The locations of the sampling sites and a fuller description of those sites are given in Figure 1 and Table 1, respectively. The pH of the soils ranged from 3.8 to 7.7 (mean 5.3±0.8), and the total organic carbon content, from 7.7% to 30.5% (mean 15.8±5.6%) (Broadway et al. Reference Broadway, Cave, Wragg, Fordyce, Bewley, Graham, Ngwenya and Farmer2010). Samples were collected from sites with six different land uses (Table 1).
Figure 1 Map of soil sampling locations in the Glasgow area. Samples 19I, 20S and 24S (highlighted in bold) are known to contain COPR. Map generated in ArcGIS (ESRI®) geographic information system software.
Table 1 Total soil As, Cr and Pb concentrations (mgkg–1) with location and land use. Abbreviations: G = domestic garden; I = industry; P = park; R = residential grass area; S = sports ground; SC = school.
1 Samples in areas of COPR waste.
1.2.2. G-BASE sample collection
At each site, a sample comprising a composite of <2mm topsoil from 5–20cm depth from the corners and centre of a 20×20m square was collected using a handheld Dutch auger and then analysed for its total element concentration according to standard G-BASE procedures (Fordyce et al. Reference Fordyce, Brown, Ander, Rawlins, O'Donnell, Lister, Breward and Johnson2005, Reference Fordyce, Everett, Bearcock and Lister2018). Excess sample material was stored under ambient conditions in the BGS National Geoscience Data Centre. Subsamples of BGS G-BASE archive <2mm topsoil material were selected for the present study and further sieved to <250μm, as this fraction is considered to be the largest fraction that will stick to the hands of children (Denys et al. Reference Denys, Caboche, Tack, Rychen, Wragg, Cave, Jondreville and Feidt2012).
1.2.3. Cr-contaminated site sample collection
At each site, a single composite soil sample was collected. A composite sample consisted of three individual flights collected with a handheld Dutch auger from the corners of a 2m equilateral triangle (Palumbo-Roe et al. Reference Palumbo-Roe, Cave, Klinck, Wragg, Taylor, O'Donnell and Shaw2005; Broadway et al. Reference Broadway, Cave, Wragg, Fordyce, Bewley, Graham, Ngwenya and Farmer2010). As with the G-BASE sampling procedure, only the surface soil (5–20cm) was collected.
1.2.4. Sample preparation
The soil samples were oven-dried at 35±2°C. Each dried coarse sample (including the 21 < 2mm G-BASE samples) was gently disaggregated by hand with a porcelain pestle and mortar to ensure the breakage of aggregates, but not clasts, and the disaggregated sample then sieved to <250μm for the determination of human oral bioaccessible concentrations. Subsamples (∼10g) of the <250μm fraction were milled for mixed acid total digestion.
1.3. Laboratory analysis
1.3.1. Total element concentrations
The total elemental composition of the 27 soils was determined by inductively coupled plasma optical emission spectrometry (ICP-OES) following acid digestion (HNO3/HF) using a modified version of the USEPA Method 3052 (USEPA 1995) previously described in full by Broadway et al. (Reference Broadway, Cave, Wragg, Fordyce, Bewley, Graham, Ngwenya and Farmer2010). A digestion run consisted of six soil samples (in duplicate), one reference soil (Czech Metrological Institute, sample number 7002 (CMI 7002)) and a reagent blank. The total element recoveries of CMI 7002 were within ±10% for As, Cr and Pb, and the results for blank extractions were all less than the respective detection limit.
1.3.2. Soil mineralogy
X-ray diffraction (XRD), using a Bruker-AXS D8 Advance with Cu Kα X-ray tube with data identification using DIFRACplus EVA software, was used to provide qualitative mineralogical evidence to support the identification of solid-phase hosts of PHEs in the soils.
1.3.3. Human oral bioaccessible PHEs
The UBM (Denys et al. Reference Denys, Caboche, Tack, Rychen, Wragg, Cave, Jondreville and Feidt2012), an in vitro method to simulate physico-chemical conditions in the human gut, was used to measure the concentration of soil PHE that is accessible to humans after accidental soil ingestion. Simulation of the gut is carried out by way of a three-stage sequential extraction that approximates physiologically and chemically relevant conditions in the human gastro-intestinal system (e.g., temperature, transit times though the gut, gut fluid composition and pH). The UBM procedure used to determine PHE bioaccessibility in this study has been previously fully documented (Broadway et al. Reference Broadway, Cave, Wragg, Fordyce, Bewley, Graham, Ngwenya and Farmer2010; Farmer et al. Reference Farmer, Broadway, Cave, Wragg, Fordyce, Graham, Ngwenya and Bewley2011). Other studies (Roussel et al. Reference Roussel, Waterlot, Pelfrene, Pruvot, Mazzuca and Douay2010; Okorie et al. Reference Okorie, Entwistle and Dean2011; Pelfrene et al. Reference Pelfrene, Waterlot, Mazzuca, Nisse, Bidar and Francis2011; Wragg et al. Reference Wragg, Cave, Basta, Brandon, Casteel, Denys, Gron, Oomen, Reimer, Tack and Van de Wiele2011, Reference Wragg, Cave and Gregory2014; Wragg & Cave Reference Wragg and Cave2012; Reis et al. Reference Reis, Patinha, Wragg, Dias, Cave, Sousa, Batista, Prazeres, Costa, Ferreira da Silva and Rocha2014) have applied the methodology across Europe and North America as it has been developed and validated.
1.3.4. CISED extractable PHEs
The number and composition of soil geochemical phases, potentially hosting the PHE of interest (As, Cr, Pb), in the 27 soils were identified using the CISED method. CISED is a non-specific sequential extraction method that uses increasing concentrations of Aqua Regia (AnalaR grade: 70%; HCl: 30% HNO3) to extract the geochemical phases of a soil and identify the distribution of PHE of interest (e.g., As, Cr and Pb) therein. The practical application of the CISED has been previously described by Wragg & Cave (Reference Wragg and Cave2012). The ease of extraction of individual geochemical phases is related to their chemical composition and the stage in the CISED where it is extracted (e.g., at high or low acid strength), providing an indication of the environmental mobility of (for this work) As, Cr and Pb. The advantages that this non-specific extraction affords over traditional sequential extractions, its application to soil samples and the methodology for naming the geochemical phases have been previously described in full (Cave et al. Reference Cave, Milodowski and Friel2004). For this study, a total of 378 extracts were generated (14 extracts per soil; n=27) and analysed for >20 elements. The resulting multi-element data are resolved into the individual geochemical phases, some of which act as hosts for PHE, using a SMMR algorithm, programmed and executed in the Matlab© programming language (Cave Reference Cave2008).
1.4. Data presentation and statistical analysis
To derive a common set of soil components for the Glasgow area, the SMMR algorithm was applied to a combined multi-element dataset for the 27 soils, rather than resolving the data for each individual soil (Wragg & Cave Reference Wragg and Cave2012; Wragg et al. Reference Wragg, Cave and Gregory2014). The CISED results are summarised by plotting the amount of each component in the different test soils with the stage in the sequential extraction process that the component was released and, separately, identification and quantification of the amount of PHEs of interest in each component. Cluster analysis was undertaken (section 2.4), using Matlab© to rationalise and visualise the number of identified components into broader physico-chemical groupings (clusters) in a consistent manner to simplify discussion and visualisation (Wragg et al. Reference Wragg, Cave and Gregory2014). Statistical analysis and subsequent figure generation was carried out using Matlab© (Fig. 2) and R (R Core Team 2016) (Figs 3–8).
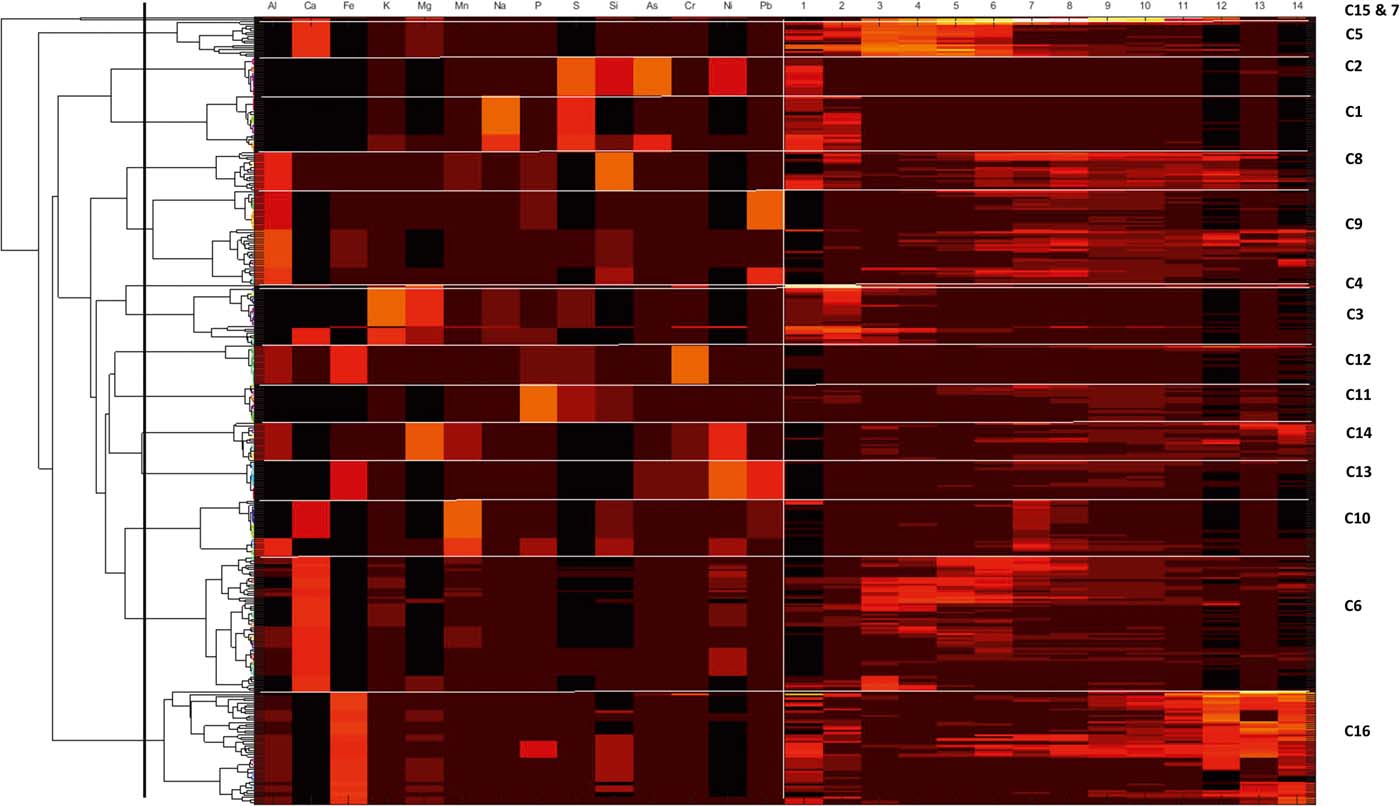
Figure 2 Colourmap and associated dendogram for the combined CISED data matrix data. The dendrogram along the left-hand side shows how the individual geochemical phases of the three groups link together. The horizontal lines divide the colourmap into clusters (indicated by C1–C16) and the vertical line separates the element composition data on the left-hand side from the extraction number data on the right. A high proportion of each component and an indication of its composition are shown by a yellow/orange/red colouration, while a low proportion is indicated by a dark red or black colouration.
Figure 3 Plot of total As, Cr and Pb concentrations in Glasgow soils stratified by land-use type. Abbreviations: G = domestic garden (n=4); I = industry (n=2); P = park (n=8); R = residential grass area; S = sports ground (n=5); SC = school (n=1).

Figure 4 Plot of detectable bioaccessible As, Cr and Pb concentrations in the Glasgow soil samples stratified by land use. Abbreviations: G = domestic garden; I = industry; P = park; R = residential grass area; S = sports ground; SC = school.
Figure 5 Plot of percentage bioavailable fraction of As, Cr and Pb in the Glasgow soil samples stratified by land use. Abbreviations: G = domestic garden; I = industry; P = park; R = residential grass area; S = sports ground; SC = school. See Table 1 for locations of Samples 20 and 24.
Figure 6 The abundance (mgkg–1) of the cluster types. The number of samples in each cluster is presented in the boxes. Abbreviations: Al.dom = Al-dominated; Ca.dom = Ca-dominated; Exch: exchangeable; Fe.dom = Fe-dominated; Fe/Al.ox = Fe or Al oxides; Mg.dom = Mg-dominated; Mn.dom = Mn-dominated; P.dom = P-dominated; PW = pore water.

Figure 7 The abundance (mgkg–1) of the cluster types in the three soil sample groupings (if present). The number of samples in each cluster is presented in the boxes. Abbreviations: Al.dom = Al-dominated; Ca.dom = Ca-dominated; Exch: exchangeable; Fe.dom = Fe-dominated; Fe/Al.ox = Fe or Al oxides; Mg.dom = Mg-dominated; Mn.dom = Mn-dominated; P.dom = P-dominated; PW = pore water; GP1 = Group 1; GP2 = Group 2; GP3 = Group 3.
Figure 8 As, Cr and Pb median cumulative extractability using the CISED and UBM methods. The CISED data are represented by a solid black line and the median bioaccessibility is represented by a dashed black line. Rows A–C show the individual As, Cr and Pb extractability in the three soil sample groupings and columns 1–3 compare the extractability of As, Cr and Pb within each group.
2. Results and discussion
2.1. Soil mineralogy
XRD analysis of the soils identified a number of common soil-forming constituents: quartz, anorthite, kaolinite, calcite, hematite, chlorite, muscovite, goethite, dickite and greenalite. Each individual sample contained a varied combination of these, reflecting underlying soil parent materials and land use (Broadway Reference Broadway2008). Mullite, a rare mineral used as a refractory material (e.g., in furnace linings), was found in Sample 3. The source of this mineral is unknown as it was collected from a residential grass area/road verge with no previous industrial land use.
2.2. Total As, Cr and Pb concentrations in Glasgow soils
The results of elemental analysis in the soils have been previously described (Broadway et al. Reference Broadway, Cave, Wragg, Fordyce, Bewley, Graham, Ngwenya and Farmer2010; Farmer et al. Reference Farmer, Broadway, Cave, Wragg, Fordyce, Graham, Ngwenya and Bewley2011; Appleton et al. Reference Appleton, Cave and Wragg2012a, Reference Appleton, Cave and Wraggb). In summary, the total elemental concentrations in the soils were in the range <0.1–135mgkg–1 for As, 65–3680mgkg–1 for Cr and 126–2160mgkg–1 for Pb (Table 1). In statistical analysis, it is generally accepted that a minimum of five samples are required to establish a data distribution (Stockburger Reference Stockburger2001). In the current dataset, several land-use classes contained less than five soil samples, which precluded the calculation of robust estimates of statistically significant relationships between soil element concentration and land use. However, from visual inspection of the reported element concentrations in Table 1 and Figure 2, it is clear that the highest total As and Pb concentrations are recorded in some of the residential grass areas, sports ground and domestic garden soils. This may reflect the presence of artificial ground used for landscaping residential grass areas and sports grounds and, in the case of Pb, the proximity to road verges in several of the residential grass areas. The higher values in some garden soils are possibly the result of the application of domestic coal ash as a soil conditioner (Fordyce et al. Reference Fordyce, Nice, Lister, Dochartaigh, Cooper, Allen, Ingham, Gowing, Vickers and Scheib2012, Reference Fordyce, Everett, Bearcock and Lister2018).
The highest total-Cr concentrations are recorded in Samples 20 and 24 collected from sports grounds in Rutherglen and Muirend, and Sample 19 from an industrial site in Rutherglen, all within areas known to be impacted by COPR waste (Table 1; Fig. 2). Broadway et al. (Reference Broadway, Cave, Wragg, Fordyce, Bewley, Graham, Ngwenya and Farmer2010) reported hexavalent CR (Cr(VI)) concentrations in these soils of 1485, 171 and 23mgkg–1 Cr(VI), respectively, indicating the strong influence of COPR, particularly in Samples 20 and 24, with Cr(VI) amounting to 40 and 26%, respectively, of the total Cr.
2.3. Human oral bioaccessible As, Cr and Pb by the UBM
The bioaccessibility of Cr, Pb and As in the Glasgow soils used in this study has been previously described in detail (Broadway et al. Reference Broadway, Cave, Wragg, Fordyce, Bewley, Graham, Ngwenya and Farmer2010; Farmer et al. Reference Farmer, Broadway, Cave, Wragg, Fordyce, Graham, Ngwenya and Bewley2011; Appleton et al. Reference Appleton, Cave and Wragg2012a, Reference Appleton, Cave, Palumbo-Roe and Wragg2013). In general, higher bioaccessible As, Cr and Pb concentrations are reported in samples with a greater total concentration of these elements. Bioaccessible As, Cr and Pb are referred to as B-As, B-Cr and B-Pb in the following discussion.
Where the data were above the instrumental limit of detection (Cr: 3 and 5mgkg–1 in the stomach and intestine compartments, respectively; As: 6 and 5mgkg–1 in both compartments, respectively; Pb: 5mgkg–1 for both compartments), the bioaccessible fraction (BAF) of each PHE in the soils was calculated as a percentage of the total concentration using the highest value obtained from the gastric (G) or gastro-intestinal (GI) phase (Table 2). The mean % BAF of As (GI) was 35.6±11.1%, ranging from 16 to 48%, 7.6±7.6% (3–31%) for Cr (G) and 52±13.4% (23–77%) for Pb (G). Analysis of variance on the three BAF populations shows a significant difference between all three elements.
Table 2 Bioaccessible As, Cr and Pb concentrations and the respective bioaccessible fraction (BAF) in the Glasgow soil samples. n = samples above analytical limit of detection only. As = stomach + intestine (GI) phase; Cr and Pb = stomach phase (G). Abbreviations: B-As = bioaccessible As; B-Cr = bioaccessible Cr; B-Pb = bioaccessible Pb.

1 Samples in areas of COPR waste.
These results are broadly comparable with those reported in a separate study (Sialelli et al. Reference Sialelli, Urquhart, Davidson and Hursthouse2010) of 20 Glasgow soil samples (Cr intestine phase 5–29%; Pb stomach phase 21–44%), despite the differences in sampling approaches (including sample locations) and extraction methodologies. The % BAF is relative to the total and bioaccessible concentrations. Sialelli et al. (Reference Sialelli, Urquhart, Davidson and Hursthouse2010) used a HCl:HNO3 3:1 acid digestion to determine the total elemental PHE concentration, which is less aggressive than the HF/HNO3 digestion used here (resulting in possible lower total concentrations) and a bioaccessibility method with different pH, chemical composition, extraction time and agitation methods compared to the UBM.
Bioaccessible soil PHE concentration is shown in Figure 4, stratified by land-use type. Detectable B-As is present in only nine of the samples, mainly those from residential grass area and sports ground land-use types. A river walkway in an industrial site (Sample 21), samples collected close to road verges from a domestic garden (Sample 9) and a school playground (Sample 13) (Table 2) also contain quantifiable B-As. Bioaccessible As was not detected in many parkland soils and the soil collected from industrial land in Rutherglen (Sample 20; Table 2). Bioaccessible Pb was measurable in all the soil samples, with highest values reported in residential grass area soils over artificial ground and in a domestic garden (Sample 7; Table 2). The higher B-As and B-Pb in residential gardens and grass areas reflect the higher total content of these elements in these samples. Detectable B-Cr was reported in only 15 of the soils, from a variety of land-use types (Table 2). The highest B-Cr was recorded in the two soils impacted by COPR waste from Rutherglen and Muirend (Samples 20 and 24; Table 2; Fig. 4). It was demonstrated that this was related to the greater Cr(VI) content in these samples (Broadway et al. Reference Broadway, Cave, Wragg, Fordyce, Bewley, Graham, Ngwenya and Farmer2010). Comparison of the % BAF results between the samples (Table 2; Fig. 5) indicates that a greater proportion of Cr is bioaccessible in these two COPR-influenced soils than in soils from other land-use types. With the exception of these two samples, the % BAF Cr (5±2%) is similar in the other soils, regardless of land-use type. Similarly, there are no consistent relationships between % BAF As and land use or between land use and the presence or absence of detectable soil B-As or B-Cr (Table 2; Figs 4, 5). The % BAF for Pb shows a similar range for all land-use types (Table 2; Fig. 5).
The results suggest that with the exception of the COPR-impacted samples, land use per se is not a controlling factor on element bioaccessibility. To better understand the likely influences on element bioaccessibility in the soils, the CISED approach was adopted to determine the likely solid phases hosting As, Cr and Pb in the soils and their relative mobility.
2.4. CISED
The summed concentrations of As, Cr and Pb associated with the 14 extracts of the CISED (per soil) were compared to the total concentrations to calculate element recovery information and used as a proxy for element mobility: As, Cr and Pb recoveries were 12–100, 5–85 and 66–100%, respectively. The mobility range indicates that all three PHEs are mobile across the samples under investigation, with Pb mobility being >50% for all of the soils.
To identify the physico-chemical component hosts of As, Cr and Pb in the 27 samples, the SMMR method (developed by Cave Reference Cave2008) was applied to the whole data set (rather than on an individual sample basis) in a similar manner to previous studies (Wragg & Cave Reference Wragg and Cave2012; Wragg et al. Reference Wragg, Cave and Gregory2014). The data matrix comprised 378 rows of extraction data (14 extracts, 27 soils) for 21 elements. Initial data assessment of the SMMR outputs for the 27 test soils indicated three distinct groupings of samples, based on the composition of the geochemical phases and the acid concentration required for their removal from the soils. Table 3 provides a summary of the samples in each cluster grouping and the mean total concentration (mgkg–1) of As, Cr and Pb in each grouping.
Table 3 Mean total concentrations of As, Cr and Pb in each distinct sample grouping (Groups 1–3).

1 Samples in areas of COPR waste.
Group 1 contains eight samples, whereas Group 2 contains 18 samples. Group 3 comprises the COPR-impacted Sample 20 collected from a known COPR waste site in Rutherglen (Table 3). The geochemistry of this sample is clearly distinct from the rest of the samples in the SMMR. Groups 1 and 2 both contain soils that were collected across the city. There is no clustering of soils from particular sections of the city. Both groups contain soil samples that were collected over Devonian sandstone, Carboniferous sandstone, Carboniferous Limestone and coal measures geology. However, Group 2 contains four samples collected over the Clyde Plateau Volcanic Formation. Both groups contain soils from a range of land-use types, and there are no obvious differences in soil texture as reported during collection or mineralogical composition as measured by XRD analysis between the two groups.
In terms of the element concentrations in each group, As, potassium (K), sodium (Na) and total organic carbon (TOC) show similar ranges between the two groups of soil samples. Group 2 soils have higher Aluminium (Al), barium, calcium (Ca), Cr, copper, Fe, Mn, Ni, sulphur (S), vanadium (V), zinc and pH, but lower phosphorus (P) and silicon (Si) than Group 1. This may reflect the inclusion of COPR samples from Rutherglen (Sample 19) and Muirend (Sample 24) in particular (which are known to be COPR-impacted) in this group, as the COPR is highly alkaline, with higher Ca and metal contents. The higher Al, Fe, Mn and V and lower Si in this group may also reflect the geochemistry of soils collected over the Clyde Plateau Volcanic Formation. However, with the exception of the COPR-impacted Sample 20 in Group 3, clear spatial, geological, land-use or mineralogical reasons for the SMMR groups are difficult to discern.
The comparison of mean total As, Cr and Pb concentration in Groups 1 and 2 shows that higher values are related to the Group 2 soils. The single soil in Group 3 (Sample 20; Table 3) is distinguished from the Group 2 soils because of the higher total concentration of As and Cr compared to the average for the two samples in Group 2, whereas the opposite is true for the total concentration of Pb.
The SMMR method was individually applied to CISED data matrices after separation into the three groupings identified by the cluster algorithm (Table 3). The output information obtained from the separate applications resulted in 7, 17 and 5 geochemical phases for Groups 1–3, respectively, each with its own extraction profile (amount of the component at extraction points 1–14). The geochemical phases for each group were named according to the previously described procedure (Wragg et al. Reference Wragg, Cave and Gregory2014; Cave et al. Reference Cave, Wragg, Gowing and Gardner2015), which uses the elemental composition (where an element makes up >10% of the physico-chemical composition). Because the number of identified geochemical phases in each group, their composition and the amount of each geochemical phase in each soil (extracts 1–14) are different, it is difficult to directly compare the information. To aid the comparison of information, hierarchical cluster analysis, using a previously described method (Wragg & Cave Reference Wragg and Cave2012; Cox et al. Reference Cox, Chelliah, McKinley, Palmer, Ofterdinger, Young, Cave and Wragg2013; Wragg et al. Reference Wragg, Cave and Gregory2014), was applied to the CISED SMMR data to derive a consistent number of geochemical phases (‘clusters') across the set of 27 sample soils. Figure 9 is an overview of the data processing, which is described in detail in the following sections. The composition (Al, Ca, Fe, K, magnesium (Mg), Mn, Na, P, S, Si, As, Cr, Ni, Pb) and extraction profile information for each geochemical phase in each soil was collated, producing a data matrix of 366 rows (one for each geochemical phase in the soils (Groups 1–3)) and 28 columns (elemental composition information and the amount of each geochemical phase (extracts 1–14)). The new collated data matrix was subjected to hierarchical clustering, where the data were mean-centred and scaled with Euclidean distance, and linkage was determined using Ward's method. The output, in the form of a colourmap (Fig. 2), was used as a visual aid to identify clusters of similar geochemical phases with respect to their elemental compositions (%) and extraction position, where the geochemical phases that make up the clusters were extracted during the CISED method (extracts 1–14).
Figure 9 Overview of data manipulation process to rationalise the geochemical information from the CISED extraction.
2.4.1. Cluster identification
Sixteen geochemically distinct clusters were identified in the data set, using the elemental composition information from Figure 2 (supported by XRD information) and ordered in relation to their ease of extractability (right-hand side of Fig. 2). Clusters were named according to the position in the CISED where they were observed and their elemental composition: e.g., C1, comprising residual pore salts, observed at extraction points 1 and 2 containing Na and S; C5, dominated by Ca and extracted on the first addition of Aqua Regia (0.01M). The identified clusters were residual pore water (C1), organic (C2), Mg-dominated (C4, 14 and 15) and Ca-dominated (C12, 13 and 16). A detailed description of the 16 clusters is available in the supplementary information (supplementary Table 1, available at https://doi.org/10.1017/S1755691018000762). Table 4 summarises the median PHE distribution (mgkg–1 and % of the total CISED extractable) within the 16 clusters, re-ordered according to their extraction position in the CISED (columns 1–14 of Fig. 2).
Table 4 Median potentially harmful element (PHE) distribution (mgkg–1 and %) within the 16 clusters, re-ordered according to their extraction

The clusters were grouped, for example, into Fe- or Al-dominated, and their abundance calculated. This information was used to aid the identification process. Figures 6 and 7 summarise, respectively, the abundance (mgkg–1) of each cluster type across the whole data set as box and whisker plots and the abundance of each cluster, where present, in the three sample groupings identified in section 2.4. In general, the most abundant clusters are those associated with Fe, Al, Ca, Mg and P, whereas soil pore water, exchangeable, organic and Mn-dominated clusters are less abundant.
2.4.1.1. As
The cluster classed as organic (C2) was the primary host of As (5.03mgkg–1, 34.6 % of the total extractable As). On the breakdown of organic components (by the addition of H2O2), any chelated inorganic constituents can be released into solution, especially in the presence of metal ions such as amorphous Al or Fe oxyhydroxides (Pfeifera et al. Reference Pfeifer, Gueye-Girardet, Reymond, Schlegel, Temgoua, Hesterberg and Weiqing Chou2004). The relatively high As concentration in the combined easily extractable clusters (residual pore water + organic + exchangeable) indicates the greater mobility of As compared to Cr and Pb (Table 4).
2.4.1.2. Cr
A study by Davidson et al. (Reference Davidson, Urquhart, Ajmone-Marsan, Biasioli, da Costa Duarte, Díaz-Barrientos, Grčman, Hossack, Hursthouse, Madrid, Rodrigues and Zupan2006) used the four-step Community Bureau of Reference sequential extraction method for analysing Glasgow soils. The methodology identifies water/acid soluble and exchangeable, reducible, oxidisable and residual soil phases. Davidson et al. (Reference Davidson, Urquhart, Ajmone-Marsan, Biasioli, da Costa Duarte, Díaz-Barrientos, Grčman, Hossack, Hursthouse, Madrid, Rodrigues and Zupan2006) reported that, in general, the Cr was partitioned across all extractable phases, with the highest proportion of Cr associated with the residual fraction. Table 4 indicates that a Mg-dominated phase (C15) was a significant host of Cr (88%) in this study using the CISED method, which, unlike the study by Davidson et al. (Reference Davidson, Urquhart, Ajmone-Marsan, Biasioli, da Costa Duarte, Díaz-Barrientos, Grčman, Hossack, Hursthouse, Madrid, Rodrigues and Zupan2006), was focussed on soils impacted by COPR waste. This phase was extracted later in the CISED extraction using high concentrations of Aqua Regia (1.0–5.0M), which is comparable to the fourth step of the Community Bureau of Reference (BCR) residual phase and is, therefore, in agreement with previous findings.
2.4.1.3. Pb
In a similar study to Davidson et al. (Reference Davidson, Urquhart, Ajmone-Marsan, Biasioli, da Costa Duarte, Díaz-Barrientos, Grčman, Hossack, Hursthouse, Madrid, Rodrigues and Zupan2006), Gibson & Farmer (Reference Gibson and Farmer1986) adopted a six-step scheme based on modifications of several published methods (with phases defined as exchangeable; carbonate bound; easily reducible (Mn oxides and hydroxides); moderately reducible (Fe oxides); organic; and residual). These authors found that Pb was preferentially partitioned into the moderately reducible fraction (51%), with the remainder in the organic (19%), residual (17%), combined exchangeable and carbonate bound (13%) and easily reducible (0.4%) fractions of Glasgow soils. Similarly to Gibson & Farmer (Reference Gibson and Farmer1986), Davidson et al. (Reference Davidson, Urquhart, Ajmone-Marsan, Biasioli, da Costa Duarte, Díaz-Barrientos, Grčman, Hossack, Hursthouse, Madrid, Rodrigues and Zupan2006) found that a large proportion of Pb was in the reducible phase. This study associated Pb with the alumino-silicate phases (48%) and the Mg-dominated phase (41%) (Table 4). Since the BCR steps are methodologically defined and the CISED components are defined by the chemical composition of the extracts, it is not always possible to make a direct comparison between the two methods. In this instance, however, the BCR suggests that Pb is associated with the reducible phase, usually linked to Fe/Mn oxides, whereas the CISED method suggests that Fe/Mn oxides are not the main host for Pb in the Glasgow soils.
2.5. Relationship between distribution of PHE and bioaccessibility
For the identification of the sources of bioaccessible PHEs in the soils from Glasgow, the same approach as that of other similar studies was used (Palumbo-Roe et al. Reference Palumbo-Roe, Cave, Klinck, Wragg, Taylor, O'Donnell and Shaw2005; Wragg & Cave Reference Wragg and Cave2012; Cox et al. Reference Cox, Chelliah, McKinley, Palmer, Ofterdinger, Young, Cave and Wragg2013), i.e., by relating the cumulative PHE fractionation (row A–C for As, Cr and Pb) in the identified clusters (1–16) to the bioaccessibility data from the UBM, separated by the sample groupings (Fig. 8). The position at which the cumulative extracted PHE is intersected by the bioaccessibility of each PHE gives an indication of the physico-chemical clusters that have been dissolved/digested in the UBM, and are likely to be the main source of the bioaccessible PHE.
The comparison of As, Cr and Pb bioaccessibility (rows A–C respectively) within the three individual sample groups (Fig. 8) reveals the following points:
Bioaccessible As in all of the samples in the three groups (Fig. 8a, left to right) is associated with the more easily extractable clusters (Groups 1 and 3: Clusters 1–5 identified in section 2.4 and supplementary Table 1 as residual pore salts, organic, exchangeable, Mg-dominated, Ca–Mg carbonate); Group 2: Cluster 1 identified as residual pore salts).
Cr bioaccessibility is a result of the dissolution of Cr (Fig. 8b, left to right) present in all of the identified Cr-bearing clusters:
Cr bioaccessibility in the samples from Group 1 is a result of the digestion/dissolution of the same easily extractable clusters as for As (Clusters 1–5), along with Clusters 6–10 (see Table 4 for identification). Because the bioaccessibility intersects the cumulative extracted Cr between Clusters 15 (Mg-dominated) and 16 (one of the Fe-dominated clusters), it is likely that the partial dissolution of Cluster 16 may also be a source of bioaccessible Cr (Clusters 11–15 do not act as hosts for Cr).
Figure 8b (column 2) indicates that bioaccessible Cr in Group 2 is a result of the dissolution of Clusters 1–11. These comprise the easily extractable (Clusters 1–3), Mg-dominated (Cluster 4), Ca-dominated (Clusters 5–7), Alumino silicates (Clusters 8 and 9), Mn- and P-dominated (Clusters 10 and 11) and partial dissolution of Cluster 12 (Fe-dominated).
Bioaccessible Cr in Group 3, a sample from Rutherglen contaminated by COPR with high ca.3600mgkg–1 total Cr (Table 1), is a result of the dissolution of Cr associated with all clusters, but mainly Cluster 15 (see Table 4).
For Groups 1 and 2 (Fig. 8c), the bioaccessible Pb results from the dissolution of Clusters 1–8 (easily extractable, carbonates and alumina silicates) and the partial dissolution of Cluster 9 (alumina silicate, Table 4), with Group 3 associated with the dissolution of Pb from Clusters 1–14 and the partial dissolution of Cluster 15 (Mg-dominated cluster at higher acid concentrations than Cluster 14).
3. Conclusions
A wide range of total PHE concentrations were observed in 27 topsoil samples collected from a variety of land uses across Glasgow, which included seven samples from areas impacted by COPR waste. The average total concentrations of As, Cr and Pb were 21.9 (2–135), 270 (65–3680) and 660 (147–1340) mgkg–1, respectively.
The measured oral bioaccessibility of As, Cr and Pb in the soils was, in general, much lower than the total concentration. The average percentage of the total concentration was 37.5, 7.6 and 52% for As, Cr and Pb, respectively; however, the % Cr bioaccessibility was significantly higher in the COPR-impacted soils. With the exception of the COPR-impacted soils, no consistent relationships between the bioaccessible As, Cr and Pb and land use per se are evident from this study; however, this is likely to be a reflection of the limited number of samples in the study.
Using the CISED extraction methodology, three distinct groupings of samples were identified. A comparison of the average total PHE concentrations in the three groups of samples shows the same trend for As and Cr Group1 < Group2 < Group3, whereas the total concentration of Pb was greatest for Group2 (>Group3>Group1).
Subsequent sample clustering and the associated data processing techniques identified a total of 16 geochemically distinct clusters acting as hosts of As, Cr and Pb in soils collected from Glasgow. Each of the clusters had varying degrees of environmental mobility. Nine of the clusters act as host for As, with 12 and ten clusters acting as hosts of Cr and Pb, respectively. In general, each PHE had some association with the Fe-, Mg-, P-, Al–Si- and P-dominated carbonate clusters.
The bioaccessibility of As in Glasgow soils is controlled by the dissolution of the more mobile clusters (1–5; easily extractable and Ca-dominated). When the data set is taken as a whole, Cr bioaccessibility is, dependent on the individual sample groupings, related to all of the clusters identified for the Glasgow soils. In the sample that was used as the basis for Group 3 (Sample 20 – the sample most impacted by COPR and with the highest total Cr content), bioaccessible Cr is controlled by the solubilisation of Cr principally associated with cluster 15 (Mg-dominated). Bioaccessible Pb is associated with a range of clusters, from easily extractable to moderately extractable mobile clusters (easily extractable, carbonates, clay and Mg-dominated).
This study highlights the variation of total and bioaccessible PHE concentration across Glasgow. In particular, the differences between land-use types, sampling location and contamination sources highlight the potentially hazardous nature of some soils in relation to their current and potential future land uses. However, land use does not appear to be a predictor of contamination, but is closely linked to understanding the historical disposal of COPR in Glasgow.
Using a combination of the UBM method to measure the bioaccessibility of PHE and CISED to identify the geochemical sources has allowed a much better understanding of the complexity of PHE mobility in the Glasgow urban environment. This approach can be applied to other urban environments and soil contamination scenarios.
4. Acknowledgements
We thank the University of Edinburgh, the British Geological Survey (BGS) and the Environmental Development and Educational Network for funding Andrew Broadway's PhD research studentship and costs. Lorna Eades and Megan Reid, University of Edinburgh, are thanked for fieldwork, laboratory and analytical assistance, as are the BGS staff and student volunteer workers who collected the G-BASE samples used in this study. This paper is published with the permission of the Executive Director of the BGS, Natural Environment Research Council (NERC). BGS/NERC reference: PRP18/065.
5. Supplementary material
Supplementary material is available online at https://doi.org/10.1017/S1755691018000762.