


1. Introduction
Conventional heavy mineral analysis is a commonly used and valuable tool for provenance analysis (Morton & Hallsworth, Reference Morton and Hallsworth1994; Mange & Wright, Reference Mange and Wright2007). Heavy mineral assemblages can often be linked to specific source areas, allowing reconstruction of the provenance of sediment. Many studies have shown, however, that the heavy mineral composition may also be strongly affected by other processes, such as hydraulic sorting, chemical weathering, sediment reworking and recycling (Morton & Hallsworth, Reference Morton and Hallsworth1999, Reference Morton, Hallsworth, Mange and Wright2007; Garzanti et al. Reference Garzanti, Andò and Vezzoli2008, Reference Garzanti, Andò and Vezzoli2009; Malusà et al. Reference Malusà, Resentini and Garzanti2016). In order to decipher sediment provenance, it is therefore often necessary to combine conventional heavy mineral analysis with other sediment characterization techniques, as the sedimentary processes differently affect the data obtained by different techniques. Single grain techniques have the advantage, compared to bulk techniques, in that they are affected to a lesser degree by variations in sorting or weathering, which are expected to occur among an assemblage of minerals with different shapes, densities and chemical stabilities (von Eynatten & Dunkl, Reference von Eynatten and Dunkl2012; Malusà & Garzanti, Reference Malusà, Garzanti, Malusà and Fitzgerald2019).
Zircon U–Pb geochronology is a commonly used technique that permits identification of different age populations in the zircon content of a certain sediment. These age populations can then be correlated to specific source areas in which zircon grains of the identified crystallization age are common. As zircon is an ultrastable mineral that is very resistant to chemical and physical weathering, it may survive through multiple sediment cycles, and as such may record a very long sedimentary history (e.g. Bahlburg et al. Reference Bahlburg, Vervoort, Du Frane, Bock, Augustsson and Reimann2009). Provenance studies based solely on detrital zircon U–Pb geochronology may suffer from problems such as (i) zircon fertility bias (e.g. Moecher & Samson, Reference Moecher and Samson2006; Malusà et al. Reference Malusà, Resentini and Garzanti2016), (ii) grain-size bias (e.g. Lawrence et al. Reference Lawrence, Cox, Mapes and Coleman2011; Augustsson et al. Reference Augustsson, Voigt, Bernhart, Kreißler, Gaupp, Gärtner, Hofmann and Linnemann2018) and (iii) missing information on orogenic formations or phases in the hinterland that did not reach the high temperatures necessary to reset or grow new zircons (e.g. Krippner & Bahlburg, Reference Krippner and Bahlburg2013; O’Sullivan et al. Reference O’Sullivan, Chew and Samson2016). Therefore, combinations of U–Pb geochronology with other sediment provenance techniques are much better suited for deciphering the complex web of interactions in sedimentary provenance analysis, which has to be taken into account (e.g. Tatzel et al. Reference Tatzel, Dunkl and Von Eynatten2017; Garzanti et al. Reference Garzanti, Dinis, Vermeesch, Andò, Hahn, Huvi, Limonta, Padoan, Resentini, Rittner and Vezzoli2018).
The goal of this paper is to shed new light on the provenance of Neogene sediment in the southern North Sea Basin and Ruhr Valley Graben by combining conventional heavy mineral analysis and zircon U–Pb geochronology. Previous provenance models for this area based solely on heavy mineral composition mainly involved simple mixing between a distinct northern, Fennoscandian, and southern, Rhenish Massif, source. These sources are characterized by a varying content of garnet, epidote and amphibole relative to ultrastable minerals, staurolite and Al2SiO5 polymorphs (Edelman & Doeglas, Reference Edelman and Doeglas1933; Tavernier, Reference Tavernier1943; Van Andel, Reference Van Andel1950; Burger, Reference Burger1987; Gullentops & Huyghebaert, Reference Gullentops and Huyghebaert1999; Verhaegen et al. Reference Verhaegen, Weltje and Munsterman2019). Throughout the Neogene, however, there is evidence of reworking and recycling. We refer to reworking as the process of erosion, transfer and deposition of older sediment within a sedimentary basin (as defined in Kearey, Reference Kearey2001). Recycling is used when a sedimentary parent rock is eroded in the hinterland and the resulting sediment is transported to and deposited in a sedimentary basin (e.g. Mongelli et al. Reference Mongelli, Critelli, Perri, Sonnino and Perrone2006; Guo et al. Reference Guo, Yang, Li, Bi and Zhao2017; Johnson et al. Reference Johnson, Kirkland, Evans, McDonald and Cutten2018). Reworked phosphate pebbles and shark teeth from the Oligocene can be found in lower Miocene sediment and a large amount of early Miocene glauconite is present in the upper Miocene sedimentary units (De Meuter & Laga, Reference De Meuter and Laga1976; Vandenberghe et al. Reference Vandenberghe, Laga, Steurbaut, Hardenbol, Vail, de Graciansky, Hardenbol, Jacquin and Vail1998, Reference Vandenberghe, Harris, Wampler, Houthuys, Louwye, Adriaens, Vos, Lanckacker, Matthijs, Deckers, Verhaegen, Laga, Westerhoff and Munsterman2014b ; Adriaens, Reference Adriaens2015). Reworking and recycling has not yet been properly accounted for in previous provenance models. Based on the discrepancies in zircon U–Pb age distribution between the possible source areas, zircon U–Pb analyses should be able to shed more light on the mixing between detritus derived from the assumed northern and southern source areas in the southern North Sea Basin during Neogene time. Because the southern source area is mainly composed of metasedimentary rocks, it contains older Proterozoic to Archaean ages similar to the northern crystalline source area, but the age distributions are significantly different (Schärer et al. Reference Schärer, Berndt, Scherer, Kooijman, Deutsch and Klostermann2012; Olivarius et al. Reference Olivarius, Rasmussen, Siersma, Knudsen, Kokfelt and Keulen2014; Tatzel et al. Reference Tatzel, Dunkl and Von Eynatten2017). This study provides new insight into the importance of weathering and sediment reworking and recycling at open marine shelf margins, which can be recorded by combining these two sediment characterization techniques.
2. Geological setting
2.a. Geological background of the study area
The study area is located at the southern edge of the North Sea Basin. The western and central part of the area is formed by the subsiding southern North Sea Basin, geographically roughly equivalent to the Palaeozoic Campine Basin, on the northern edge of the London–Brabant Massif (Fig. 1). In the southern North Sea Basin, multiple sedimentary sequences have been recognized throughout the Cenozoic, which point to movement of the shoreline from north to south and vice versa, leading to the deposition of both marine and continental units, and also to some significant hiatuses (Vandenberghe et al. Reference Vandenberghe, Van Simaeys, Steurbaut, Jagt and Felder2004). In the east, the Ruhr Valley Graben is present. It is a fault-bounded structure in which major subsidence occurred from Oligocene time onwards. The Ruhr Valley Graben is located at the northwestern end of the Rhine Graben, which forms part of the large Northwest European Rift System that extends to the Alpine foreland (Fig. 1; Ziegler, Reference Ziegler1992; Verbeek et al. Reference Verbeek, De Leeuw, Parker and Wong2002; Sissingh, Reference Sissingh2003).

Fig. 1. (a) Regional geological setting of the North Sea Basin during Miocene time with the large Eridanos river system in the northeast. Modified from Doornenbal & Stevenson (Reference Doornenbal and Stevenson2010). The Ruhr Valley Graben is part of the Rhine rift system in the south. Bl – Blija; LBM – London–Brabant Massif; LRE – Lower Rhine Embayment; RVG – Ruhr Valley Graben; URG – Upper Rhine Graben. (b) Detailed view of the study area. Modified from Verhaegen et al. (Reference Verhaegen, Weltje and Munsterman2019). The purple lines indicate the southern limit of the Miocene units. A – Antwerp; B – Brussels; Br – Breda; D – Dessel; G – Goirle; Ga – Garzweiler; Ge – Gellik; M – Maaseik; Ma – Maastricht; W –Wijshagen.
The Miocene to Pliocene deposits in the study area consist mainly of fine glauconite-bearing marine sand, though coarse continental quartz sand occurs as well (Fig. 2). In the Belgian part of the study area, these include (1) the lower–middle Miocene marine Berchem Formation and the marine to continental Bolderberg Formation, (2) the Tortonian marine Diest Formation, (3) the Messinian near-shore marine Kasterlee Formation and (4) the Pliocene continental Mol Formation (Fig. 2; Laga et al. Reference Laga, Louwye and Geets2001). For the Netherlands and the Ruhr Valley Graben in easternmost Belgium, they include (1) the Chattian to lower Miocene marine Veldhoven Formation, (2) the lower–middle Miocene marine Groote Heide Formation, (3) the upper Miocene marine Diessen Formation, (4) the Tortonian Inden Formation, (5) the Pliocene near-shore Oosterhout Formation and (6) the upper Miocene to Pliocene continental Kieseloolite Formation (Fig. 2; Van Adrichem Boogaert & Kouwe, Reference Van Adrichem Boogeart and Kouwe1997). The Dutch Breda Formation was recently re-defined by Munsterman et al. (Reference Munsterman, Ten Veen, Menkovic, Deckers, Witmans, Verhaegen, Kerstholt-Boegehold, Van De Ven and Busschers2019) and split into the lower Miocene Groote Heide Formation and upper Miocene Diessen Formation.
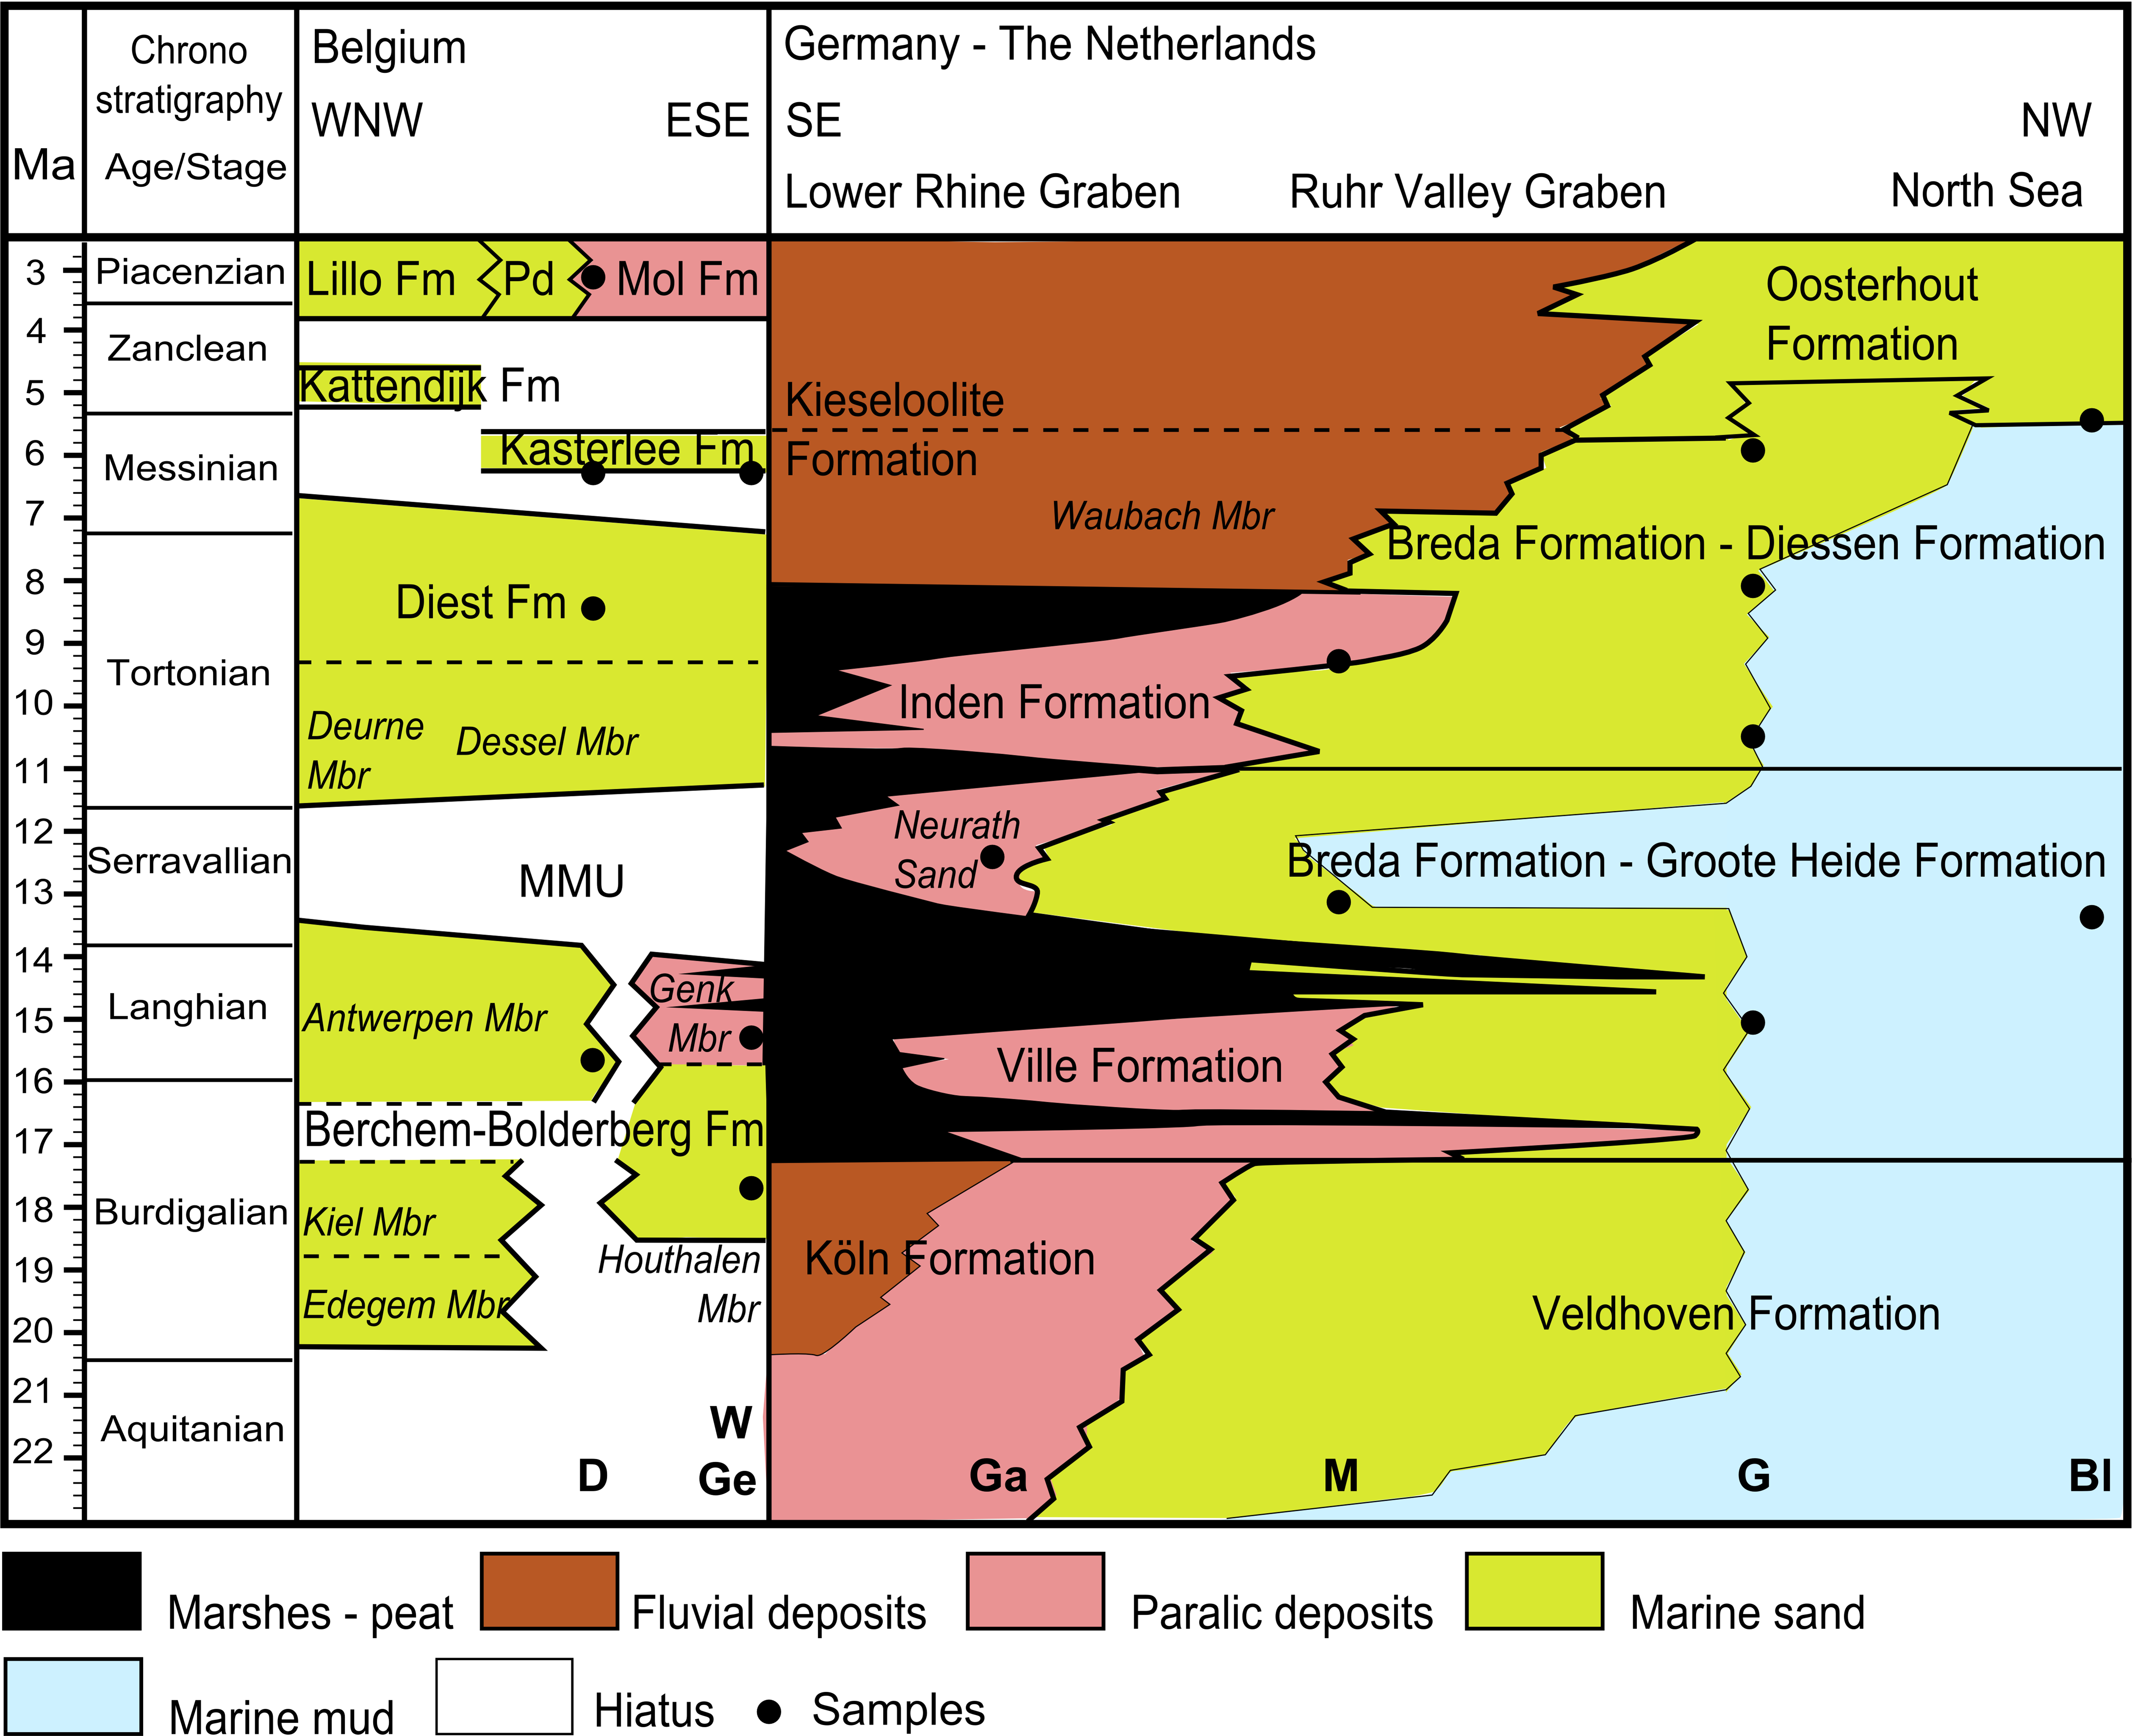
Fig. 2. Stratigraphic correlation of Neogene units in Belgium, Germany and the Netherlands (modified from Verhaegen et al. Reference Verhaegen, Weltje and Munsterman2019). The WNW–ESE section in Belgium runs approximately from Antwerp in the NW to the Limburg Campine – Ruhr Valley Graben (RVG) boundary in the SE. The section for Germany and the Netherlands is a SE–NW section through the Lower Rhine Embayment and RVG. Compiled based on Van Adrichem Boogaert & Kouwe (Reference Van Adrichem Boogeart and Kouwe1997), Doornenbal & Stevenson (Reference Doornenbal and Stevenson2010), Adriaens (Reference Adriaens2015) and Munsterman et al. (Reference Munsterman, Ten Veen, Menkovic, Deckers, Witmans, Verhaegen, Kerstholt-Boegehold, Van De Ven and Busschers2019). The Breda Formation is now renamed to the Groote Heide and Diessen formations (Munsterman et al. Reference Munsterman, Ten Veen, Menkovic, Deckers, Witmans, Verhaegen, Kerstholt-Boegehold, Van De Ven and Busschers2019). MMU – Mid-Miocene Unconformity; Pd – Poederlee Formation. Sampling locations are indicated along the transect: Bl – Blija; D – Dessel; G – Goirle; Ga – Garzweiler; Ge – Gellik; M – Maaseik; W – Wijshagen.
Sediment containing a large amount of reworked glauconite, such as the Diest Formation, can be interpreted as largely reworked, whereas sediment with fresh authigenic glauconite, such as the Antwerpen Member of the Berchem Formation, may represent new input from the north and an overall low sedimentation rate, which allowed for the formation of authigenic glauconite (Vandenberghe et al. Reference Vandenberghe, Harris, Wampler, Houthuys, Louwye, Adriaens, Vos, Lanckacker, Matthijs, Deckers, Verhaegen, Laga, Westerhoff and Munsterman2014b ). The lower Miocene Berchem Formation can be interpreted as a sediment-starved unit relative to the Tortonian Diest Formation, when the sediment accumulation rate strongly increased (Deckers & Louwye, Reference Deckers and Louwye2019). Reworking is very likely for the bulk of the Tortonian Diest Formation for which all glauconite, which makes up c. 35 % of the sediment, is reworked from lower Miocene units (Vandenberghe et al. Reference Vandenberghe, Harris, Wampler, Houthuys, Louwye, Adriaens, Vos, Lanckacker, Matthijs, Deckers, Verhaegen, Laga, Westerhoff and Munsterman2014b ).
2.b. Provenance based on heavy mineral composition
Many heavy mineral studies have been carried out in the study area, and they provide a good understanding of the varying heavy mineral assemblages and their provenance (Edelman & Doeglas, Reference Edelman and Doeglas1933; Tavernier, Reference Tavernier1943; Van Andel, Reference Van Andel1950; Burger, Reference Burger1987; Geets & De Breuck, Reference Geets and De Breuck1991; Gullentops & Huyghebaert, Reference Gullentops and Huyghebaert1999; Verhaegen, Reference Verhaegen2020). Already, Edelman & Doeglas (Reference Edelman and Doeglas1933) identified a northwestern province, consisting mainly of marine sediment, and a southeastern province, consisting mainly of continental sediment, with a mixing zone in between. The northern province is characterized by a relatively high content of epidote, amphiboles and garnet, whereas the parametamorphic minerals (staurolite and Al2SiO5 polymorphs), as well as the ultrastable minerals zircon, tourmaline and rutile are particularly common in deposits of the southern province (Edelman & Doeglas, Reference Edelman and Doeglas1933). The southern ultrastable mineral-rich and garnet-poor associations appear to have been more strongly affected by chemical weathering compared to the northern association (Verhaegen et al. Reference Verhaegen, Weltje and Munsterman2019). The composition of the different heavy mineral assemblages can be summarized by a log-ratio of epidote, amphiboles and garnet (= northern minerals) versus parametamorphic minerals and ultrastable minerals (= southern minerals), which is in fact the statistical equivalent of the classic north–south provenance model (Verhaegen et al. Reference Verhaegen, Weltje and Munsterman2019; Verhaegen, Reference Verhaegen2020). In general, the southern heavy mineral assemblage becomes more prominent from the northwest to the southeast and from the lower Miocene to the Pliocene. This is explained by the northward progradation of the Rhine delta in the Ruhr Valley Graben during late Miocene and Pliocene time, delivering sediment with a southern signal to the Ruhr Valley Graben and the Campine area. Recycled Palaeogene sediment covering the Brabant Massif to the south and southwest of the study area (Flemish Hills) may also be an important source of sediment to the upper Miocene and Pliocene, as the heavy mineral signature is similar (Verhaegen et al. Reference Verhaegen, Weltje and Munsterman2019). Important erosion of those Palaeogene sedimentary deposits likely occurred prior to and during Neogene time (Vandenberghe et al. Reference Vandenberghe, De Craen and Wouters2014 a), also indirectly delivering sediment sourced more to the south related to the uplift of the Weald–Artois high (De Coninck, Reference De Coninck1990; De Man et al. Reference De Man, Van Simaeys, Vandenberghe, Harris and Wampler2010; Van Vliet-Lanoë et al. Reference Van Vliet-Lanoë, Gosselin, Mansy, Bourdillon, Meurisse-Fort, Henriet, Le Roy and Trentesaux2010). The parametamorphic minerals staurolite, kyanite and andalusite of the southern heavy mineral assemblage may in fact be indirectly sourced from the Massif Central and Armorican Massif in France, through the intermediary of the Paris Basin and the Eocene deposits in northern France and Belgium (Parfenoff et al. Reference Parfenoff, Pomerol and Tourenq1970). The minerals of the northern assemblage, garnet, epidote and amphiboles, are typical for a collision orogen or orogenic root provenance and are generally linked to the Fennoscandian massif (Edelman & Doeglas, Reference Edelman and Doeglas1933; Garzanti & Andò, Reference Garzanti, Andò, Mange and Wright2007). The heavy mineral assemblage of the Danish Miocene, which received sediment from the Fennoscandian massif, is very similar to the northern heavy mineral assemblage (Olivarius et al. Reference Olivarius, Rasmussen, Siersma, Knudsen and Pedersen2011, Reference Olivarius, Rasmussen, Siersma, Knudsen, Kokfelt and Keulen2014). The same is the case for the Miocene sediment on the isle of Sylt, off the Danish–German coast (Edelman & Doeglas, Reference Edelman and Doeglas1933).
2.c. Regional zircon U–Pb ages
Two main sources of sediment fed the Campine area and the Ruhr Valley Graben with zircon during Miocene time. In the south, the Brabant Massif (orogeny at ∼450–400 Ma) and the Variscan (orogeny at ∼380–280 Ma) Ardennes–Rhenish Massif and other central European Variscan massifs and their sedimentary cover fed the basin through local rivers and the Lower Rhine Embayment and Ruhr Valley Graben. Miocene sediment of the southern source area should be characterized by a significant number of Phanerozoic ages that represent the Brabantian and Variscan orogenies and Cenozoic magmatism related to the Rhine Graben, as the southern source area mainly consists of Palaeozoic metasedimentary rocks and younger igneous rocks. The southern source also provided much Neoproterozoic zircon related to the Cadomian and Pan-African orogenies (orogenies at ∼650–500 Ma) (Von Hoegen et al. Reference Von Hoegen, Kramm and Walter1990; Kaufmann et al. Reference Kaufmann, Trapp, Mezger and Weddige2005; Linnemann et al. Reference Linnemann, Herbosch, Liégeois, Pin, Gärtner and Hofmann2012; Schärer et al. Reference Schärer, Berndt, Scherer, Kooijman, Deutsch and Klostermann2012; Tatzel et al. Reference Tatzel, Dunkl and Von Eynatten2017). The Fennoscandian Basement in the north, drained by the Baltic river system or Eridanos river, was the major sediment source to the North Sea during Neogene time (Overeem et al. Reference Overeem, Weltje, Bishop-Kay and Kroonenberg2001). The Fennoscandian Basement is characterized by Archaean to Proterozoic crystalline parent rocks with zircon ages that largely reflect the formation or high-temperature metamorphic zircon growth of those rocks. Miocene sediment from the northern source area is expected to have a large amount of Palaeo- and Mesoproterozoic zircon ages and only a limited fraction of Phanerozoic and almost no Cenozoic ages (Slagstad et al. Reference Slagstad, Davidsen and Daly2011; Olivarius et al. Reference Olivarius, Rasmussen, Siersma, Knudsen, Kokfelt and Keulen2014).
3. Materials and methods
3.a. Samples
Zircon U–Pb geochronology was applied to 16 samples, of which for 14 samples, the heavy mineral composition was also analysed (Table 1; Figs 1, 2). The north of the study area is represented by four samples from the Goirle core in the northern Antwerp Campine ranging in age from middle to late Miocene. The centre of the study area is represented by four samples from the Dessel cores in the eastern Antwerp Campine of middle Miocene to Pliocene age. The southeast of the study area is represented by two samples from the Maaseik core in the Ruhr Valley Graben of middle Miocene and Tortonian age, two lower to middle Miocene samples from Gellik and Wijshagen, and one upper Miocene sample from Wijshagen in the Limburg Campine. The Tortonian age of sample 4 of the Maaseik core and its correlation with the Inden Formation was recently confirmed by a heavy mineral correlation of surrounding units and dinoflagellate cyst biostratigraphy (Louwye & Vandenberghe, Reference Louwye and Vandenberghe2020; Verhaegen, Reference Verhaegen2020). Sample 6 from the Garzweiler quarry in the Lower Rhine Graben was collected as a potential southern end-member. Samples 15 and 16 from the Blija core in the north of the Netherlands are potential northern end-members for the upper Miocene to Pliocene and middle Miocene sediment, respectively.
Table 1. Samples analysed for the current study

For the Belgian cores the DOV-code is given (https://www.dov.vlaanderen.be). (1) Garzweiler lignite quarry; (2) Goirle core of TNO Utrecht; Dutch code 50H0373; (3) Blija core TNO Utrecht. LC – Limburg Campine; RVG – Ruhr Valley Graben; LRE – Lower Rhine Embayment; AC – Antwerp Campine; nAC – northern Antwerp Campine; nN – northern Netherlands. Sample locations are indicated on Figures 1 and 2. * The heavy mineral data for these samples were published in Verhaegen (Reference Verhaegen2020), together with many other samples from the Belgian Neogene.
3.b. Heavy mineral analysis
About 100 g of sediment was pretreated following the protocol of Mange & Maurer (Reference Mange and Maurer1992). Heavy mineral analysis was performed on the 63–500 µm fraction, and therefore the samples were first wet sieved at 63 µm. There was no significant fraction >500 µm in the studied samples. Both the 63–500 µm and <63 µm fractions were retrieved and weighed. Afterwards, samples were treated with 10 % (1.2 N) HCl to remove carbonate and iron coatings. The samples were left in boiling HCl for 5 to 10 minutes to limit the acid corrosion of the heavy mineral grains. Apatite is strongly affected during this process, also applied in earlier studies (Edelman & Doeglas, Reference Edelman and Doeglas1933; Geets & De Breuck, Reference Geets and De Breuck1991), so the low content of apatite does not reflect sediment provenance. The separation of the heavy minerals and the mounting of the grains were carried out at the mineral separation laboratory of the Vrije Universiteit Amsterdam. Heavy minerals were separated from the bulk sediment using a liquid mixture of diiodomethane and dichlorobenzene with a density of 2.89 g cm−3. The heavy mineral grains were separated in a beaker in the centre of a centrifuge, whereby the light mineral fraction exits the beaker through overflow during rotation. Both the weight of the complete 63–500 µm fraction prior to heavy mineral separation and of the heavy mineral separates were measured in order to calculate the total heavy mineral content of the samples. Subsequently, the heavy mineral grains were mounted on glass plates for optical microscopy using Canada balsam, which has a refractive index of 1.52. Conventional heavy mineral analysis was performed with an Olympus polarizing microscope using Mange & Maurer (Reference Mange and Maurer1992) as a guideline for mineral identification. Two hundred transparent heavy minerals were counted per slide using the ribbon counting method. Opaque heavy minerals were counted as one group.
3.c. Zircon U–Pb geochronology
Heavy mineral separates prepared for classic heavy mineral analysis described in the previous section were used for zircon U–Pb dating of 16 samples. Further preparation and analysis was carried out at the department of Sedimentology and Environmental Geology of the University of Göttingen, Germany. The concentration of zircon in these separates was increased by using the 63–125 µm sieve fraction, which includes the large majority of zircon grains, as inferred from heavy mineral counts (exception: sample 1 with near-equal amounts of zircon grains in the 125–500 µm and 63–125 µm fractions). Next, a magnetic separation was done using a Franz Isodynamic Separator with increasing electrical current up to 1.7 A and a side angle of 10°, resulting in an increased concentration of zircon in the low-susceptibility ‘non-magnetic’ fraction. Zircon crystals were fixed on double-sided adhesive tape stuck on a thick glass plate and embedded in 25 mm diameter epoxy mounts. The crystal mounts were lapped by 2500 mesh SiC paper and polished by 9, 3 and 1 µm diamond suspensions. For all zircon samples and standards used in this study, cathodoluminescence (CL) images were obtained using a JEOL JXA 8900 electron microprobe at the Geozentrum Göttingen in order to study their internal structure and to select homogeneous parts for the in situ age determinations. Randomly selected zircon grains were analysed, and no pre-selection was done based on mineral habit or colour. The carbon coating used for CL imaging was later removed with a brief hand polish on a 1 µm diamond cloth. The in situ U–Pb dating was performed with laser ablation single-collector sector-field inductively coupled plasma mass spectrometry (LA-SF-ICP-MS). The method employed for analysis is described by Frei & Gerdes (Reference Frei and Gerdes2009). A Thermo Finnigan Element 2 mass spectrometer coupled to a Resonetics Excimer laser ablation system was used. For each sample, between 96 and 117 spots were analysed. The applied spot diameter was 33 µm, and the spots were positioned in the ‘mantle’ of the crystals (cf. Harangi et al. Reference Harangi, Lukács, Schmitt, Dunkl, Molnár, Kiss, Seghedi, Novothny and Molnár2015), or potentially in the outermost rims in order to date the latest phase of crystal growth. The laser was fired at a repetition rate of 5 Hz and at nominal laser energy output of 25 %. Two laser pulses were used for pre-ablation. The carrier gas was He and Ar. Analytes of 238U, 235U, 232Th, 208Pb, 207Pb, 206Pb, mass-204 and 202Hg were measured by the ICP-MS. The data reduction is based on the processing of c. 50 selected time slices (corresponding to c. 14 seconds) starting c. 3 seconds after the beginning of the signal. If the ablation hit zones or inclusions with highly variable actinide concentrations or isotope ratios, then the integration interval was slightly resized or the analysis was discarded (∼1 % of the spots). The individual time slices were tested for possible outliers by an iterative Grubbs test (applied at P = 5 % level; Grubbs, Reference Grubbs1969). This test filtered out only the extremely biased time slices, which usually resulted in less than 2 % of the time slices being rejected. The age calculation and quality control are based on the drift- and fractionation correction by standard-sample bracketing using GJ-1 zircon reference material (Jackson et al. Reference Jackson, Pearson, Griffin and Belousova2004). For further control, the Plešovice zircon (Sláma et al. Reference Sláma, Košler, Condon, Crowley, Gerdes, Hanchar, Horstwood, Morris, Nasdala, Norberg, Schaltegger, Schoene, Tubrett and Whitehouse2008), the 91500 zircon (Wiedenbeck et al. Reference Wiedenbeck, Allé, Corfu, Griffin, Meier, Oberli, Von Quadt, Roddick and Spiegel1995) and the FC-1 zircon (Paces & Miller, Reference Paces and Miller1993) were analysed as ‘secondary standards’. The age results of the standards were consistently within 2 sigma of the published ID-TIMS values. Drift- and fractionation corrections and data reductions were performed by in-house software of the University of Göttingen (UranOS; Dunkl et al. Reference Dunkl, Mikes, Simon, Von Eynatten and Sylvester2008). If the 206Pb–238U age was younger than 1.5 Ga then this age was considered; however, when the 206Pb–238U age was older than 1.5 Ga, the 207Pb–206Pb age was used. Concordia plots and age spectra were constructed with the help of Isoplot/Ex 3.0 (Ludwig, Reference Ludwig2012) and AgeDisplay (Sircombe, Reference Sircombe2004). The data were tested for concordance, based on a comparison of the 206Pb–238U, 207Pb–206Pb and 207Pb–235U ages, and non-concordant ages were discarded, using a concordance level of 10 %. The number of concordant ages for each sample lies in between 82 and 98.
3.d. Statistical methods
Zircon U–Pb age spectra in the current paper are visualized as cumulative distributions and as kernel density estimation (KDE) plots, which can be used for the first visual analysis of the main (dis)similarities between samples and for the recognition of the main age components (Malusà et al. Reference Malusà, Carter, Limoncelli, Villa and Garzanti2013). Cumulative curves provide an objective representation of the raw data, whereas KDE plots are the result of a statistical manipulation of the data, yet the identification of age components is easier on KDE plots. KDE plots are statistically more robust than the traditionally used probability density plots, and the resulting curves are a closer estimation of the probability density function (Vermeesch, Reference Vermeesch2012). An analysis of the differing significance of the age components between the different samples under study was a second step in the objective comparison of the samples. The mixing modelling option in the DensityPlotter software by Vermeesch (Reference Vermeesch2012) was used for statistical identification of the main age components in the dataset and their relative weights.
Multi-dimensional scaling (MDS) analysis of the data in the current study was performed using the R package ‘provenance’ by Vermeesch et al. (Reference Vermeesch, Resentini and Garzanti2016). This is a statistical method similar to principal component analysis that can be applied to any type of data (Young & Hamer, Reference Young and Hamer1987; Cox & Cox, Reference Cox and Cox2001; Vermeesch, Reference Vermeesch2013). For non-metric MDS, the quality of the MDS model was tested by plotting a Shepard plot, on which the calculated distances are plotted against the dissimilarities. If the fit is good, there should be a linear or stepwise linear relationship between both. The amount of scatter is captured by the Stress value (S) in non-metric MDS. An S-value >0.2 indicates a poor model, whereas an excellent model has an S-value <0.025 (Vermeesch, Reference Vermeesch2013).
4. Results
4.a. Heavy mineral data
Raw heavy mineral data are available in online Supplementary Material Table S1. Most northern Campine and most lower to middle Miocene sand has a large proportion of garnet, epidote and amphibole, whereas southern and upper Miocene to Pliocene sand has a large proportion of ultrastable (zircon, tourmaline, Ti-group minerals with a dominance of rutile) and parametamorphic minerals (staurolite and Al2SiO5-polymorphs) (Fig. 3). A clear stratigraphic trend is visible only at Dessel in the central Campine area where a strong increase in ultrastable and parametamorphic minerals relative to garnet, epidote and amphibole can be observed from the lower Miocene to the Pliocene (Fig. 3). The southern end-member sample of Garzweiler has a similar dominance of ultrastable and parametamorphic heavy minerals to the other samples of the southeastern Campine and the upper Miocene to Pliocene samples of Dessel, mainly owing to a large zircon and staurolite content (Fig. 3).

Fig. 3. For each region, cumulative plots of zircon U–Pb ages and heavy mineral data as cumulative bar charts and log-ratio (LR) plots are given (LR = Log((Ep + Amph + Grt)/(Tur + Zrn +Ti + R + Ky + And + Sil)). * The LR value of sample 1 is −2, which falls to the left of the plot area. Heavy minerals: Tur –tourmaline; Zrn – zircon; Ti – Ti-group minerals (mainly rutile); R – rest group; Ky – kyanite; And – andalusite; Sil – sillimanite; St – staurolite; Grt – garnet; Ep – epidote; Amph – amphibole. Locations: Ga – Garzweiler; Ge – Gellik; M – Maaseik; W – Wijshagen. Ages: MM – lower to middle Miocene; Tor – Tortonian; Mes – Messinian; Pl – Pliocene.
4.b. Zircon U–Pb ages
Raw zircon U–Pb age data are available in online Supplementary Material Table S2. In contrast to the heavy mineral contents, only subtle differences in the absolute age and size of the different age populations are present between most of the samples (Fig. 3). Only samples 4 and 6 (Ruhr Valley Graben and Lower Rhine Embayment) are clearly different from the other ones. For all samples, three of the main age components are Palaeozoic. These are a Variscan (306 ± 21 Ma, N = 14; with N equal to the number of samples in which this component occurs), Brabantian (426 ± 17 Ma, N = 15) and Cadomian (586 ± 40 Ma, N = 14) component. The largest age component in most samples is Sveconorwegian (1014 ± 18 Ma, N = 16). Also Mesoproterozoic (1369 ± 43 Ma, N = 15), Palaeoproterozoic (1771 ± 30 Ma, N = 14) and Archaean (2775 ± 77 Ma, N = 16) age components are present (Figs 4, 5). The lower Miocene northern end-member sample (16) is the only sample in which the Palaeoproterozoic age component is the most prominent, instead of the Sveconorwegian component. The Pliocene northern end-member sample (15) also has very well-pronounced Meso- and Palaeoproterozoic ages components.

Fig. 4. Kernel density estimations (KDEs) of the zircon U–Pb age distribution for each sample measured. The dashed vertical lines indicate the most prominent age components mentioned in the text (Variscan ∼306 Ma; Brabantian ∼426 Ma; Cadomian ∼586 Ma; Sveconorwegian ∼1014 Ma; Mesoproterozoic ∼1369 Ma; Palaeoproterozoic ∼1771 Ma; and Archaean ∼2775 Ma). Abbreviations as in Figure 3.

Fig. 5. Component analysis of the zircon U–Pb ages. The position of a circle indicates the modal age of that age component and the diameter of the circle indicates the weight of that age component in that sample. Abbreviations as in Figure 3.
In the northern Goirle core, the middle Miocene sample (14) has only very small Palaeozoic age components and a pronounced Sveconorwegian component. The Tortonian and Messinian samples of the Goirle core (11, 12, 13) have very well-pronounced Meso- and Palaeoproterozoic age components, very similar to the Pliocene northern end-member sample, yet the Sveconorwegian component is the most prominent (Figs 4, 5). In the Messinian sample (11) the Palaeozoic components become significant as well. Sample 12 of the Tortonian also has a small Cenozoic component (at 55 Ma; Fig. 5).
In the central Dessel core, the sizes of the Palaeozoic age components increase from the middle Miocene up to the Pliocene (Fig. 4). The middle Miocene sample (10) is mainly characterized by a pronounced Sveconorwegian age component, similar to the middle Miocene sample of the Goirle core. In the Tortonian (9) and Messinian (8) samples, the Meso- to Palaeoproterozoic age components are well represented. For the Messinian (8) and Pliocene (7) samples, the Palaeozoic age components consist of a higher proportion of older Palaeozoic (Brabantian and Cadomian) ages, compared to the middle Miocene and Tortonian samples.
In the Ruhr Valley Graben, in the southern Maaseik core, the middle Miocene sample (5) is similar to the middle Miocene samples of the Dessel core and Goirle core, with rather small Palaeozoic age components, though larger than in the Campine area, a very well-defined Sveconorwegian component and smaller Meso- and Palaeoproterozoic age components. The middle Miocene sample of Gellik (3) and Messinian sample of Wijshagen (1), in the south, are dominated by Sveconorwegian and Meso- to Palaeoproterozoic ages. The lower Miocene sample of Wijshagen (2) has larger Palaeozoic age components with more older Palaeozoic ages, similar to the Messinian and Pliocene samples of the Dessel core, though the Sveconorwegian age component is dominant similar to other middle Miocene samples. This sample also has a small Mesozoic component (at 115 Ma; Fig. 5). The Tortonian sample of the Ruhr Valley Graben (4) and the southern end-member sample of the Lower Rhine Embayment (6) are dominated by Palaeozoic ages, which is why they are most clearly distinguishable from all other samples based on zircon ages (Figs 3, 4, 5). The southern end-member sample also has a small Cenozoic component (at 19 Ma; Fig. 5).
The classic MDS analysis of all ages shows, as expected, that only the southern end-member sample (6) and the Tortonian sample of Maaseik (4) have an age distribution that is significantly different from all other samples (Fig. 6a). Within the large group of other samples, there appears to be a grouping of the Tortonian samples (9, 12, 13), Messinian to Pliocene samples (7, 8, 11, 15) and to a lesser degree lower to middle Miocene samples (5, 10, 14) (Fig. 6a).

Fig. 6. Multi-dimensional scaling (MDS) maps of the zircon U–Pb ages for (a) all ages, using classic MDS, (b) ages <800 Ma, using non-metric MDS, S-value = 0.111 and (c) ages >800 Ma, using non-metric MDS, S-value = 0.107.
Since the largest variation between the samples appears to be present in the proportional contributions of the younger Cadomian to Variscan ages and the Sveconorwegian and older ages, subtle contrasts within these two groups might be masked. Therefore, the age distributions are split into two parts (<800 Ma and >800 Ma) for the application of MDS and analysed separately.
Based on the <800 Ma ages (Fig. 6b), the Messinian to Pliocene samples of Goirle in the north and Dessel in the centre (7, 8, 11) are closely related. Close to these three samples are also the Pliocene northern end-member sample (15) and the sample of the Tortonian in the Ruhr Valley Graben in the south (4). One of the Tortonian samples of the Goirle core (12) and the southern end-member sample of the Lower Rhine Embayment (6) plot next to this group. The other samples are spread out across the rest of the plot.
Based on the >800 Ma ages (Fig. 6c), the lower to middle Miocene samples of Goirle in the north (14), Dessel in the centre (10), and Maaseik and Wijshagen in the south (5, 2) plot close to each other. Also close to these samples are the Messinian to Pliocene samples of Goirle (11) and Dessel (7) and the Tortonian sample of Maaseik (4). A second closely related group, clearly separated from the first group, contains the Tortonian samples of the Goirle core in the north (12, 13) and Dessel core in the centre (9), with the Pliocene northern end-member sample (15) and the southern end-member sample (6) nearby.
5. Discussion
Based on the varying heavy mineral composition, consistent with the legacy data analysed by Verhaegen et al. (Reference Verhaegen, Weltje and Munsterman2019) and the new data collected by Verhaegen (Reference Verhaegen2020), two distinct sediment sources can be assumed. The northern signature, characterized by epidote, amphiboles and garnet, is dominant in lower to middle Miocene sediment and remains dominant until the Pliocene in the northwestern Campine area. The southern source, characterized by ultrastable and parametamorphic minerals, only becomes significant in the central Campine area from the Tortonian onwards (Fig. 3). In contrast, the strong similarity of zircon U–Pb ages of 14 out of the 16 samples is an indication that there was no drastic shift in the supply of zircon grains to the study area throughout Miocene time (Figs 3, 6). The overall age distribution is similar to that of Danish Miocene sediment, which represents the northern source area (Olivarius et al. Reference Olivarius, Rasmussen, Siersma, Knudsen, Kokfelt and Keulen2014), but the <800 Ma age components in the current study are larger than in the Danish Miocene sediment, and the dominant Sveconorwegian component (1 Ga) is also larger. In the Danish Miocene sediment, instead Meso- and Palaeoproterozoic age components are the most prominent (Olivarius et al. Reference Olivarius, Rasmussen, Siersma, Knudsen, Kokfelt and Keulen2014). Based on these differences, it is unlikely that Miocene sediment was transported unchanged from the Danish North Sea towards the south. The Pliocene of Blija in the north does have a similar age distribution to the Neogene sediment of the Campine area, with a prominent Sveconorwegian component. The zircon U–Pb age distributions of sediment in the Campine area are very similar to the age distributions observed in the current Elbe estuary (von Eynatten et al. Reference von Eynatten, Führing, Aschoff, Seest and Dunkl2018). The difference in age distribution between the Danish Miocene and the Miocene of the Campine area may therefore be explained by mixing to the southwest of Denmark, with sediment provided by tributaries of the Eridanos draining continental Europe and the Baltic Massif, such as the river Elbe.
Even though the general age distribution is similar, there are subtle changes in zircon U–Pb age distribution from the lower Miocene to Tortonian to Messinian and Pliocene (Fig. 6). The lower Miocene sediment, which has a northern heavy mineral signature, is characterized by a dominance of the Sveconorwegian age component. Towards the southeast, the contribution of the Palaeozoic age components does become larger. In the Tortonian, with a more mixed heavy mineral signature, the Meso- and Palaeoproterozoic age components becomes more prominent as well, which may be linked to a change within the northern provenance (Fig. 4). A large amount of Meso- and Palaeoproterozoic ages is also seen in the Blija northern end-member samples and even more prominent in the Danish Miocene sediment. Such changes may be caused by varying contributions of the tributaries of the prograding Eridanos delta, which was active from the Tortonian onwards, on top of the Mid-Miocene Unconformity (Overeem et al. Reference Overeem, Weltje, Bishop-Kay and Kroonenberg2001). A shift towards more young, Palaeozoic, ages in the Messinian to Pliocene sediment, with a southern heavy mineral signature, may indicate an increased proportion of zircon derived from the southern provenance (Figs 3, 4).
Only the studied sediment of the Lower Rhine Embayment and the Tortonian of the Ruhr Valley Graben, containing a transition unit (unit X, Table 1 no. 4) between the marine Breda Formation and continental Inden Formation, displays a significantly different zircon age distribution, which can be linked confidently with input from the palaeo-Rhine river system, characterized by a dominance of young (<800 Ma) ages (Figs 3, 4). This zircon U–Pb age signature coincides well with what can be expected from the southern source area, with a higher proportion of Palaeozoic ages (Schärer et al. Reference Schärer, Berndt, Scherer, Kooijman, Deutsch and Klostermann2012; Tatzel et al. Reference Tatzel, Dunkl and Von Eynatten2017).
A likely explanation for the clear variation in heavy minerals but largely constant zircon U–Pb signature throughout the Neogene and across the study area is the significant amount of reworking and recycling that occurred during the Neogene, as also indicated by the large portion of reworked glauconite (Vandenberghe et al. Reference Vandenberghe, Harris, Wampler, Houthuys, Louwye, Adriaens, Vos, Lanckacker, Matthijs, Deckers, Verhaegen, Laga, Westerhoff and Munsterman2014 b). In this case, zircon grains with a northern age signature were reworked in the Campine area, whereas grains with a southern age signature already occurred in the Lower Rhine Embayment and southern Ruhr Valley Graben from the Tortonian onwards and reached the Campine area only sporadically during Messinian and Pliocene time (Fig. 7). The northern age signature can thus be interpreted as a background marine signal. The difference in heavy mineral composition between the northern and southern heavy mineral signature may be caused by recycling of chemically weathered sediment, leading to a progressive depletion of epidote, amphiboles and garnet and a relative increase in ultrastable and parametamorphic minerals. This is best exemplified by the temporal evolution in the central Campine area (Dessel).

Fig. 7. Provenance model for the Neogene southern North Sea Basin for (a) the lower–middle Miocene (Berchem–Bolderberg Fm), (b) the Tortonian (Diest Fm) and (c) the Messinian to Pliocene (Kasterlee–Mol–Poederlee Fm). Numbers indicate the main sediment sources: 1 – Eridanos draining Scandinavian and Baltic massifs (Fig. 1); 2 – Meuse and local rivers draining Brabant Massif and Ardennes; 3 – Rhine draining (mainly) Rhenish Massif. A – Antwerp; B – Brussels; Br – Breda; M – Maastricht.
Chemical weathering played an essential role, as the physical process of reworking or recycling does not strongly increase the maturity of sediment and the heavy mineral composition (Garzanti, Reference Garzanti2017). Intense chemical weathering of sediment may have occurred during the climate optimum with warm and humid conditions in early to middle Miocene time (Miller et al. Reference Miller, Wright and Fairbanks1991; Mosbrugger et al. Reference Mosbrugger, Utescher and Dilcher2005; Kotthoff et al. Reference Kotthoff, Greenwood, McCarthy, Müller-Navarra, Prader and Hesselbo2014). Eocene and early Miocene erosion surfaces in the Ardennes, to the south of the study area, are characterized by saprolite, which is formed by intense chemical weathering, similar to lateritization (Demoulin et al. Reference Demoulin, Barbier, Dekoninck, Verhaert, Ruffet, Dupuis, Yans and Demoulin2018). If the Palaeogene sediment and the underlying Palaeozoic sedimentary rock were subsequently recycled during and after the formation of the Mid-Miocene Unconformity, the resulting sediment would have had an increased compositional maturity, while largely maintaining the original zircon U–Pb age signature. Chemical alteration of recycled sediment through diagenesis may have also played a role, though less significant as the sediment was not deeply buried.
In the scenario of weathering and recycling, the strongly variable heavy mineral signature still partly represents a provenance signature, owing to differential weathering in different source areas. The northern heavy mineral signature represents little weathered northern input, transported through alongshore currents, combined with the reworking of older sediment within the southern North Sea Basin with a northern heavy mineral signature, such as the lower Miocene and little weathered Oligocene units, which crop out more to the north than the older Palaeogene sediment and Palaeozoic sedimentary rocks. The mixed to southern heavy mineral signature of the upper Miocene sediment combined with a rather northern zircon U–Pb age signature is partly the result of the recycling of chemically weathered Palaeogene sediment and Palaeozoic sedimentary rock, which were delivered through rivers draining the Ardennes and Brabant Massif to the south and southwest of the study area, such as the Meuse river (Fig. 7). The Ardennes were uplifted several hundreds of metres during Neogene time due to Alpine tectonic activity, leading to significant erosion of their sediment cover, which makes the significant recycling feasible (Demoulin, Reference Demoulin1995). A limited amount of sediment provided through the Proto-Rhine river system was also part of the southern signature in the Campine area, responsible for the delivery of coarser quartz grains and ultrastable minerals including more Palaeozoic zircon ages in the Messinian and Pliocene. The pronounced southern zircon U–Pb age signature of the Tortonian Ruhr Valley Graben sediment indicates that the Rhine became the largest sediment contributor to the western Ruhr Valley Graben from the Tortonian onwards, whereas local rivers and the Meuse delivered the majority of sediment to the Campine area of the southern North Sea Basin at least until early Pliocene time.
6. Concluding remarks
The strongly varying heavy mineral composition combined with the largely homogeneous zircon U–Pb age distribution confirms that recycling of weathered sediment likely provided a very significant portion of the sediment supply to the southern North Sea Basin throughout the Neogene Period. The weathered and recycled southern input was most likely delivered by rivers draining the Ardennes during most of Miocene time, such as the Meuse. Only in the Ruhr Valley Graben can a palaeo-Rhine zircon age signature be recognized from the Tortonian onwards, whereas supply by the Meuse and local rivers remained dominant in the Campine area.
This study shows that the combination of zircon U–Pb age data with heavy mineral data allows for a better understanding of sediment provenance and palaeogeography, especially in cases of significant sediment reworking and recycling. Owing to chemical weathering and recycling, the heavy mineral signature of sediment may be distinct from the signature of little weathered sediment, which may be difficult to distinguish from simple mixing between two sediment sources at first glance. Yet, the zircon U–Pb age distribution remains largely unaltered during this process of chemical weathering and recycling. Combining these two proxies thus provides evidence that such processes had a strong impact on the sediment composition, and that the depositional history was more complex than initially guessed based on the heavy mineral composition.
Acknowledgements
Thanks to NIRAS-ONDRAF for allowing sampling of their ON-Dessel-2 and ON-Dessel-5 cores and to the Belgian Geological Survey for sampling of the other Belgian cores. Thanks as well to Dirk Munsterman of TNO for aiding in sampling of the Dutch cores used in this study. Roel van Elsas is thanked for his assistance with the separation of heavy minerals in his lab at VU Amsterdam. This research was funded by FWO (Flanders Research Foundation) grant 1105818N. The reviewers Carita Augustsson and Noël Vandenberghe are thanked for their in-depth review, which greatly enhanced the quality of the manuscript.
Supplementary material
To view supplementary material for this article, please visit https://doi.org/10.1017/S0016756821000133


