INTRODUCTION
The middle Pleistocene climate was characterized by very intense glaciations alternating with long, warm interglaciations. Tracking glacial–interglacial cycles and their impacts on terrestrial environments is a challenging task for Quaternary science, largely due to a lack of precisely dated sediment records of the advance and retreat of middle Pleistocene ice sheets. During the middle Pleistocene, Poland was occupied by ice sheets from five Scandinavian glaciations, and the most extensive glaciations passed over the South Poland Uplands and entered the Czech Republic. Apart from the Scandinavian ice sheet, mountain glaciers also developed in the Carpathian and Sudetes Mountains (Marks, Reference Marks, Ehlers, Gibbard and Hughes2011). Biological remains of this period in northern continental Europe are scarce, and climatic reconstructions mostly rely on lithological and morphological evidence. Some of the best available sources of paleoclimatic information are speleothems, but until now there have been only a few high-resolution European and Near Eastern speleothem records older than the last interglaciation (Ayalon et al., Reference Ayalon, Bar-Matthews and Kaufman2002; Bard et al., Reference Bard, Delaygue, Rostek, Antonioli, Silenzi and Schrag2002; Bar-Matthews et al., Reference Bar-Matthews, Ayalon and Gilmour2003; Drysdale et al., Reference Drysdale, Zanchetta, Hellstrom, Fallick, Zhao, Isola and Bruschi2004; Spötl and Mangini, Reference Spötl and Mangini2007; Spötl et al., Reference Spötl, Scholz and Mangini2008; Columbu et al., Reference Columbu, Sauro, Lundberg, Drysdale and Waele2018; Regattieri et al., Reference Regattieri, Zanchetta, Isola, Bajo, Perchiazzi, Drysdale, Boschi, Hellstrom, Francke and Wagner2018).
Previous studies have identified speleothems older than the last interglaciation from the Tatra Mountains, Poland, which formed between MIS 9 and MIS 6, but no detailed paleoclimatic reconstruction was performed (Hercman et al., Reference Hercman, Nowicki and Lauritzen1998, Reference Hercman, Gradziński and Bella2008; Kicińska et al., Reference Kicińska, Hercman and Najdek2017). Recently in that area, a stable isotope analysis of speleothem calcite was used to study the age and activity of slope failures (Szczygieł et al., Reference Szczygieł, Mendecki, Hercman, Wróblewski and Glazer2019). Phreatic speleothems, including massive rafts, that began to grow during MIS 7 were also found in the Klęczany Quarry (Polish western Carpathians; Gradziński et al., Reference Gradziński, Dulinski, Hercman, Górny and Przybyszowski2012). Analyses of their structures, ages, and stable isotope compositions were conducted to explain their formation (Gradziński et al., Reference Gradziński, Dulinski, Hercman, Górny and Przybyszowski2012), but these analyses were not used for paleoclimatic reconstruction.
In this study, we present a new paleoclimatic record based on the stable isotope composition, petrography, and trace element content of a stalagmite collected from the Tatra Mountains, southern Poland. The new record spans MIS 9 to 7 (ca. 330–200 ka) and is one the few paleoenvironmental records of the MIS 9 interglaciation from central Europe. MIS 9 was a warm period with some similarities to the Holocene (Ruddiman, Reference Ruddiman2007) and has been considered a possible analog to the future human-induced warm climate (Yin and Berger, Reference Yin and Berger2015). Such study of past climates is important for improving our understanding of natural climatic fluctuations. This study, as the first comprehensive paleoclimatic study based on Tatra speleothems, has regional importance, because glaciations before the last glacial period are poorly recognized (Kłapyta and Zasadni, Reference Kłapyta and Zasadni2018). Furthermore, we provide a multiproxy paleoclimatic study on the northern slopes of the Carpathians during the middle Pleistocene, a region and period that are still poorly represented, especially in European continental archives (Kern et al., Reference Kern, Demény, Perşoiu and Hatvani2019).
CAVE SETTINGS
Study area
The Tatra Mountains are the highest range of the Carpathians, reaching 2655 m above sea level (asl; Fig. 1). Elevated 1600 m above their surroundings and shaped by glaciers, the Tatra Mountains have alpine characteristics in terms of both geomorphology and ecology. Outcropping to the south, the crystalline basement is covered by Mesozoic sediments and thrust nappes, which are exposed in the northern and westernmost parts of the massif (Jurewicz, Reference Jurewicz2005). The sedimentary succession is composed mostly of carbonates affected by karstic erosion, which has resulted in karst drainage developments, including numerous caves (Gradziński et al., Reference Gradziński, Hercman, Kicińska, Barczyk, Bella and Holúbek2009). We studied a speleothem from Szczelina Chochołowska Cave (49°14′45.40″N, 19°48′43.14″E) located in the Chochołowska Valley.

Figure 1. Location of the study site. (A) Location of selected speleothems from Europe: OH2 (Regattieri et al., Reference Regattieri, Zanchetta, Isola, Bajo, Perchiazzi, Drysdale, Boschi, Hellstrom, Francke and Wagner2018); GG1 (Columbu et al., Reference Columbu, Sauro, Lundberg, Drysdale and Waele2018); and CC1 (Drysdale et al., Reference Drysdale, Zanchetta, Hellstrom, Fallick, Zhao, Isola and Bruschi2004) marked as black triangles; location of other records: I, the southeastern Essex channel deposits (Roe et al., Reference Roe, Coope, Devoy, Harrison, Penkman, Preece and Schreve2009); II, pollen records from northern Germany (Urban, Reference Urban, Sirocko, Litt, Claussen and Sanchez-Goni2007); III, pollen records from Lake Ohrid (Sadori et al., Reference Sadori, Koutsodendris, Panagiotopoulos, Masi, Bertini, Combourieu-Nebout and Francke2016); IV, pollen records from northeastern Greece (Fletcher et al., Reference Fletcher, Muller, Koutsodendris, Christanis and Pross2013); location of SC-3 in the Tatra Mountains (black rectangle); (B) location of Szczelina Chochołowska Cave in the Tatra Mountains. Asterisks represent meteorological stations mentioned in the text: (a) Chochołowska Valley; (b) Kasprowy Wierch; (c) Hala Gąsienicowa; (d) Zakopane.
The Chochołowska Valley is located in the northwestern portion of the Tatra Mountains (Fig. 1). On the border between crystalline and carbonate rocks, part of the water was captured by karst, and underground drainage dissolved the conduits of Szczelina Chochołowska Cave, the longest cave in the valley (2320 m long; Luty, Reference Luty2013; Fig. 2A). A more detailed study of the Szczelina Chocholowska Cave geologic setting and its development was presented by Nowicki (Reference Nowicki1996). The hydrological connections of the cave and the results of dye-tracer experiments in that area were described by Barczyk (Reference Barczyk2004). The cave is horizontal, with three entrances at 1051, 1072, and 1083 m asl (i.e., 26, 50, and 51 m above the valley bottom), and is developed mainly in Upper Jurassic–Lower Cretaceous limestone and partly in crinoid Middle Jurassic limestone (Borówka et al., Reference Borówka, Kostrzewski and Zwolinski1985; Nowicki, Reference Nowicki1996). Hitherto, the oldest speleothem dated from Szczelina Chochołowska Cave was approximately 350 ka (Hercman et al., Reference Hercman, Nowicki and Lauritzen1998). The stalagmite (SC-3) was collected in the New Corridor (Hercman et al., Reference Hercman, Nowicki and Lauritzen1998; Fig. 2A).

Figure 2. (color online) (A) Plan view of Szczelina Chochołowska Cave showing the location (a large open black arrow) where the stalagmite was collected (Luty Reference Luty2013, modified); (B) the collected SC-3 stalagmite. Thin, straight black lines represent isotope tracks; black rectangles indicate U-Th dating; and thick black lines indicate hiatuses: H-1, H-2, and H-3.
Local climate and isotopic studies in the Tatra Mountains
Poland lies in the center of Europe, and it has been shown that the Polish climate roughly represents the average climate of Europe (e.g., Luterbacher et al. Reference Luterbacher, Xoplaki, Küttel, Zorita, González-Rouco, Jones, Stössel, Przybylak, Majorowicz and Brázdil2010). A very good agreement between European land (excluding Poland) and Polish winter temperatures (at interannual and interdecadal time scales) was reported; the correlation coefficient of Polish and European mean temperatures over the last full 500 year period was 0.96. Precipitation was more variable than temperature during that time period; however, the results also indicated that the reconstructed winter precipitation over Poland agrees well with those for the rest of Europe (Luterbacher et al. Reference Luterbacher, Xoplaki, Küttel, Zorita, González-Rouco, Jones, Stössel, Przybylak, Majorowicz and Brázdil2010). The North Atlantic Oscillation in Poland, as in western Europe, is the most important large-scale source of climatic variability. The confirmed stability of the large- to regional-scale links is very important for all paleoclimatic reconstruction works, because the robustness of the link between a local proxy and the large-scale climate is a necessary condition for the correct interpretation of different climatic proxies. However, the research area is located in the mountains, so local conditions strongly influence the extraregional climatic pattern observed in the Polish lowlands. In particular, it is related to the temperature gradient, which is approximately 0.6°C per 100 m in the Tatra Mountains, and to the increased total annual sum of precipitation. The Tatra Mountains are located in a transitional climatic zone under the influence of polar–oceanic humid air masses. The distribution of the mean annual temperature is nearly uniform on the northern and southern slopes of the massif, with only slightly higher values, approximately 0.5°C, on the southern slope (Makos et al., Reference Makos, Dzierżek, Nitychoruk and Zreda2014).
For the last 50 years in Chochołowska Valley, the maximum and minimum absolute temperatures recorded are 30.0°C and −32.1°C, respectively. Based on data collected from 1951, in that region, the coldest temperatures are usually in January, and the warmest month is July. The mean temperatures are −5.7°C for winter and 12.3°C for summer, and the mean annual temperature is 3.6°C (Niedźwiedź, Reference Niedźwiedź1992).
The annual precipitation at the same elevation of the Tatra Mountains massif is approximately 40% higher on the northern slopes than on the southern slopes. This is due to the prevailing northwestern atmospheric circulation and moisture transport in central Europe (Niedźwiedź, Reference Niedźwiedź1992). The annual precipitation on the northern slope of the Tatra Mountains is 1100 mm in Zakopane (850 m asl), 1788 mm in Hala Gąsienicowa (1520 m asl), and 1800 mm in Kasprowy Wierch (1991 m asl; Makos et al., Reference Makos, Dzierżek, Nitychoruk and Zreda2014). The annual total precipitation amount at the Chochołowska Valley meteorological station is approximately 1300 mm, with much higher precipitation during summer months than during winter. The ratio of winter (December–February) to summer (June–August) precipitation for the Chochołowska Valley is approximately 0.36 (Niedźwiedź, Reference Niedźwiedź1992).
The annual average δ18O value of the monthly precipitation taken at Ornak Station, located at a similar altitude as the studied cave entrances, was −11.26‰ (Różański and Duliński, Reference Różański and Duliński1988). δ18O values were also measured in surface outflows (springs, streams, discharges, and resurgences) and vadose seepage waters in the selected caves of the western part of the Tatra Mountains (Różański and Duliński, Reference Różański and Duliński1988). During the period October 1983 to January 1986, the average δ18O value of surface outflows was −11.59 ± 0.04‰ (n = 43, variation ranged from −12.05‰ to −11.25‰) and that of vadose seepage waters collected in the Szczelina Chochołowska and Miętusia Caves was −10.64 ± 0.13‰ (n = 19, variation ranged from −11.65‰ to −9.8‰; Różański and Duliński, Reference Różański and Duliński1988).
Stable isotope (O and C) analyses from limestone samples taken near the Szczelina Chochołowska entrances show average δ13C and δ18O values of approximately 0.47 ± 0.13‰ and −2.79 ± 0.52‰, respectively.
MATERIALS AND METHODS
Material
The SC-3 stalagmite was collected in the New Corridor in Szczelina Chochołowska Cave (Fig. 2B). It is a 24.5-cm-high and 10-cm-wide fragment of a larger stalagmite with a broken base and top parts. Four macroscopically different parts, separated by hiatuses, can be distinguished. Those growth interruptions are underlined with layers of detrital material (Fig. 2B) and occur at 186 (H-1), 196.6 (H-2), and 230 mm (H-3) from the base of the sample. Successive stalagmite layers of calcite crystals differ in color, detrital material admixtures, porosity, and other calcite crystal features (Fig. 2B). The first type of calcite is dark yellow and indistinctly laminated and contains a small admixture of detrital material. The second type of calcite is light brown with more visible calcite laminae and higher porosity. These two types are dominant in the older part of the stalagmite. The third type is dark brown and contains a greater admixture of detrital material. Changes in the growth axis direction occur in the upper part of the stalagmite, where hiatuses can also be observed (H-1 and H-2). At the time of the first hiatus, H-1, the SC-3 stalagmite growth axis changed (Fig. 2B). During the growth of this fragment, H-2 is visible but is not associated with a change in the growth direction. Finally, the stalagmite was broken (H-3) and covered with milky white layers of calcite that are indistinctly laminated and lack apparent porosity.
Methods
U-series dating and age–depth model construction
A series of calcite samples (approximately 200 mg each) were drilled along the lamina. The chemical separation of uranium and thorium from the carbonate matrix was performed at the U-series Laboratory of the Institute of Geological Sciences, Polish Academy of Sciences (IGS PAS; Warsaw, Poland) following the method described by Hellstrom (Reference Hellstrom2003). Internal standards and blank samples were prepared and processed in parallel to all studied samples. The mass abundances of 236U, 233U, 234U, 235U, 229Th, 230Th, and 232Th were measured with a double-focusing sector field Inductively Coupled Plasma (ICP) mass spectrometer (Element 2, Thermo Finnigan MAT) at the Institute of Geology of the Czech Academy of Sciences (Prague, Czech Republic). The measurement results were corrected for background counts and chemical blanks. The final results were reported as activity ratios. U-series ages were iteratively calculated from the (230Th/234U) and (234U/238U) activity ratios. All uncertainties, except uncertainties associated with decay constants, were taken into account when assessing age uncertainties using error propagation rules.
The 232Th isotope is an indicator of contamination by thorium and/or uranium from detrital sources. For mass spectrometry, the threshold value of the (230Th/232Th)A for “clean samples” is commonly considered to be values of 200–300 (Hellstrom, Reference Hellstrom2006). However, common practice is to routinely correct all ages regardless of their measured (230Th/232Th)A. The correction across the whole profile was made using a modified algorithm proposed by Hellstrom (Reference Hellstrom2006), with adopted stratigraphical constraint using Monte Carlo simulation and the requirement that any axial sequence of true ages must exhibit a monotonic increase away from the outer surface. The main idea is to find the minimum possible contamination correction to set ages in stratigraphic order. Contrary to the algorithm proposed in Hellstrom (Reference Hellstrom2006), the algorithm used (described for the first time and accessible on request) searches for the minimum values (between 0.01 and 20) of three initial activity ratios in contaminant: Th0 (230Th/232Th)A, U1 (234U/232Th)A, and U2 (238U/232Th)A and estimates those values separately for each sample.
The whole procedure was repeated until the population of results for every sample (corrected ages and initial activity ratios in contaminant) in the profile was 1000. Based on this population, the corrected ages with 2σ errors were calculated for whole profile. The calculated corrected ages and possible lowest initial activity ratios of contaminant (Th0, U1, U2) are presented in Table 1.
Table 1. Results of the U-series dating of the stalagmite from Szczelina Chochołowska Cave.a

a Calculations use the decay constants of Jaffey et al. (Reference Jaffey, Flynn, Glendenin, Bentley and Essling1971) (238U), Cheng et al. (Reference Cheng, Edwards, Shen, Polyak, Asmerom, Woodhead and Hellstrom2013) (234U and 230Th), and Holden (Reference Holden1990) (232Th). Ages do not include uncertainties associated with decay constants. Reported errors are equal to 2σ.
b H, distance from the base.
c Activity ratio.
d Corrected ages using the modified algorithm proposed by Hellstrom (Reference Hellstrom2006) method described in more detail in the text.
e Calculated based on corrected (234U/238U)A and corrected age values.
Based on the U-series dating results with 2σ errors, an age–depth model was created using the MOD-AGE algorithm (Hercman and Pawlak, Reference Hercman and Pawlak2012). The LOWESS technique was used to estimate age–depth relationships. The chosen SPAN value for the LOESS model was 0.38, representing the highest value of SPAN, which allowed the estimation of an age–depth model corresponding to all data points inside the 2σ confidence interval (Hercman and Pawlak, Reference Hercman and Pawlak2012).
Stable isotope analyses
The subsamples used for stable isotope analyses from SC-3 were drilled along its growth axis at approximately 1 mm increments, producing 225 samples. Additionally, three profiles were sampled along the growth layers at different distances from the SC-3 base, at 58, 134, and 172 mm, to perform the Hendy test (Hendy, Reference Hendy1971).
Analyses of the carbon and oxygen isotopic compositions (δ13C and δ18O) were performed using a KIEL IV carbonate device (Thermo Scientific) coupled to a Delta Plus IRMS (Finnigan MAT) using the dual-inlet mode at the Stable Isotope Laboratory of the IGS PAS. The samples were prepared automatically according to the method described by McCrea (Reference McCrea1950). Calcite samples were reacted with anhydrous orthophosphoric acid at 70°C. The results were normalized to two international standards, NBS 19 and IAEA CO 8, and were reported relative to the VPDB international standard. The reproducibility was checked by the measurement of two internal standards after every 12 samples. The analytical precision (1σ) was better than 0.03‰ and 0.08‰ for δ13C and δ18O, respectively.
Petrography
Six thin sections covering the continuous profile of SC-3 were prepared to enable microscopic observations and the study of microscopic features, such as the appearance of calcite crystals, fabric type, discontinuities, and porosity. The microscopic observations were obtained using a Nikon Eclipse LV100POL microscope from the IGS PAS. The analysis and characterization of the speleothem fabrics were based mainly on the methodology proposed by Frisia (Reference Frisia2015). As a result of the speleothem fabric analysis, it was possible to briefly characterize the environmental conditions that occurred during speleothem growth and create a fabric log for SC-3.
The mineralogical composition of the studied stalagmite was tested with X-ray diffractometry (XRD) in the Clay Mineral Laboratory of IGS PAS in Kraków using a Thermo Electron X'TRA diffractometer equipped with an automatic sample changer and a specially adapted environmental chamber.
Trace element analyses
Trace element profiles were measured along the stalagmite growth axis in six thin 50 μm sections using the Laser Ablation Inductively Coupled Plasma Mass Spectrometry (LA-ICP-MS) method. For the measurements, an Analyte Excite Excimer laser ablation with a wavelength of 193 nm and an Element 2 (Thermo Finnigan) inductively coupled plasma mass spectrometer were used. The measurement was performed at the Institute of Geology of the Academy of Sciences in Prague, Czech Republic. The conditions for LA were a laser output of 50% with 10 Hz pulses, which achieved a fluency of 2.44 J/cm2. The width of each line was 50 μm, and the laser speed during scans was 20 μm/s. The analysis of near-surface trace elements (Mg, Sr, Ba, Na, P, Si, Fe, Al, Cu, and U) was performed in one line at medium resolution. The measured intensities were normalized to the Ca content. Additional details of the LA-ICP-MS analytical procedure are described in Treble et al. (Reference Treble, Shelley and Chappell2003, Reference Treble, Chappell and Shelley2005) and Desmarchelier et al. (Reference Desmarchelier, Hellstrom and McCulloch2006).
RESULTS
Chronology of the SC-3 stalagmite
The results of the U-series dating are presented in Table 1. The reported errors of the SC-3 stalagmite data represent 2 standard deviations, and they vary from 1.5% to 3%. In almost all cases (except age 283 ka in the older and 237 ka in the younger part of the stalagmite), the ages corrected are within the error range of the uncorrected ages. The values of Th0, U1, and U2 suggest negligible contamination for the majority of samples (Table 1). The light-brownish lamination appeared near the sampling point of the two samples with higher values of Th0, U1, and U2 (Fig. 2B), probably indicating a higher detrital contamination.
The corrected U-series ages were used to generate the age–depth model for the studied speleothem. Based on the age–depth model of the SC-3 stalagmite (Fig. 3), the age of the oldest preserved layer in the stalagmite is estimated to be 327 ± 7 ka, and the growth of the older part of the stalagmite (below the H-1 hiatus) lasted continuously to approximately 289 ± 4 ka. The growth rate suggested by the model is rather stable at approximately 5 mm/ka, with only minor fluctuations.

Figure 3. Age–depth model for the SC-3 stalagmite. The identified hiatuses, H-1 and H-2, are marked as gray lines. The numbers represent the growth rates for the different parts of the stalagmite. One U-Th date between hiatuses was omitted, because the model for this part of the stalagmite could not be built. (For interpretation of the references to color in this figure legend, the reader is referred to the web version of this article.)
The age–depth model for the youngest part of the stalagmite (above H-2) indicates that it was formed from ca. $250_{{-}7}^{ + 10}$ to $200_{{-}17}^{ + 20}$
 ka ago (Fig. 3) with a much lower mean growth rate of approximately 0.6 mm/ka.
One U-series date, 273 ± 5 ka, was obtained from the part of the stalagmite between the H-1 and H-2 hiatuses (Fig. 2B). The growth of this part, which is composed of small, porous, sparse irregular calcite crystals with several micritic layers, was rather intermittent and took place during the MIS 8c stadial. Because only one date was obtained for that part and because of its possible discontinuous growth, an age–depth model could not be established, so the obtained proxy results are presented as the distance from the base scale with one benchmark.
Stable isotopes
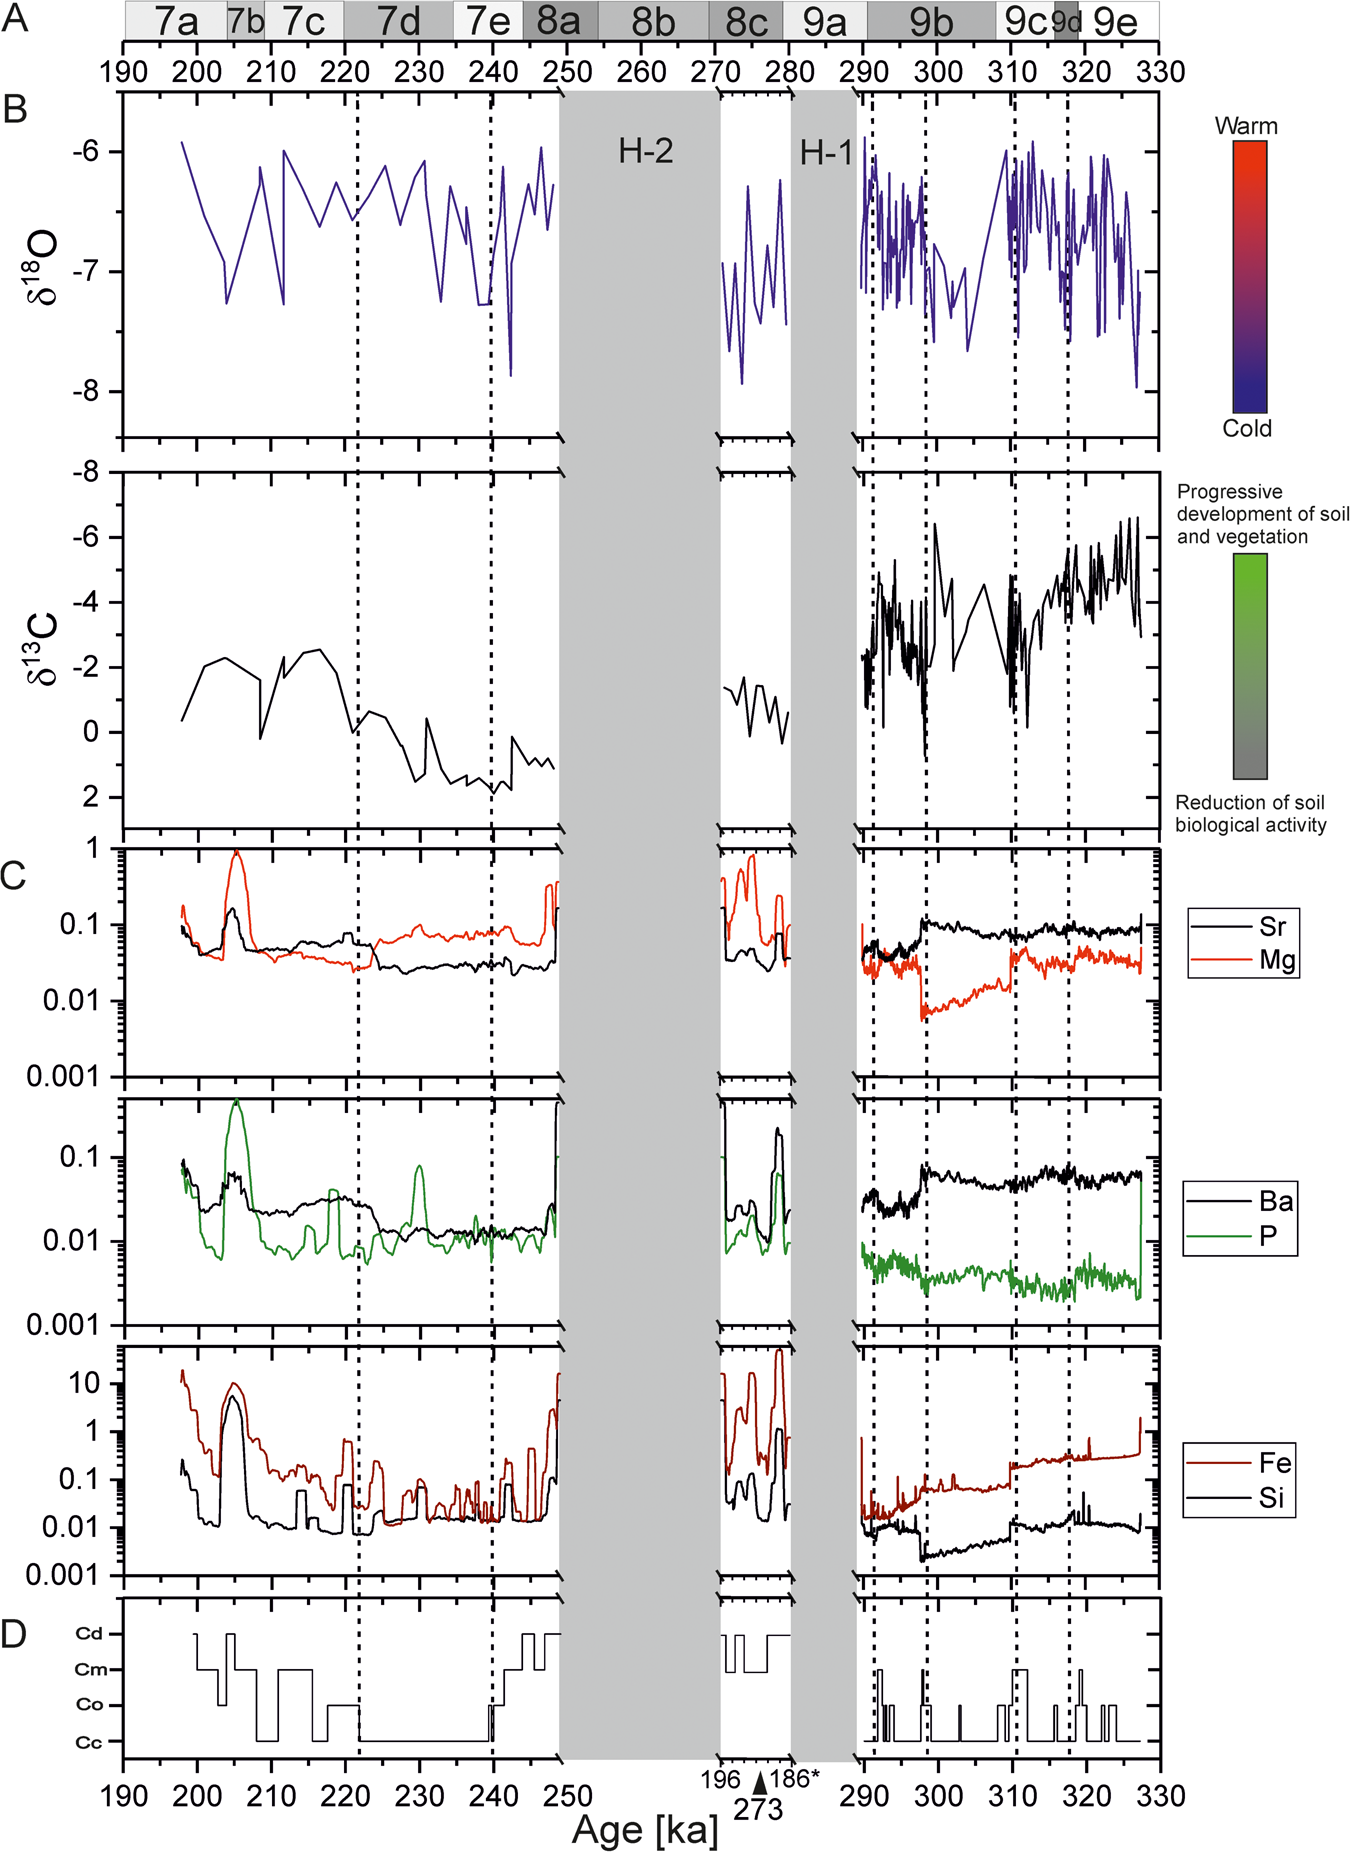
The stable isotope records from the SC-3 speleothem are shown in Fig. 4B. The temporal resolution of the SC-3 stable isotope record is 0.2 ka for the older part of the stalagmite (below the H-1 hiatus), which grew continuously to approximately 289 ka, and 1.7 ka for the younger part (above the H-2 hiatus). The δ18O values of SC-3 range from −7.97‰ ± 0.03 to −5.88‰ ± 0.02, and the δ13C values range from −6.62‰ ± 0.02 to 2.19‰ ± 0.03 (Fig. 4B).

Figure 4. (color online) Combined data from the SC-3 record. (A) Marine isotopic substadials (Railsback et al., Reference Railsback, Gibbard, Head, Voarintsoa and Toucanne2015); (B) oxygen and carbon stable isotope composition with marked hiatuses (gray rectangles) in SC-3; (C) trace element record; (D) fabric log. Cc, columnar compact fabric; Co, columnar open fabric; Cm, columnar microcrystalline fabric; Cd, dark layers with an abundance of detrital material, connected with hiatuses. *The section between hiatuses is presented as the distance from the base scale with one U-Th date as a benchmark. The dashed vertical lines represent the borders of distinct climatically different periods in our record.
Petrography
Based on XRD of the macroscopically different parts of speleothems, it was confirmed that the SC-3 stalagmite is composed of calcite. A microscopic analysis of the appearance of the calcite crystals and an identification of the textural features of the studied material shows that most of the observed stalagmite is composed of elongated calcite crystals that are typical of the columnar fabric described in the work of Frisia (Reference Frisia2015). The crystals range from 0.2 to 2.5 mm in width and 1 to approximately 3 mm in length. In most cases, they are perpendicular to the growth surface in each layer. Typically, the crystals are flush with each other; they are subparallel with one another and extinguish light at the same angle for the entire length of the crystals during microscopic observation. The color of the crystals varies among clear, pale yellow, and brown. In the most commonly occurring type, columnar compact crystals form a compact aggregate, and the intercrystalline porosity is not discernible (Supplementary Fig. S1A and B). In the typical thin layers, characterized by the presence of linear inclusions or pores, columnar open crystals were identified (Supplementary Fig. S1A and B). In other parts of the stalagmite, the calcite crystallites have highly irregular boundaries; they are also characterized by inter- and intracrystalline microporosity and higher impurity content than in other parts (Supplementary Fig. S1C and D). These zones have the classical appearance of columnar microcrystalline fabric (Frisia, Reference Frisia2015). In those parts, a light-brownish lamination probably related to the periodic input of detrital/colloidal particulates also appears (Supplementary Fig. S1E and F). In the studied stalagmite, dark layers with an abundance of detrital material that are connected with hiatuses also occur (Supplementary Fig. S1G–I). Their occurrence indicates the presence of the most unstable stage, that is, corrosion and destruction conditions in the stalagmite, as well as the subsequent renucleation with geometric selection.
The results of the petrographic studies were based on fabric log construction (Fig. 4D). The older part of the stalagmite is dominated by columnar compact fabric with relatively narrow layers of columnar open fabric. Only in short periods, approximately 318, 312, and 298 ka, are parts of the SC-3 stalagmite composed of smaller and irregularly growing crystallites, here classified as columnar microcrystalline fabric (Supplementary Fig. S1D). At approximately 293 ka, a change in the crystallization conditions is visible, and a relatively thin layer of the columnar microcrystalline fabric appears. The section between hiatuses in SC-3 is characterized by columnar microcrystalline fabric and the occurrence of small and irregular crystallites alternating with micritic layers and accumulations of detrital material (Supplementary Fig. S1D). After the H-2 hiatus, the transition to regular and larger crystallites with a dominant columnar compact fabric occurs at approximately 240 ka. The last period of SC-3 growth is also characterized by the dominance of the columnar microcrystalline fabric.
Trace elements
The trace element content along the profiles (normalized to the Ca content) is shown in Figure 4C, and the Pearson correlation values (r) between the different elements are reported in Table 2. The correlation between the near-surface trace elements changes slightly in different parts of the stalagmite, but the Sr and Mg contents are mostly moderately to strongly anticorrelated (with a minimum value of the correlation coefficient of −0.85 in SC-3 between 311 and 298 ka). Only the portions immediately preceding and following breaks in the growth of SC-3 are characterized by weak correlations (with a maximum of 0.32).
Table 2. Pearson correlation coefficients (r) between trace element profiles measured in stalagmite SC-3.a

a Correlation coefficients (r) were calculated for the uninterrupted sections of the stalagmite, with the exception of the part between hiatuses and the parts immediately preceding and following breaks in the growth of SC-3. All reported Pearson correlation values (r) have P values < 0.001. Correlation is significant at the 0.05 level, so all results are statistically significant.
During the analysis of long-term changes in Sr content, a decrease at approximately 297 ka, relatively low values for the period after the H-2 hiatus until ca. 225 ka, and high values in the youngest part of the record can be observed. The Sr content in the profile (Fig. 4C), similar to the content of other trace elements, also increases near the growth hiatuses in the SC-3 stalagmite but is most likely associated with a higher detrital material supply in that period.
In the case of the Mg content (except in the zones associated with the hiatuses), the characteristic features are as follows: increases ca. 311 and 297 ka; lower values between ca. 310 and 297 ka; relatively high values in the period from approximately 248 to 225 ka; and low values in the subsequent period, except for a peak at approximately 205 ka (Fig. 4C).
The Ba content generally changes very similarly to the Sr content (Fig. 4C). The correlation coefficient between these elements reaches 0.95 in the older part of SC-3. The P content is generally characterized by slightly lower variability of values than in the case of other trace elements. The most prominent features are increased content near hiatuses and higher variability in the youngest layers of SC-3, after ca. 230 ka. The P and Ba contents are mostly in moderate anticorrelation (Table 2), except in periods connected with the growth hiatuses in SC-3, when these records react similarly.
The contents of Si and Fe change similarly throughout most of the profiles (Fig. 4C) and are usually moderately correlated (Table 2). However, the amplitude of changes in Fe content is higher than that observed in the changes in Si content. Higher Si and Fe contents can be observed in the youngest layers of SC-3 in particular, most likely connected with greater contamination from detrital material.
DISCUSSION
Factors controlling proxy records in the local environmental framework
The first requirement for using stable isotope records as a paleoclimatic proxy is deposition in the equilibrium state. SC-3 was collected in the deep part of the cave, with a stable microclimate representing the mean annual surface temperature of a region. The porosity in the stalagmite is low, and no significant alteration zones were observed. Similar speleothems generally tend to precipitate close to isotopic equilibrium (McDermott et al., Reference McDermott, Schwarcz, Rowe and Leng2006). Additionally, Hendy tests were performed, which are the classical tests employed to ascertain whether equilibrium conditions were achieved during calcite precipitation (Hendy and Wilson, Reference Hendy and Wilson1968; Hendy, Reference Hendy1971).
Although Hendy's criteria have been challenged (Dorale and Liu, Reference Dorale and Liu2009), they can still indicate possible disequilibrium conditions during speleothem growth (e.g., Daëron et al. Reference Daëron, Guo, Eiler, Genty, Blamart, Boch, Drysdale, Maire, Wainer and Zanchetta2011; Kluge and Affek, Reference Kluge and Affek2012). The correlation coefficient between the δ18O and δ13C values along the axial profile was 0.21, and the results of Hendy's criteria suggest no disequilibrium for the SC-3 stalagmite (see Supplementary Fig. S2). Furthermore, a major part of the studied stalagmite (except the zone related to hiatuses) is composed of different types of columnar fabric, suggesting persistent water films, relatively constant flows, and the deposition of calcite from fluids at near-isotopic equilibrium conditions (Frisia et al., Reference Frisia, Borsato, Fairchild, McDermott and Selmo2002; Frisia and Borsato, Reference Frisia, Borsato, Alonso-Zarza and Tanner2010). These petrographic studies support the idea that the growth of the SC-3 stalagmite occurred under conditions close to isotopic equilibrium.
Speleothems are very valuable material, especially because of their usefulness in paleoenvironmental research (e.g., McDermott et al., Reference McDermott, Schwarcz, Rowe and Leng2006; Lachniet, Reference Lachniet2009; Fairchild and Baker, Reference Fairchild and Baker2012). However, research based on speleothems should be conducted comprehensively, using the gathered material to perform all possible studies, not just the most frequently performed tests (analysis of stable isotopes). An important benefit of a comprehensive analysis of all available data is the greater amount of climate-dependent records available for later interpretation. These analyses are invaluable, because many different factors can influence the stable isotope signal and other proxies, for example, circulation patterns, rainfall amount, temperature changes, cyclone intensity, vegetation cover, or even kinetic fractionation or evaporation (e.g., Lachniet, Reference Lachniet2009; Dreybrodt and Scholz, Reference Dreybrodt and Scholz2011; Fairchild and Baker, Reference Fairchild and Baker2012; Demény et al., Reference Demény, Kern, Czuppon, Németh, Leél-Őssy, Siklósy and Haszpra2017; Columbu et al., Reference Columbu, Sauro, Lundberg, Drysdale and Waele2018).
The factors driving the oxygen isotope ratios in speleothems are numerous and vary on a spatial and temporal basis. In central and northern Europe, δ18O variation is strongly positively related to the condensation temperature (+0.58‰/°C), whereas the influence of the rainfall amount on δ18O is negligible (Różański et al., Reference Różański, Araguás-Araguás, Gonfiantini, Swart, Lohmann, McKenzie and Savin1993). Additionally, the recently reported temperature effect for annual precipitation in Europe ranges from −0.11‰/1°C for Mediterranean sites (generally insignificant effects were observed at the coastal sites) and up to 0.75‰/1°C for continental locations; this relationship is expected to be preserved in the speleothem δ18O record (Kern et al., Reference Kern, Demény, Perşoiu and Hatvani2019). Many aspects of atmospheric circulation during the analyzed period remain unknown. However, the reported mean annual precipitation relationships of +0.58‰/1°C and 0.75‰/1°C are well above the temperature dependence of water–calcite isotopic equilibrium fractionation (−0.177‰/1°C; Tremaine et al., Reference Tremaine, Froelich and Wang2011). Therefore, we consider the simplest scenario, in which the δ18O variation observed in the SC-3 stalagmite primarily reflects a change in the mean annual temperature. That temperature dependence, which is often noted in records from central and northern Europe, is reflected in the δ18O values, which are usually lower during colder periods and higher during warmer periods (e.g., Mangini et al., Reference Mangini, Spötl and Verdes2005; Spötl et al., Reference Spötl, Mangini and Richards2006; Spötl and Mangini, Reference Spötl and Mangini2007; Häuselmann et al., Reference Häuselmann, Fleitmann, Cheng, Tabersky, Günther and Edwards2015; Moseley et al., Reference Moseley, Spötl, Cheng, Boch, Min and Edwards2015). Over short intervals, even if the δ18O record is mainly controlled by the temperature, oxygen composition changes can respond more to variations in rainfall, but in these situations, the interpretation should be additionally supported by other proxies, such as the carbon isotopic composition and/or changes in the contents of trace elements, such as Mg, Sr, Ba, and P (e.g., Buhl et al., Reference Buhl, Immenhauser, Smeulders, Kabiri and Richter2007).
The carbon isotope variations in the precipitated calcite are still not fully understood, but they most likely reflect climate-driven paleo-vegetation signals (e.g., McDermott et al., Reference McDermott, Schwarcz, Rowe and Leng2006). The δ13C value in speleothems usually reflects the balance between isotopically light biogenic carbon derived from the soil CO2 and heavier carbon dissolved from the limestone bedrock (e.g., Fairchild and Baker, Reference Fairchild and Baker2012; Sharp, Reference Sharp2017; Zhang, Reference Zhang2018). It is accepted that in temperate zones, increasing δ13C values in speleothems are related to a more significant contribution of 13C-enriched carbon from bedrock dissolution and/or to a decrease in soil CO2 productivity due to a reduction in rainfall and/or a cooler climate (e.g., Genty et al., Reference Genty, Baker and Vokal2001). A reduction in recharge can also produce degassing along the fracture paths, prior calcite precipitation, and longer rock–water interaction times, all resulting in higher δ13C values in dripwater and speleothems (e.g., Fairchild et al., Reference Fairchild, Smith, Baker, Fuller, Spötl, Mattey and McDermott2006; Fairchild and Baker, Reference Fairchild and Baker2012). Finally, we interpreted the increase observed in the δ13C proxy in the SC-3 stalagmite as a deterioration of climatic conditions, usually connected with cooler temperatures and/or a reduction in rainfall and consistently lower vegetation productivity.
Generally, analyzing trace element data is a challenging task, and without additional monitoring data, it is almost impossible to conclusively interpret the observed variations in trace element records. However, adopting a multiproxy approach enables the use of trace element records as support for building a more accurate interpretation of past hydrological variation (e.g., van Beynen et al. Reference van Beynen, Soto and Pace-Graczyk2008; Fairchild and Treble, Reference Fairchild and Treble2009). For example, many studies have demonstrated a convincing relationship between dripwater, Mg and Sr content in speleothems, and recorded rainfall (e.g., Tooth and Fairchild, Reference Tooth and Fairchild2003; Treble et al., Reference Treble, Shelley and Chappell2003; McDonald et al., Reference McDonald, Drysdale and Hill2004). In the case of SC-3, we considered the correlation between high relative concentrations of Mg and Sr (especially connected with similar responses in δ13C) as an indicator of drier conditions possibly connected with the enhanced prior calcite precipitation (Fairchild and Treble, Reference Fairchild and Treble2009; Johnson et al., Reference Johnson, Hu, Belshaw and Henderson2006). In contrast, we used a lack of correlation between the Mg and Sr contents or even anticorrelation with generally higher Sr content, especially when associated with depleted δ13C values, as a possible indication of warmer and wetter periods (Hellstrom and McCulloch, Reference Hellstrom and McCulloch2000; van Beynen et al., Reference van Beynen, Soto and Pace-Graczyk2008). The Ba/Ca ratio can also be used as an effective paleohydrological indicator (e.g., Fairchild and Treble, Reference Fairchild and Treble2009), and empirical studies have indicated that Ba concentrations tend to increase with the speleothem growth rate (e.g., Tesoriero and Pankow, Reference Tesoriero and Pankow1996; Treble et al., Reference Treble, Shelley and Chappell2003). We treated a higher Ba/Ca ratio as a possible indicator of wetter climatic conditions favorable for relatively fast growth in warm periods (e.g., Treble et al., Reference Treble, Shelley and Chappell2003). The P content was also confirmed to be a reliable rainfall proxy that was dependent on the effects of climate on the rate of bioproduction, especially in regions where the soil P retention capacity is poor (e.g., Treble et al., Reference Treble, Shelley and Chappell2003). We considered the observed increase in SC-3 speleothem P content to be a suggestion of environmental conditions favorable to vegetation productivity, with the higher water supply and infiltration flushing P from the soil (e.g., Huang et al., Reference Huang, Fairchild, Borsato, Frisia, Cassidy, McDermott and Hawkesworth2001; Treble et al., Reference Treble, Shelley and Chappell2003). In the case of the Fe and Si contents, we considered the high Fe and Si contents to be potential indicators of wet periods when the total flux of detritus and infiltration were high (Hu et al., Reference Hu, Huang, Fang, Xie, Henderson and Cai2005; Fairchild and Treble, Reference Fairchild and Treble2009).
Interpretation of climatic conditions based on data from the SC-3 stalagmite
The SC-3 stalagmite growing from MIS 9e to MIS 7 covers a very interesting period of the transition from one of the warmest interglaciations (MIS 9, especially MIS 9e) through MIS 8, which appears to be a weak glaciation in many records (particularly benthic δ18O; Lisiecki and Raymo, Reference Lisiecki and Raymo2005), to the MIS 7 interglaciation, which generally exhibits widespread weakness (e.g., Lang and Wolff, Reference Lang and Wolff2011; Berger et al., Reference Berger, Crucifix, Hodell, Mangili, McManus, Otto-Bliesner and Pol2015). The multiproxy data obtained allow for analysis of this period with higher resolution and the estimation of local impacts based upon observed global climatic variability. This first period of speleothem growth, from MIS 9e to MIS 9c, took place in favorable climatic conditions (warm and humid) with a high and stable water supply, suggested by the high δ18O values, low δ13C values, and the occurrence of columnar compact and columnar open fabrics (Fig. 4B and D). Only a relatively short, slightly colder period, evidenced by a small decrease in δ18O values and a minor increase in δ13C values (Fig. 4B), correlated with MIS 9d, can be noted. Then, at the MIS 9c/MIS 9b transition, the step changes observed in several proxies, that is, short peaks in δ18O and δ13C values and the relatively high content of Mg, suggest the occurrence of a drier episode but may also be connected with the shift in the sampling path made to avoid the physical break in the sample (Fig. 2). MIS 9b in the Tatra Mountains was a period characterized by higher variability in climatic conditions. In the first part of the MIS 9b transition, the lower δ18O values suggest decreasing temperatures (Fig. 4B) but still relatively wet climatic conditions, with no signs of prior calcite precipitation indicated by relatively high Sr and Ba contents or strong anticorrelation between the Mg and Sr contents (Fig. 4C). Then, a strong hydrological condition change near the cave, possibly related to a strong infiltration event causing massive flushing of detritus, can be inferred based on an increase in both the δ18O and δ13C values, the occurrence of columnar to microcrystalline fabric connected with changes in the water supply, and rapid changes in the trace element contents (Fig. 4B–D). The last part of MIS 9b is connected with stable growth conditions but with rather low temperatures, as evidenced by a decrease in the δ18O value in SC-3 (Fig. 4B). This period was also characterized by higher precipitation and greater vegetation development, as indicated by the lower δ13C values and the relatively high P and Mg (Fig. 4B and C). In the last period of the MIS 9b/MIS 9a transition before the H-1 hiatus, short peaks in the δ18O and δ13C values and rapid changes in the trace element content suggest a reduction in precipitation that could be the main cause of the SC-3 growth cessation ca. 288 ka.
For the subsequent growth period in MIS 8, due to breaks in SC-3 growth and the impossibility of building the age–depth model for that section, detailed paleoclimatic conditions cannot be inferred on a temporal basis. All data obtained from that part give us only some rough suggestions about rather low temperatures, indicated by relatively low and variable δ18O values and high δ13C values (Fig. 4B) and the occurrence of periods with intensive rainfall, a periodically higher water supply, and a high infiltration rate (Fig. 4B–D) in the Tatra Mountains during MIS 8.
The first part of SC-3 growth after the H-2 hiatus can be interpreted as an indication of higher temperatures, suggested by the high values of δ18O, as well as an effect of generally diminished rainfall, indicated by high trace element content and/or the occurrence of columnar microcrystalline fabric (Fig. 4C and D). The next period of growth until MIS 7d was probably connected with variable temperatures but relatively stable water supply and still poorly developed vegetation, evidenced by variable δ18O values, relatively high δ13C values, small fluctuations in trace element contents, and the occurrence of columnar compact fabric (Fig. 4B–D). In late MIS 7, the proxy record indicates not only the beginning of vegetation development, as suggested by an increase in δ13C values (Fig. 4B), but also strong hydrological changes, especially from MIS 7b, interpreted based on stronger fluctuations in all trace element contents and the occurrence of the columnar microcrystalline fabric (Fig. 4C and D), which could cause instability in dripwater supply and/or instability in the bedrock or the ceiling. The SC-3 record stopped in MIS 7a, and the youngest part of the stalagmite was most likely destroyed at H-3.
The obtained SC-3 data in the context of other U-Th–dated records
The obtained speleothem record is one of very few long-term sources of information reported so far based on speleothem studies concerning climatic changes during glacial conditions in MIS 8 (e.g., Hercman et al., Reference Hercman, Bella, Głazek, Gradziński, Lauritzen and Løvlie1997, 1998; Hercman, Reference Hercman2000; Plagnes et al., Reference Plagnes, Causse, Genty, Paterne and Blamart2002; Drysdale et al., Reference Drysdale, Zanchetta, Hellstrom, Fallick, Zhao, Isola and Bruschi2004; Spötl and Mangini, Reference Spötl and Mangini2007; Columbu et al., Reference Columbu, Sauro, Lundberg, Drysdale and Waele2018; Regattieri et al., Reference Regattieri, Zanchetta, Isola, Bajo, Perchiazzi, Drysdale, Boschi, Hellstrom, Francke and Wagner2018). The records obtained from the Tatra Mountains indicate that the best climatic conditions for speleothem growth occurred in MIS 9e, and, for example, a trend of increasing δ13C values suggest subsequent gradually decreasing soil/vegetation activity as the climate cooled and the ice volume increased throughout MIS 9 (Fig. 5C). MIS 8 in the Tatra Mountains is associated with cold temperatures and conditions that were worse for vegetation development but enabled intermittent speleothem growth. The interpreted climatic conditions during MIS 7 indicate that this interglaciation was periodically drier than and not as warm as MIS 9. Such characteristics of the marine isotopic stages correspond relatively well with the variability observed in global records, for example, summer insolation data (Huybers, Reference Huybers2006; Fig. 5D) and stacked benthic oxygen isotope curves (Lisiecki and Raymo, Reference Lisiecki and Raymo2005; Fig. 5E).

Figure 5. (color online) The comparison of the δ18O and δ13C records from SC-3 with global data and selected speleothems from Europe. (A) Marine isotopic substadials (Railsback et al., Reference Railsback, Gibbard, Head, Voarintsoa and Toucanne2015); (B and C) oxygen and carbon stable isotope composition with marked hiatuses (gray rectangles) in SC-3; (D) integrated summer insolation at 50°N (Huybers, Reference Huybers2006); (E) stacked benthic oxygen isotope curve (Lisiecki and Raymo, Reference Lisiecki and Raymo2005); (F) oxygen and carbon stable isotope composition from southwestern Macedonia (Regattieri et al., Reference Regattieri, Zanchetta, Isola, Bajo, Perchiazzi, Drysdale, Boschi, Hellstrom, Francke and Wagner2018); (G) oxygen and carbon stable isotope composition from southern Alps (Columbu et al., Reference Columbu, Sauro, Lundberg, Drysdale and Waele2018); (H) oxygen and carbon stable isotope composition from central western Italy (Drysdale et al., Reference Drysdale, Zanchetta, Hellstrom, Fallick, Zhao, Isola and Bruschi2004).
Several long-term speleothem paleoclimatic records reaching the MIS 9 period in Europe have been published (Fig. 5F–H). The records include the Macedonian stalagmite OH2 collected in a cave near Lake Ohrid (Regattieri et al., Reference Regattieri, Zanchetta, Isola, Bajo, Perchiazzi, Drysdale, Boschi, Hellstrom, Francke and Wagner2018), an alpine record based on the GG1 stalagmite from the Piani Eterni karst system (Columbu et al., Reference Columbu, Sauro, Lundberg, Drysdale and Waele2018), the Italian speleothem CC1 collected in Antro del Corchia Cave in the Alpi Apuane massif (Drysdale et al., Reference Drysdale, Zanchetta, Hellstrom, Fallick, Zhao, Isola and Bruschi2004), and the last record from the SPA 4 flowstone from the alpine Spannagel Cave (Spötl and Mangini, Reference Spötl and Mangini2007). However, the last stalagmite record was published without a proper chronology and relied on only a few U-series benchmarks. The main phases of growth of SC-3, OH2, and CC1 speleothems took place in similar time periods, and hiatuses H-1 and H-2 in SC-3 are coincident with the growth break in the Macedonian OH2 stalagmite (Fig. 5F–H). The growth of the alpine GG1 stalagmite started later and corresponds with the end of the growth of the OH2 stalagmite and with the H-1 hiatus in the SC-3 stalagmite (Fig. 5F–H).
The δ18O values in the southern alpine speleothem GG1 are mostly influenced by the amount of rainfall (Columbu et al., Reference Columbu, Sauro, Lundberg, Drysdale and Waele2018) and are thus similar to those of the Macedonian OH2 stalagmite, in which oxygen isotope variations are also interpreted as being strongly related to variations in the rainfall amount (Regattieri et al., Reference Regattieri, Zanchetta, Isola, Bajo, Perchiazzi, Drysdale, Boschi, Hellstrom, Francke and Wagner2018). On the other hand, CC1 records show strong similarities to regional sea-surface temperature records (Drysdale et al., Reference Drysdale, Zanchetta, Hellstrom, Fallick, Zhao, Isola and Bruschi2004). Therefore, the authors suggested that the main factor that influenced the δ18O values was the temperature. Additionally, the δ18O values in the SPA 4 record are mostly modeled by the atmospheric temperature signal (Spötl and Mangini, Reference Spötl and Mangini2007). In the Tatra Mountains speleothem records, the oxygen isotope variations seem to be mainly dependent on temperature changes. The cessations of growth in OH2 and the growth break in the CC1 record were interpreted by the authors as being connected to subzero temperatures and/or ice above the caves at the time and to decreased rainfall during the glacial period (Drysdale et al., Reference Drysdale, Zanchetta, Hellstrom, Fallick, Zhao, Isola and Bruschi2004, Regattieri et al., Reference Regattieri, Zanchetta, Isola, Bajo, Perchiazzi, Drysdale, Boschi, Hellstrom, Francke and Wagner2018). In the case of the GG1 record, growth breaks during the interglacial period were interpreted as a result of floods and water migration creating epiphreatic paths filled with fine-grained sediments (Columbu et al., Reference Columbu, Sauro, Lundberg, Drysdale and Waele2018). Speleothem growth breaks have also been reported during full glacial periods (Columbu et al., Reference Columbu, Sauro, Lundberg, Drysdale and Waele2018). The first recorded hiatus in SC-3 was most likely associated with a reduction in precipitation, and H-2 could be an effect of strong hydrological changes in the Tatra Mountains.
The δ13C records from all speleothems in this comparison are related to the different contributions of 13C-depleted organic CO2 from the soil and of 13C-enriched CO2 from bedrock dissolution and/or to a decrease in soil CO2 productivity due to a reduction in rainfall and/or a cooler climate. Similar to those in the SC-3 record, the δ13C values in the SPA 4, CC1, and GG1 speleothems approach high levels (even above 0.0‰), reflecting the minimal influence of pedogenic δ13C values. Two possible reasons for this finding can be proposed. The first could be related to climatic conditions, in which high δ13C values suggest rather harsh, cold climatic conditions that did not allow intensive vegetation development during the growth of those speleothems. The second could be related to differences in the local morphology, for example, steep slopes preventing the development of a thick soil layer or fast water circulation that allowed no time for biogenic CO2 saturation. The much lower δ13C values in the Macedonian stalagmite suggest that the soil above the cave was relatively well developed during almost the entire period of stalagmite growth.
A brief characterization of climatic evolution supported by comparison with other records
In summary, the MIS 9 interglacial period in most speleothem records, including SC-3, was a time of major growth and a dominant warm and wet climate until MIS 9a, which was characterized by reduced precipitation. Similar warm and humid conditions during MIS 9 were also reported from the southeastern Essex channel deposits (Roe et al., Reference Roe, Coope, Devoy, Harrison, Penkman, Preece and Schreve2009; I in Fig. 1A), pollen records from northern Germany (Urban, Reference Urban, Sirocko, Litt, Claussen and Sanchez-Goni2007; II in Fig. 1A) and Lake Ohrid (Sadori et al., Reference Sadori, Koutsodendris, Panagiotopoulos, Masi, Bertini, Combourieu-Nebout and Francke2016; III in Fig. 1A). The best climatic conditions for speleothem growth in the SC-3 record can also be correlated with the main forest phases visible in pollen records (e.g., Fletcher et al., Reference Fletcher, Muller, Koutsodendris, Christanis and Pross2013; IV in Fig. 1A; Sadori et al., Reference Sadori, Koutsodendris, Panagiotopoulos, Masi, Bertini, Combourieu-Nebout and Francke2016). The end of the main growth phase of the SC-3 stalagmite is actually simultaneous with the change from warmer and wetter to cooler and drier conditions observed in the pollen record from Lake Ohrid and similar to growth breaks in the CC1 (Drysdale et al., Reference Drysdale, Zanchetta, Hellstrom, Fallick, Zhao, Isola and Bruschi2004) and OH2 (Regattieri et al., Reference Regattieri, Zanchetta, Isola, Bajo, Perchiazzi, Drysdale, Boschi, Hellstrom, Francke and Wagner2018) speleothems, which may be indicative of similarities in the climatic fluctuations observed in Poland and southern Europe.
MIS 8 was a period associated with relatively cold temperatures and worse conditions for vegetation development, but at least in some periods, speleothem growth was not prevented: that is, the growth of GG1 during MIS 8c-MIS 8b or the short SC-3 growth phase in MIS 8c. Most likely there was no strong influence of glaciers in the Tatra Mountains at that time, and the hiatuses were associated with extreme hydrologic events, such as strong rainfall leading to mountain slope deformation (e.g., Szczygieł et al., Reference Szczygieł, Mendecki, Hercman, Wróblewski and Glazer2019). The characteristics of MIS 8 recorded in the Tatra Mountains speleothem indicate a rather different course for this glaciation than has been recorded in the Mediterranean region, where it was associated with extended plateau-like structures with low-amplitude variability and mainly the presence of regional grasslands, which is typical for glacial periods in southeastern Europe (e.g., Fletcher et al., Reference Fletcher, Muller, Koutsodendris, Christanis and Pross2013; Sadori et al., Reference Sadori, Koutsodendris, Panagiotopoulos, Masi, Bertini, Combourieu-Nebout and Francke2016). The observed stable isotope variations in the SC-3 stalagmite during MIS 8 are possibly connected with local climatic factors and related to changes in the average temperatures and/or precipitation, similar to speleothem records from the Alps (e.g., Spötl and Mangini, Reference Spötl and Mangini2007; Columbu et al., Reference Columbu, Sauro, Lundberg, Drysdale and Waele2018).
MIS 7, based on all presented speleothem records, was drier and not as warm as the previous MIS 9 interglaciation. The GG1 speleothems had only a short growth phase, and in the cases of the OH2, CC1, and SPA 4 speleothems, there were no growth phases during the entirety of MIS 7. The rather long growth period during MIS 7 in the Tatra Mountains is distinctive, but the slow growth rate and recorded proxies, mainly trace elements and petrographic features, clearly indicate worse climatic conditions for speleothem growth, with a less stable water supply than during the previous MIS 9 interglaciation. MIS 7 also had vegetation behavior quite different from MIS 9, as seen in pollen records (Urban, Reference Urban, Sirocko, Litt, Claussen and Sanchez-Goni2007; Sadori et al., Reference Sadori, Koutsodendris, Panagiotopoulos, Masi, Bertini, Combourieu-Nebout and Francke2016); the MIS 7 interglaciation was connected with very high forest variability, which was sometimes even interrupted by herbaceous expansions. On the other hand, despite the conditions of the relatively weak interglaciation, which are discussed more widely in Berger et al. (Reference Berger, Crucifix, Hodell, Mangili, McManus, Otto-Bliesner and Pol2015), the climate was warm and humid enough to enable speleothem growth in Poland; this is similar to findings from the Alps region, where long periods of speleothem growth during this period were also noted (e.g., Spötl and Mangini, Reference Spötl and Mangini2007; Spötl et al., Reference Spötl, Scholz and Mangini2008).
CONCLUSIONS
In comparison with those of other studied MIS 9–7 European speleothems, the record obtained from the Tatra Mountains speleothem is distinguished mainly by longer uninterrupted periods of growth covering the major part of MIS 9 and MIS 7, but also a by short episode in the MIS 8 glaciation.
The obtained paleoclimatic reconstruction implies that the best climatic conditions for speleothem growth under warm and wet conditions occurred during periods in MIS 9e and MIS 9c, and several short periods of unstable hydrological conditions and/or slightly reduced precipitation were also apparent. The first recorded hiatus at the MIS 9/MIS 8 transition was most likely connected with a reduction in precipitation. The reasons for the SC-3 growth stoppage in MIS 8 (H-2) cannot be unambiguously stated, but the obtained proxies indicate the occurrence of extreme hydrologic events in the Tatra Mountains, which could have caused a massive flushing of detritus and impaired speleothem growth.
The recorded phase of growth during the MIS 8 glaciation suggests that it was a relatively mild glaciation in the Tatra Mountains, with no strong influence of glaciers or freezing temperatures to prevent speleothem growth.
The obtained SC-3 record indicates worsened climatic conditions for speleothem growth during MIS 7, which was periodically drier and not as warm as MIS 9, yet still sufficient to sustain a long period of speleothem growth.
The comparison of the Tatra Mountains records with other European records revealed similarities, which suggests that the climatic variability recorded in the speleothems from the Tatra Mountains can be linked to extraregional climatic changes during both interglacial and glacial periods. The almost simultaneous climatic shifts observed in the SC-3 record during MIS 9 indicate that the climate in the Tatra Mountains could also have been influenced by the Mediterranean climate. On the other hand, the revealed differences, especially in MIS 8 and MIS 7, between our record and the Mediterranean records suggest the dominant role of the Atlantic climate in the Tatra Mountains, similar to its role in western Europe or the northern Alps.
This work provides the northernmost paleoclimatic record for the whole Carpathian range and one of the very few records from those periods worldwide. The results of this work also further affirm that speleothems are fundamental tools for understanding paleoclimate and show great potential for such studies in the middle Pleistocene, especially in central Europe, which is poorly represented in such studies.
ACKNOWLEDGMENTS
The study was supported by the National Science Centre, Poland (grants 2016/23/N/ST10/00067 and 2016/21/B/ST10/01483) and by the institutional support RVO 67985831 of the Institute of Geology of the Czech Academy of Sciences, Prague. We also would like to thank Marek Szczerba and colleagues from Clay Minerals Laboratory of the Institute of Geological Sciences, Polish Academy of Sciences, for the XRD analyses of the SC-3 stalagmite.
SUPPLEMENTARY MATERIAL
The supplementary material for this article can be found at https://doi.org/10.1017/qua.2020.69