1. Introduction
The Australian maternal health care system is a mixed public and privately funded system. Public patients are funded by the government through Medicare, a universal health insurance scheme, which provides free hospital treatment to these patients. All Australian residents and some categories of non-residents are entitled to Medicare benefits (Medicare Australia, 2016). In this paper, we use an actuarial approach to identify the risk factors associated with maternal hospital costs of public patients in Australia with a focus on women who experience adverse birth outcomes. Hospital costs relate to costs incurred when a patient is admitted to a hospital, and the latest published figures that break-down expenditure in maternity services by type of services show that 92% of expenditure is for hospital services (Bryant, Reference Bryant2008). Out-of-hospital services such as general practitioner visits are not included under the costs considered in this paper, but these costs are considered in a companion paper by the same authors (William et al., Reference William, Chojenta, Martin and Loxton2017). There is a paucity of research into the health system costs specific to women who experience adverse births, hence the focus of this paper. Note, however, that we do not consider infant costs, although these have been studied elsewhere (Petrou & Khan, Reference Petrou and Khan2012). The few studies that have reported on maternal costs suggest that the costs are significant and need to be addressed (Chollet et al., Reference Chollet, Newman and Sumner1996; Gilbert et al., Reference Gilbert, Nesbitt and Danielsen2003; Petrou & Khan, Reference Petrou and Khan2012; Gold et al., Reference Gold, Sen and Xu2013; Mistry et al., Reference Mistry, Heazell, Vincent and Roberts2013). To date, however, no such studies have been conducted with Australian data.
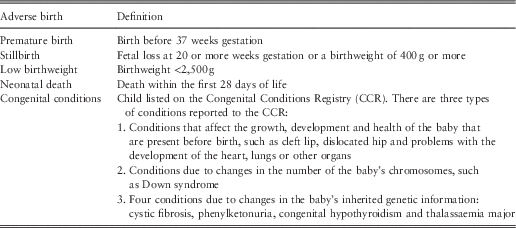
Within this study, adverse birth outcomes are defined as premature birth, low birthweight, congenital conditions, stillbirth and neonatal death, with the definitions of each of these shown in Table 1. In Australia in 2014, the rates of premature births, low birthweight and perinatal deaths (stillbirths and neonatal deaths combined) were 9%, 6%Footnote 1 and 1%, respectively (Eldridge & Sedgwick, Reference Eldridge and Sedgwick2016). A number of biologically based studies investigating such outcomes found that the rate of stillbirths in Australia has remained relatively unchanged over the last 20 years, while only small improvements have been made in reducing the rates of low birthweight and premature births (Measey et al., Reference Measey, Charles, d’Espaignet, Harrison, Deklerk and Douglass2007; O’Leary et al., Reference Odendaal, Steyn, Elliott and Burd2007). These trends have not only been observed in Australia. The World Health Organisation (WHO) found that premature births were on the rise in most countries and reflect the leading cause of death for newborns, accounting for 35% of all neonatal deaths (Howson et al., Reference Howson, Kinney and Lawn2012) making this a global public health problem.
Table 1 Definition of adverse births.
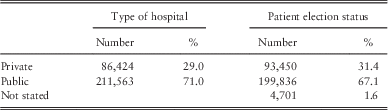
The main procedure that gives rise to expenditure in this area is the actual delivery of a baby in a hospital. In Australia, almost all births occur in hospitals and the latest figures (from 2012) show that 96.9% of births occurred in hospital (Hilder et al., Reference Hilder, Zhichao, Parker, Jahan and Chambers2014). Further, the majority of women giving birth in hospitals do so as public patients in public hospitals, and Table 2 gives relevant figures for 2012 for Australia for hospital births only (Hilder et al., Reference Hilder, Zhichao, Parker, Jahan and Chambers2014). We note that this table shows that there is a group of patients that elect to be treated as private patients in public hospitals, but these patients are excluded from this analysis as the financial terms of their treatment – and hence the public system component of their costs – will vary from public patients, as they are not covered under Medicare in the same way as public patients. We also note that the government funds some maternity services provided out-of-hospital through Medicare but this cost component is a relatively small proportion of total government expenditure on maternal health (Bryant, Reference Bryant2008) and is excluded in this analysis. Maternity services utilised out-of-hospital occur largely during the antenatal and postnatal periods, while maternity services utilised in hospital occur largely during the delivery period. These three periods (antenatal, delivery and postnatal) are defined in more detail in the next section.
Table 2 Hospital sector and patient election status in 2012 (AIHW, 2014).
As the focus of this paper is exclusively on public patients, we do not address costs associated with private patients. However, we do consider whether or not a patient has private health insurance, as under the Australian maternal health care system, these patients are still entitled to use public services as public patients. The financial terms for these patients who elect to receive treatment as public patients do not differ to those for public patients who do not have private health insurance – both groups are entitled to free (to them) hospital treatment under Medicare. Conversely, the financial terms and entitlements under Medicare differ for private patients and they are also likely to have private health insurance to fund part of their care, however, private patients are excluded from this analysis.
Previous research into maternal health system costs has found that the mean maternal per-patient hospital cost of a premature birth was substantially higher than that of a full-term birth (Chollet et al., Reference Chollet, Newman and Sumner1996; Luke et al., Reference Luke, Bigger, Leurgans and Sietsema1996; Gilbert et al., Reference Gilbert, Nesbitt and Danielsen2003; Ringborg et al., Reference Ringborg, Berg, Norman, Westgren and Jonsson2006). Chollet et al. (Reference Chollet, Newman and Sumner1996) found that even births that occurred just before full term have a mean maternal per-patient cost substantially higher (over 50%) than for a full-term birth, and both Gilbert et al. (Reference Gilbert, Nesbitt and Danielsen2003) and Luke et al. (Reference Luke, Bigger, Leurgans and Sietsema1996) show the cost differentials increase with more prematurity. Gold et al. (Reference Gold, Sen and Xu2013) also found the mean maternal hospital costs of stillbirths to be significantly higher than for live births during the delivery period, and this study was the only one to consider modelling costs within a multivariate regression framework (i.e. a regression framework that takes into account multiple covariates). Our research expands on these studies in a fully multivariate context by considering over 200 covariates from survey and administrative data, as well as other categories of adverse birth, over the complete perinatal period to provide a comprehensive study of the risk factors associated with maternal hospital costs. The perinatal period in this study commences at the start of pregnancy and concludes at the end of the first year following the birth of the baby and is defined in detail in section 2. Furthermore, a two-phase modelling methodology is proposed, based on actuarial and statistical principles.
2. Data and Methods
2.1. Data
The data used for this study are drawn from the Australian Longitudinal Study on Women’s Health (ALSWH) and administrative data sets linked with the survey data. The ALSWH is a national longitudinal survey of over 57,000 women in four age cohorts (born 1989–1995, 1973–1978, 1946–1951 and 1921–1926). Participants have been completing self-reported surveys on physical and mental health, socio-demographic and lifestyle measures, and utilisation of health services on about a 3-yearly basis since 1996. For this study, data from the 1973–1978 cohort is used, as they represent the group of women who have had the most recent births in sufficient numbers to allow for analyses to be undertaken (N=14,247). In order to determine detailed information about births and health service utilisation, administrative data are also required. The Centre for Health Record Linkage (CHeReL) used probabilistic data linkage principles to link all available data for women residing in New South Wales (NSW) in the 1973–1978 cohort (N=2,688 with 5,670 babies) with the following administrative data sets: the NSW Perinatal Data Collection (PDC) (1996–2012), The NSW Admitted Patient Data Collection (APDC) (2000–2013), Congenital Conditions Registry (CCR) (2000–2009), Perinatal Death Review (PDR) (2000–2009), Australian Bureau of Statistics (ABS) Register of Births, Deaths and Marriages (1997–2007) and ABS Mortality Data (Deaths only) (1997–2004). These data sets combined provide the required information on births (including adverse births) and hospital records to derive the maternal cost information. Of key importance is the PDC and the APDC as they provide the birth records and hospital episodes of care, respectively. The PDC is a population-based surveillance system covering all births in NSW public and private hospitals, as well as homebirths (CHeReL, 2015), and reporting of all births in NSW to the PDC is a statutory requirement. The APDC is administered by the NSW Ministry of Health and the data contain records of all inpatient separations (discharges, transfers and deaths) in NSW (CHeReL, 2015). In addition, the ALSWH survey data also provide a vast array of factors about the women that can be used as covariates in the cost models to yield a comprehensive data set for the purpose of understanding maternal hospital cost risk factors.
2.1.1. Data cleaning
We adopt the general principles of data cleaning from general insurance cost modelling for this study. The unit of analysis (or “exposure”) is a baby, as this provides a good representation of the underlying measure of risk of the maternal cost during the perinatal period. Therefore, the response variable of interest is the “maternal cost per baby” and the data set is aggregated to one record per baby to facilitate capture and subsequent modelling of the response variable. While some women had more than one baby over the study period, covariate values for each record (baby) are assigned using attributes closest to the time of the birth of the baby associated with that record.
In order to create the required data set, a number of steps are taken to clean and link the data. Individual data sets were provided to the research team with a unique identifier for each participant across all data sets. APDC and PDC records are linked with the unique identifier for each woman, however, linking of dates of birth and corresponding dates of hospitalisations is also required in order to attach hospitalisations to the correct baby and time period. Survey data are then attached to each mother–baby combination by matching the date of birth from the PDC to the closest matching date of survey return. The mother–baby record is omitted from the data if the ALSWH survey date are more than 4 years from the baby’s date of birth, because the survey information is deemed to be less representative of the actual characteristics of the woman at the time of birth. The cut-off of 4 years is selected as it represents a maximal survey cycle and ~16% of records are removed for this reason. We also remove records that do not have any hospitalisations due to the APDC data set only being available from the year 2000 (17%), records with incomplete perinatal periods (4%); multiple births (2%); and errors from the CHeReL data linkage (<0.1%). Multiple births are excluded because these births display different complexities to single births, reflect a much smaller cohort of women, and warrant a separate investigation. Finally, all records that relate to public patients (51%) are selected to create the final resultant data set of 1,743 babies (from 1,083 women) over the years 2001–2012. For the purpose of this study, a public patient is defined as a woman who has opted to be treated only as a public patient during the complete perinatal period, and thus women who have opted to be either private or public patients during the perinatal period are excluded.
2.1.2. Perinatal periods
The data are also segmented so that three distinct parts of the perinatal period can be studied separately as it is likely the cost risk factors vary by the sub-periods. The three sub-periods are the antenatal, delivery and postnatal periods and each are defined as follows:
2.1.2.1. Antenatal period
This period reflects the pregnancy period and captures specific costs associated with antenatal services. This period is estimated using gestational age and the baby’s date of birth. Specifically, it commences on the baby’s date of birth less the gestational age of the baby and concludes on the 11th day prior to the baby’s date of birth.
2.1.2.2. Delivery period
This period reflects the days leading up to labour and the delivery event itself, and captures specific costs associated with labour and delivery services. This period commences 10 days prior to the baby’s date of birth and ends on the baby’s date of birth. The period of 10 days leading up to the delivery date is selected to yield an approximation of possible costs that may be incurred as the woman gets closer to going into labour and subsequently giving birth.
2.1.2.3. Postnatal period
This period reflects the time after the woman has given birth and the cost associated with postnatal services. This period starts on the day after the baby’s date of birth and ends 365 days later. The 1-year period was selected to give a medium-term view of the cost drivers.
We include all hospitalisations of the women in the data set over the perinatal periods defined above.
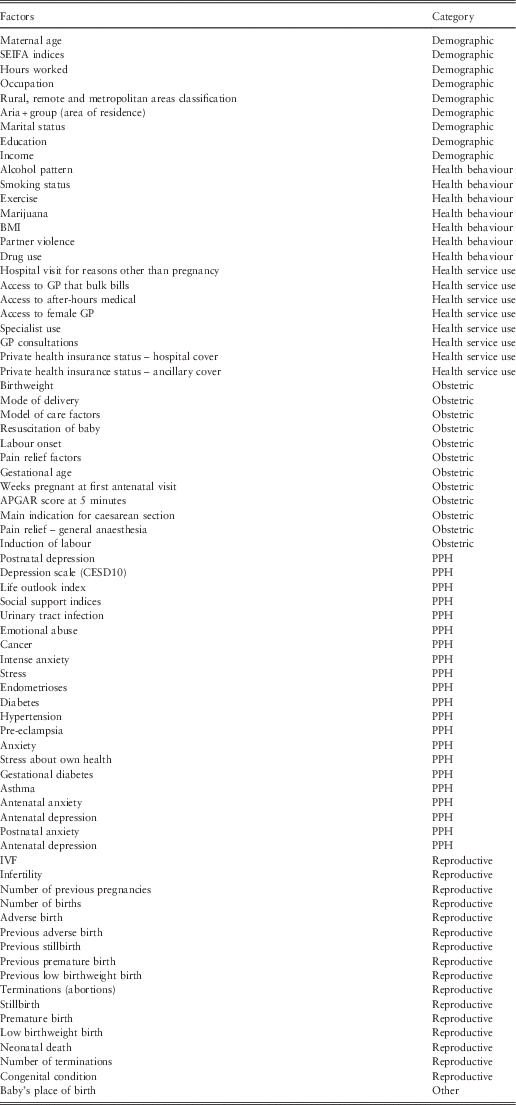
2.1.3. Covariates
Over 200 factors are available to be included as covariates in the multivariate cost models. These covariates are broadly grouped into six categories: health service use, obstetric factors, reproductive factors, demographic factors, health behaviours and psychosocial and physical health factors.
2.1.3.1. Health service use
Factors taken from the ALSWH surveys include frequency of general practitioner consultations, specialist use and whether the woman had private health insurance. The APDC provides information on public or private patient status for the birth of the child.
2.1.3.2. Obstetric factors
These factors are available from the PDC and include items regarding the specific details of the labour and delivery period. Key factors include items such as mode of delivery, pain relief and labour onset. Factors relating to the health of the baby are also available from the PDC and include items such as gestational age, birthweight and whether the baby was resuscitated or required neonatal intensive care.
2.1.3.3. Reproductive factors
These factors are largely available from the PDC and ALSWH surveys and give information on the reproductive history of the woman. Key factors taken from the PDC are adverse birth and previous adverse birth. The ALSWH survey provides information on infertility and in-vitro fertilisation (IVF); APGAR does not have an expansion, rather it is a test for newborn babies and named after the doctor that invented it; Center for Epidemiologic Studies Depression Scale 10 (CESD10) IVF use. The CCR, PDR and ABS data provide information on the congenital condition and death categories of adverse births.
2.1.3.4. Demographic factors
Numerous demographic factors are available from the PDC, APDC and ALSWH. Many are related to area of hospital (from PDC and APDC), and ALSWH also contains key factors such as area of residence, socio-economic indices for areas, education, income, occupation and marital status.
2.1.3.5. Health behaviours
These factors are available from ALSWH surveys and key factors include smoking status, alcohol use, drug use, body mass index and exercise indices.
2.1.3.6. Psychological and physical health factors
Psychological factors are available from ALSWH surveys and key factors are stress about own health, anxiety, postnatal depression and intense anxiety. For physical health factors, the ALSWH also contains information on various important physical health factors such as diabetes, asthma and hypertension. Hypertension, pre-eclampsia and diabetes are also recorded in the PDC.
2.2. Methods
Statistical techniques employed in this study use principles from actuarial modelling of insurance costs, particularly the use of multiple linear regression (Frees et al., Reference Frees, Jin and Lin2013). The multivariate approach to modelling health costs has been used previously in other health costing analyses (Johar et al., Reference Johar, Jones and Savage2012; Ellis et al., Reference Ellis, Fiebig, Johar, Jones and Savage2013; Frees et al., Reference Frees, Jin and Lin2013) but there are no such applications in the area of maternal health costs. Further, as there is such a vast number of factors available to include in the cost modelling in our study, a two-phase modelling approach is used to ensure a robust selection of factors. The first includes Classification and Regression Trees (CARTs) exploratory modelling and a qualitative literature review on risk factors of adverse birth outcomes. The purpose of this phase is to ensure all available factors are taken into account while simultaneously identifying the most important factors for inclusion in the second phase of modelling, the “formal parametric modelling” phase. Generalised linear model (GLM) and generalised linear mixed model (GLMM) are employed in this phase and provide a formal modelling setting within which the statistical significance of available covariates is assessed. These two phases are discussed in more detail below.
2.2.1. Phase 1: exploratory analysis
CART modelling is a popular statistical method for “tree-based” regression and classification. The principle behind tree-based methods is to partition (or “split”) the covariate space into a set of regions and fit simple models for the response variable within each region. A single variable is selected to perform the split based on a criterion regarding “best fit” for each region (Ripley, Reference Ripley1996; Venables & Ripley, Reference Venables and Ripley2002). The splitting criterion in our setting is based on minimising the sum of squares (Thernau & Atkinson, Reference Thernau and Atkinson2015). In terms of how large to grow a tree (or in other words, how many splits to do on the covariate space) there is a balance required between the tendency for larger trees to overfit the data and the inability of smaller trees to capture important features of the data. Therefore, the tree size may be considered a complexity parameter and the optimal tree size balances fit against complexity. The usual method used to optimise trees is called “cost-complexity pruning”, a process in which a large tree is grown, stopping the splitting process only when some minimum node size is reached and then pruned so that the subtree (or pruned tree) minimises the cost-complexity criterion which selects the complexity parameter to achieve a trade-off between tree size and goodness of fit to the data (Ripley, Reference Ripley1996; Venables & Ripley, Reference Venables and Ripley2002).
In our study, CART is used as an exploratory method to narrow down the number of factors to be tested in the GLM as it is infeasible to include all available factors within the GLM model selection framework directly because there are too many covariates for the models to converge successfully. For this reason, within the exploratory CART analysis we allow considerable flexibility in growing large trees so that more factors can be tested in the GLMs. Notwithstanding these observations, CART models can reveal interesting structure, particularly in terms of interactions between variables, as CART models allow for the same variable to contribute at each level in the fitted tree structure, and so complex, non-linear structures can be well approximated.
2.2.2. Phase 2: formal parametric modelling
GLMs have been applied in actuarial work for decades and there are numerous literature that describe the benefits of this technique (Brockman & Wright, Reference Brockman and Wright1992; Haberman & Renshaw, Reference Haberman and Renshaw1996; de Jong & Heller, Reference Declercq, Luke, Belanoff, Cabral, Diop, Gopal, Hoang, Kotelchuck, Stern and Hornstein2008; Frees et al., Reference Frees, Jin and Lin2013). An extension to the standard GLM approach is to consider mixed effects models, which is less common in actuarial work but the theory of which is described in Venables & Ripley (Reference Venables and Ripley2002). These models offer a flexible framework by which to model the sources of variation and correlation that arise from grouped data (which, e.g. can arise if data collection is undertaken in a hierarchical manner). The ability to include some covariates as random effects (as opposed to purely fixed effects seen in standard GLMs), assumes these covariates fluctuate randomly over units in the population and so the effect is modelled in terms of the parameters of that distribution rather than estimating a separate coefficient for every level of the random covariate factor. In terms of model selection techniques, in the formal parametric modelling phase we test factors of importance from the regression tree analysis by each sub-period (starting with the sub-period of the particular model we are fitting) and then test factors identified in the literature review. An initial analysis of the distribution of costs suggest that costs have a strongly skewed distribution, supporting a flexible, non-normal model for the underlying error structure – a number of options are available amongst “standard” generalised liner modelling approaches, including Poisson, Gamma and Negative Binomial families with the canonical log link function. The use of Poisson and Gamma GLMs is somewhat more convenient for fitting purposes, and given that diagnostics for the models fit do not particularly favour one choice over the other, we use these GLMs with a log link function. The basis for selection of variables within the model selection process is the usual Akaike information criterion (AIC) for assessing model fit (AIC is a likelihood-based fit criterion that penalises for model size to achieve reasonable fit without over-fitting) within a forward stepwise selection procedure. Details of the model selection are omitted for brevity but are contained in William (Reference William2016).
The costs in this study are modelled separately by frequency and severity as is common practice in general insurance cost modelling (Brockman & Wright, Reference Brockman and Wright1992; Haberman & Renshaw, Reference Haberman and Renshaw1996; de Jong & Heller, Reference Declercq, Luke, Belanoff, Cabral, Diop, Gopal, Hoang, Kotelchuck, Stern and Hornstein2008; Frees et al., Reference Frees, Jin and Lin2013). The “frequency” is defined in terms of the number of services used by the woman for each baby and the “severity” is the average cost of the services used by the woman for each baby. In insurance settings, this separation is important due to frequency and severity of claims having different underlying drivers and the same principle may apply in health costing as the frequency of service usage and the average cost of services used could have different underlying drivers. For example, a woman who has had a previous adverse birth may be advised to be monitored more frequently during a following pregnancy, and may therefore use more health services, but the services themselves may not be more costly than those used for an uncomplicated pregnancy. Thus, in this case the woman would have a high frequency of service utilisation but the average costs of the services used may not differ from those for other women. We also consider modelling “large” costs separately as is common practice in insurance cost modelling, but there are no instances of women with particularly large costs that require such separate treatment in this particular data set. Moreover, there are numerous other parallels between insurance claims cost modelling and health cost modelling including: the typical positive skewness of the cost distributions; inflationary effects in the cost data; and the need to consider numerous potential risk factors to identify the key drivers of the cost and understand the true impact they each have.
2.2.3. Definition of maternal cost (Australian Refined Diagnosis Related Group (AR-DRG))
The AR-DRG is a patient classification system used for hospital costing in Australia and abroad (Ringborg et al., Reference Ringborg, Berg, Norman, Westgren and Jonsson2006; Johar et al., Reference Johar, Jones and Savage2012; Ellis et al., Reference Ellis, Fiebig, Johar, Jones and Savage2013). The AR-DRG system is based on hierarchies of diagnoses and procedures that relate the number and types of patients treated in a hospital to the resources required by the hospital, and hence relates directly to cost. One of the outputs of the AR-DRG system is cost-weight tables which assign a cost-weight and Australian dollar hospital cost for each AR-DRG code. The system is revised on a regular basis using the most recent data available for both public and private hospitals. An AR-DRG code is assigned to every patient’s episode of care in the APDC data set. For the purposes of our study, these codes and corresponding cost information are used to calculate the hospital costs of the sample of women in the data for all episodes of care during the perinatal period. We use the National AR-DRG tables for this study because the APDC data set included AR-DRG codes assigned using the codes in the National tables. The National table also differentiates between public and private hospitals when providing cost information (and the NSW state-based table does not). Note that while our study considers public patients only, they may also visit private hospitals, so private hospital AR-DRG tables are also used for costing purposes for these patients. However, this feature only represents 1% of the patients in this data set. Costs are also inflated to 2015–2016 values using an inflation rate of 3% p.a. which is consistent with the inflation rate applied by the Independent Hospital Pricing Authority when deriving the 2015–2016 AR-DRG cost tables (Independent Hospital Pricing Authority, 2015).
3. Results
The following sections describe the results of the exploratory analysis phase (section 3.1) as well as the formal parametric modelling phase (section 3.2).
3.1. Phase 1: exploratory analysis
Initially, maternal health care costs over the observation period are examined. Table 3 summarises the data by adverse births and related hospital costs and shows that overall average maternal hospital costs are 25% higher for women who have experienced an adverse birth outcome, compared to women who have not experienced an adverse birth outcome. The cost differentials (herein referred to as “cost differentials”) are highest in the antenatal and delivery periods, however, relatively low overall costs occur within the antenatal and postnatal periods as the delivery period represents over 80% of the total maternal hospital cost. One clear outlier is identified due to a woman who had many hospitalisations for psychiatric care and cost of $193,832 and this record is consequently regarded as an outlier and removed from analysis. The next largest cost is $67,961 and the overall average cost is $8,574 per baby.
Table 3 Average maternal hospital costs by perinatal period (2015–2016 $AUD values).
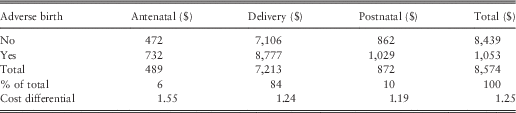
Figure 1 shows the average hospital costs per year. A gently increasing trend in the cost over time is observed for non-adverse births although with slight dips in some years. The trend in costs of adverse births is relatively stable with a possible increase over the most recent years; although, given the relatively low numbers of adverse births, the cost data for this category is more volatile. Importantly for this research, the costs of adverse births are higher than for non-adverse births across all years. Several potential reasons are explored for increasing trends in costs. The first is the notable rise in the proportion of caesarean deliveries over time (and correspondingly an offsetting decrease in the proportion of vaginal deliveries).
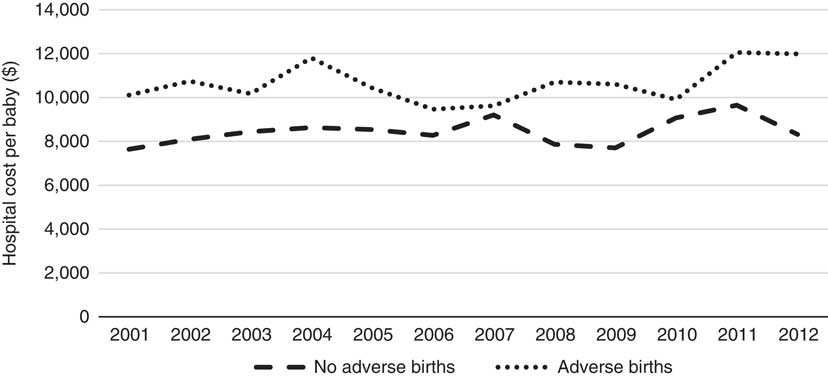
Figure 1 Hospital cost per baby per year (2001–2012).
Figure 2 shows the trends in mode of delivery over time. As caesarean deliveries cost substantially more than vaginal deliveries, this “change in the mix” by mode of delivery over time has driven some of the increase in overall cost. While the reasons for increasing caesarean deliveries are still not well known (Australian Institute of Health and Welfare, 2014), higher maternal age and increased artificial reproductive technology (ART) are likely to be contributing factors (Australian Institute of Health and Welfare, 2014, 2016). Also, there is a notable issue with ALSWH survey data representing a cohort of women that age over time so any time-trend analysis must also account for this ageing effect. For this reason, these trends may not be indicative of overall population trends but rather of temporal cohort effects. However, these factors (age and year) will be considered in more detail in the formal parametric phase of the modelling as it is not possible to properly understand the complex inter-relationships that exist using simple low-dimensional multi-way tables or graphs.
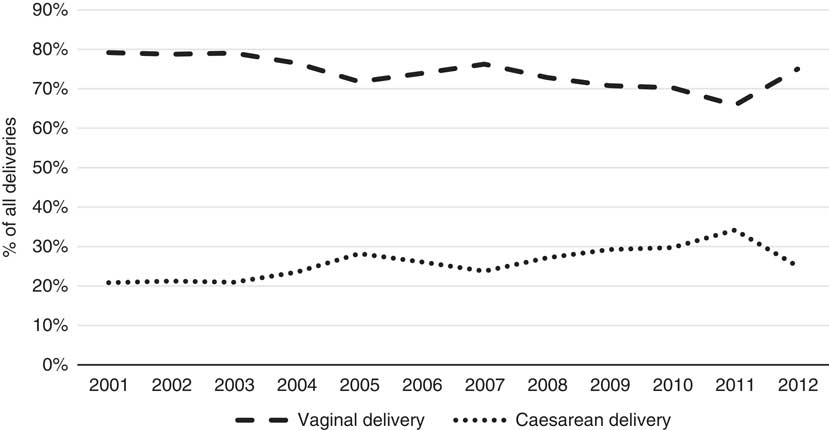
Figure 2 Mode of delivery by year (2001–2012).
There is also an interesting change in the trend in 2012 and a reduction in the proportion of caesarean deliveries in this year. Relatively fewer data were available for this particular year compared with previous years, so this effect could be an anomaly, but it may also be as a result of initiatives in NSW to reduce the rates of caesarean deliveries (NSW Ministry of Health, 2010). This trend is not observed in the overall national results (Australian Institute of Health and Welfare, 2016) but the national results are not split by state or type of patient over time.
3.1.1. CARTs
Regression tree models are fit relating costs during each period to all covariates available for modelling. As described earlier, the regression trees are used as a tool for selecting factors for onward formal parametric modelling so there is considerable flexibility allowed in growing the trees, perhaps beyond their optimal size. Therefore, summarised versions of the trees are presented graphically here for each period. The figures shown within each node of the tree represent the predicted cost for the group at each respective node.
3.1.1.1. Antenatal period
There are relatively few data points contributing to most splits of the antenatal regression tree model (Figure 3), making them difficult to interpret because of the variability in fit that is often encountered in regression tree modelling, particularly when data are sparse. Notwithstanding this problem, the first split of the antenatal regression tree relates to pre-eclampsia which is a condition in pregnancy characterised by high blood pressure, with the model predicting the cost of cases involving pre-eclampsia to be more than double the cost of cases for which there is no pre-eclampsia. The following split for women who do not have pre-eclampsia is based on their body mass index (BMI) and shows that those who are underweight (i.e. with low BMI) have higher predicted costs than those with higher BMI’s. Of course, this result – while interesting – needs to be interpreted with caution given the issue with data sparsity noted above.
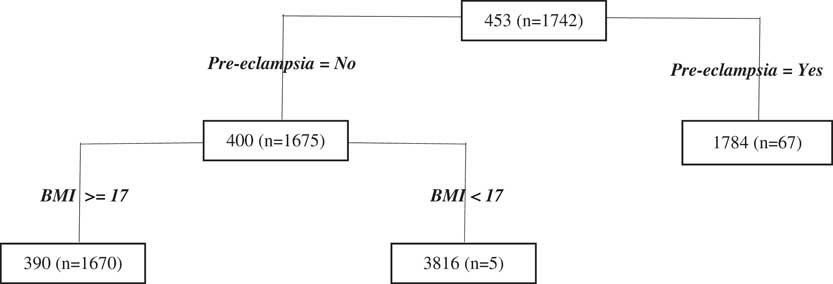
Figure 3 Antenatal period Classification and Regression Tree results. BMI, body mass index.
3.1.1.2. Delivery period
For delivery costs (Figure 4), we observe that mode of delivery is, unsurprisingly, the most important cost predictor, reflecting the first split of the tree. As stated previously, this split makes sense as caesareans are considerably more costly than vaginal deliveries. The next split relates to the birthweight of the baby and this split is only applied to the node of the caesarean sub-branch of the tree. The cut-off chosen by the regression tree algorithm for the continuous variable birthweight is 2.4 kg, just under the cut-off typically used to define low birthweight (2.5 kg) in the context of declaring an adverse birth event. The results show that the predicted cost is indeed higher for women who have experienced this type of adverse birth.
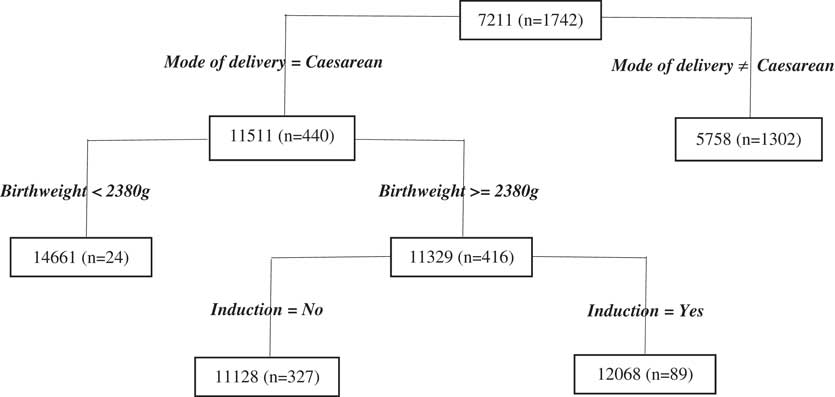
Figure 4 Delivery period Classification and Regression Tree results.
3.1.1.3. Postnatal period
As for the antenatal period, we find there is very little data contributing to the postnatal regression tree model for most splits with the only notable split is the first one, regarding cancer, however, there is limited data in the node for women who have cancer so even this result should be interpreted with caution (Figure 5).
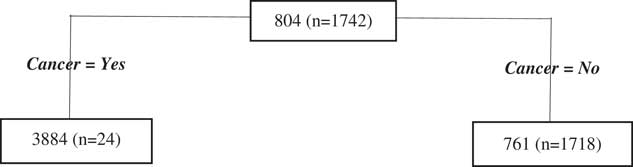
Figure 5 Postnatal period Classification and Regression Tree results.
3.1.2. Qualitative literature review
We also undertake a review of the literature on risk factors of adverse births outcomes to select other potential candidate covariates. These factors relate to the broad groups previously defined; that is: demographics such as maternal age (Bateman & Simpson, Reference Bateman and Simpson2006; Delbaere et al., Reference Delbaere, Verstraelen, Goetgeluk, Martens, De Backer and Temmerman2007; Battin et al., Reference Battin and Sadler2010), socio-economic status, education and area (Goy et al., Reference Goy, Dodds, Rosenberg and King2008; Morgen et al., Reference Morgen, Bjork, Andersen, Mortensen and Andersen2008; Petersen et al., Reference Petersen, Mortensen, Morgen, Madsen, Schnor, Arntzen, Gissler, Cnattingius and Andersen2009); reproductive history including previous adverse births (Surkan et al., Reference Surkan, Stephansson, Dickman and Cnattingius2004; Reddy, Reference Reddy2007; Bhattacharya et al., Reference Bhattacharya, Townend, Shetty, Campbell and Bhattacharya2008; Esplin et al., Reference Esplin, O’Brien, Fraser, Kerber, Clark, Simonsen, Hollngren, Mineau and Varner2008; Smith et al., Reference Smith, Pell and Dobbie2003), caesarean deliveries (Häger et al., Reference Häger, Daltveit, Hofoss, Nilsen, Kolaas, Øian and Henriksen2004; MacDorman et al., Reference MacDorman, Menacker and Declercq2008) and ART (D’Angelo et al., Reference D’Angelo, Whitehead, Helms, Barfield and Ahluwalia2011; Sauber-Schatz et al., Reference Sauber-Schatz, Sappenfield, Grigorescu, Kulkarni, Zhang, Salihu, Rubin, Kirby, Jamieson and Macaluso2012; Declercq et al., Reference de Jong and Heller2015; Dunietz et al., Reference Dunietz, Holzman, McKane, Li, Boulet, Todem, Kissin, Copeland, Bernson, Sappenfield and Diamond2015); health behaviours including smoking (Olsen et al., Reference Olsen, Pereira and Olsen1991; Odendaal et al., Reference O’Leary, Bower, Knuiman and Stanley2008; Adams et al., Reference Adams, Melvin, Raskind-Hood, Joski and Galactionova2011; Flenady et al., Reference Flenady, Koopmans, Middleton, Frøen, Smith, Gibbons, Coory, Gordon, Ellwood, McIntyre, Fretts and Ezzati2011), alcohol use (McDonald et al., Reference McDonald, Armstrong and Sloan1992; Kesmodel et al., Reference Kesmodel, Wisborg, Olsen, Henriksen and Secher2002; Odendaal et al., Reference O’Leary, Bower, Knuiman and Stanley2008), exercise (Frederick et al., Reference Frederick, Williams, Sales, Martin and Killien2008), obesity and BMI (Chu et al., Reference Chu, Kim, Lau, Schmid, Dietz, Callaghan and Curtis2007; Hauger et al., Reference Hauger, Gibbons, Vik and Belizan2008; Flenady et al., Reference Flenady, Koopmans, Middleton, Frøen, Smith, Gibbons, Coory, Gordon, Ellwood, McIntyre, Fretts and Ezzati2011); psychological and physical health including mental health (Hedegaard, Reference Hedegaard2002; Alder et al., Reference Alder, Fink, Bitzer, Hosli and Holzgreve2007; Wisborg et al., Reference Wisborg, Barklin, Hedegaard and Henriksen2008), diabetes (Cheng et al., Reference Cheng, Chung, Kurbisch-Block, Inturrisi, Shafer and Caughey2008; Flenady et al., Reference Flenady, Koopmans, Middleton, Frøen, Smith, Gibbons, Coory, Gordon, Ellwood, McIntyre, Fretts and Ezzati2011), asthma (Evans et al., Reference Evans, Palta, Sadek, Weinstein and Peters1998) and hypertension (Thame et al., Reference Thame, Osmond, Wilks, Bennett, McFarlane-Anderson and Forrester2000; Flenady et al., Reference Flenady, Koopmans, Middleton, Frøen, Smith, Gibbons, Coory, Gordon, Ellwood, McIntyre, Fretts and Ezzati2011). These factors are included in the formal parametric testing phase regardless of whether they are selected in the regression trees or not.
All factors selected in the CART models for each sub-period and other relevant factors identified from the literature are included for testing in the formal parametric modelling phase. A complete list of factors selected for testing is shown in the Appendix.
3.2. Phase 2: formal parametric modelling
The CART models reported in Phase 1 provide valuable guidance as to an initial set of covariates to include as part of a model selection process for parametric models for cost. Using the initial factors selected in the CART models supplemented by those explicitly identified within the literature, two GLM for frequency and severity are fit, assuming a Poisson error distribution with log link and Gamma error distribution with log link, respectively. We report results with significance level <5%. We also consider all possible two-way interactions within the modelling but none are significant.
3.2.1. Antenatal period
Table 4 shows pre-eclampsia is the most significant factor for the antenatal period. It is also the first factor identified in the equivalent regression tree. Hypertension has similar characteristics from a health perspective to pre-eclampsia and is also significant in this model. The birthweight of the baby (which is a continuous factor) shows that the lower the birthweight, the higher the predicted cost, and this finding shows that low birthweight is the only category of adverse births that contributes to significant variation in cost during the antenatal period. Stress about own health is a self-rated mental health factor which is also fit as a continuous factor and shows that the more stress a woman feels about her health, the higher the predicted cost. Finally, number of terminations of pregnancy also significantly affects the predicted cost; with the higher the number of terminations, the greater the impact on the antenatal cost. Terminations of pregnancy refer here to abortions for both medical (e.g. foetal abnormalities) and other reasons. There are no significant factors within the severity model, showing that it is the number of services used in the antenatal period that drives the cost while the average cost of the services used are not significant in explaining the cost for this period. In other words, women who have higher antenatal costs tend to have more hospitalisations as opposed to more costly services when they are in hospital.
Table 4 Public antenatal frequency results.
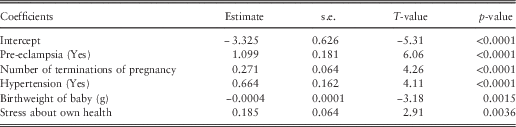
3.2.2. Delivery period
In contrast to the antenatal period, the frequency model is not significant in the delivery period and this is likely due to the short time-span of this period which usually only results in one hospitalisation for the actual delivery of the baby. Therefore, only the severity model is relevant. The place of birth of the baby is significant in the severity model and differentiates the cost between whether the baby is born in hospital or not, but as it is an obvious nuisance factor, models are refit with this factor as a random effect for parsimony – the resultant models fall into the class of GLMMs and the results are displayed in Table 5. Mode of delivery is a highly significant factor and also important in the equivalent regression tree. Private health insurance status, area and diabetes are also key drivers of the severity cost in this period. The significance of diabetes in particular is interesting as it shows that women with diabetes may not have more frequent hospitalisations in the delivery period, but when they are hospitalised the average cost of their services is high.
Table 5 Public delivery severity generalised linear mixed model results.
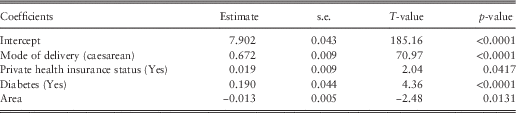
Given these observations and the importance of the delivery period to overall cost, we also investigate a model for the total hospital cost during the delivery period (i.e. a model for which the cost is not separated by frequency and severity). As there are no zero-cost observations for the delivery period, we use a Gamma GLM with log link, and results are reported at the 5% significance level in Table 6. Unsurprisingly, the results largely resemble the severity model described above, but a few additional significant factors emerge. Adverse births are a significant factor in this model and they are also identified in the equivalent regression tree through the birthweight factor. The other interesting significant factors are smoking status and labour onset. The base level of the labour onset factor is “Induction”, so the results show that “No labour” and “Spontaneous” labour have lower predicted costs when compared with “Induction”. The “No labour” level relates to caesarean delivery only and is a slightly offsetting factor to the mode of delivery (caesarean) factor. Area and smoking status are both fit as continuous factors and discussed in more detail in section 4.
Table 6 Public delivery generalised linear mixed model total results.

3.2.3. Postnatal period
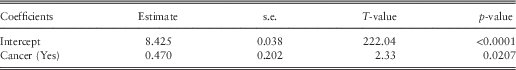
Cancer is the only factor significant in the postnatal frequency and severity model (Table 7) and is also identified in the equivalent regression tree. The results show that women with cancer are associated with higher postnatal hospital costs (Table 8).
Table 7 Public postnatal generalised linear model frequency results.
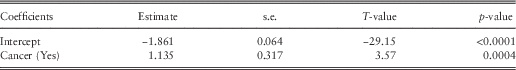
Table 8 Public postnatal generalised linear model severity results.
Many of the risk factors identified in the modelling are highly significant across all three sub-periods. It is important, however, to distinguish between statistical significance and practical significance, especially in a context where the large size of our data set may allow statistically significant effects to be detected even when the effect sizes may be relatively small. Therefore, we have also discussed the practical significance of these risk factors in section 4. Notwithstanding this observation, it should be noted that there are also a large number of factors that are not found to be statistically significant (these may be seen in the complete list of factors selected for testing in the Appendix). We note the importance of reflecting upon practical significance following statistical analyses – our results suggest that not only are the effects statistically significant but that the effect sizes are such that the results are of real practical importance as well.
4. Discussion
We focus our discussion on both statistical and practical significance of the cost risk factors, particularly in the delivery period as it reflects the dominant cost component of the perinatal period, representing over 80% of the total hospital cost. Nevertheless, there are also interesting features to discuss concerning the other periods, particularly the antenatal period, where the hospital costs are largely driven by conditions relating to high blood pressure, specifically pre-eclampsia and hypertension, which are well-known problems during pregnancy (Duley, Reference Duley2009) that may require hospitalisations. The results suggest that women with these conditions tend to have more hospitalisations but do not necessarily incur greater average costs for each hospitalisation. Low birthweight is also identified as a factor that impacts cost in this period and the modelling provides evidence that adverse births tend to impact hospital costs even prior to the delivery of the baby. For the postnatal period, cancer is reported as significant for both increased service utilisation and higher average costs of service, with the caveat that this finding is based on sparse data. It is also likely that complications following the birth of the baby may be captured in the hospitalisation that relates to the birth, and will therefore result in costs that fall into the delivery period rather than the postnatal period.
In the delivery period, frequency of service use is not relevant because there is usually only one hospitalisation in this period, for the actual delivery of the baby. Despite this, the total cost (and severity) model show that mode of delivery is clearly the dominant factor driving the cost; and this feature is also evidenced in the equivalent regression tree. This finding also makes sense intuitively due to the clear differences in the costs of caesareans versus vaginal deliveries within the Australian hospital system. Caesarean deliveries cost almost double the cost of vaginal deliveries, and represent an increasing proportion of all deliveries within the NSW (and, indeed, Australian) experience (Australian Institute of Health and Welfare, 2014, 2016) so they invariably have a significant impact on cost. These results show that it is likely that the noticeable increases in the rate of caesarean deliveries in recent years is the driver of the increases in maternal costs overall as highlighted in Figure 2. The underlying risk factors of caesareans are still not well known (Australian Institute of Health and Welfare, 2014) but are relevant here to the extent that they explain why a caesarean has occurred, with consequent impact on cost.
The link between adverse births and maternal health system costs is also evident in both the regression trees and GLM’s in the delivery period. This finding suggests that hospital costs of these women are related to the birth outcome of the baby but principally only at the time of delivery and during pregnancy as it is also significant in the antenatal model. This does not necessarily mean that women who have adverse births do not have different costs to other women in the postnatal period as a large part of the costs in this period is incurred through out-of-hospital services, which are not covered in this study.
Private health insurance status is significantly related to hospital costs, indicating that if a woman has private health insurance hospital cover the cost is higher than those without this protection. Note that in Australia, those with private health insurance can elect to be treated as private or public patients in public hospitals. As we have only included public patients in this study, this particular finding relates only to those patients with private health insurance that have elected to be treated as public patients. In other words, this finding suggests that women who are public patients with private health insurance have higher hospital costs in the delivery period compared with those without private health insurance. It is difficult to draw conclusions upon this finding as it has several complexities related to the interactions between the private and public health system in Australia and we consider this issue further in our current research. This result may indicate anti-selection of insurance, whereby those in poorer health are more likely to have health insurance; however, there are tax incentives in Australia designed to encourage high-income earners and young people to purchase private health insurance which could counteract this selection bias. This is also an important finding from a policy perspective as it shows that the complexities of a mixed public–private health system (with tax regimes encouraging private health insurance to certain demographics) to be key drivers of the cost differentials seen. We also consider private health insurance as a proxy for higher socio-economic status due to the tax incentives for higher earners to purchase the insurance. The separate study of public patients is not conducted in previous international research in maternal costs although these studies do fall under different health system structures so it may not be as relevant.
Induction of labour is a significant factor related to hospital costs, suggesting that spontaneous labour has slightly lower cost compared with induction. This finding intuitively makes sense because inductions usually involve more complex procedures and medications to help bring labour on in a woman who is not already in labour. The model also suggests that “No labour” has the lowest impact on overall cost but these cases all relate to caesarean deliveries – this means these two factors (induction and caesarean) should be considered together when assessing the combined impact on cost; that is, caesarean deliveries significantly increase costs but that is slightly offset by the induction factor. Of course, the combined impact remains a significant increase in costs.
Importantly, we have demonstrated that smoking status is positively associated with hospital costs, whereby the more a woman smokes, the higher the impact on cost. This finding is consistent with other literature that shows the adverse impact smoking has on birth outcomes (Olsen et al., Reference Olsen, Pereira and Olsen1991; Wisborg et al., Reference Wisborg, Kesmodel, Henriksen, Olsen and Secher2001; Hogberg & Cnattingius, Reference Hogberg and Cnattingius2007; Odendaal et al., Reference O’Leary, Bower, Knuiman and Stanley2008; Flenady et al., Reference Flenady, Koopmans, Middleton, Frøen, Smith, Gibbons, Coory, Gordon, Ellwood, McIntyre, Fretts and Ezzati2011) and it is reasonable to suggest that this behaviour will have a flow-on cost impact, particularly as adverse births are also a significant cost risk factors themselves. The diabetes factor referred to in this study relates to a pre-existing diabetes condition rather than gestational diabetes, and – as is the case for smoking – the relationship between diabetes and poor health outcomes during pregnancy is well documented (Cheng et al., Reference Cheng, Chung, Kurbisch-Block, Inturrisi, Shafer and Caughey2008; Flenady et al., Reference Flenady, Koopmans, Middleton, Frøen, Smith, Gibbons, Coory, Gordon, Ellwood, McIntyre, Fretts and Ezzati2011) so it is reasonable, again, to see that this factor too will have a cost impact. Interestingly, diabetes is also a highly significant factor within the severity model suggesting that the costs associated with women with diabetes are largely a result of the high average cost of the services they use.
Area of residence is fit as a continuous factor and largely differentiates by remoteness, with the coefficient suggesting that remote areas have lower costs than major cities. This is possibly an indication of reduced access – and therefore lower service use – in remote areas and less severe cases being seen in remote areas as more complex cases are likely to be referred to hospitals in metropolitan areas. In addition to our finding, a study by Powers et al. (Reference Powers, Loxton, O’Mara, Chojenta and Ebert2013) that considers birth intervention rates by area using ALSWH data concludes that care provided to labouring women may differ by area of residence. They explain that this difference may be due to both lack of choice of maternity services (such as availability of certain types of interventions) and differing expectations of women by area of residence, leading to differences in birth interventions between metropolitan versus non-metropolitan areas.
There are fundamental differences between our study and previous studies not only in terms of scope but also in terms of data availability and extent and methodology, so there are few direct comparisons that can be made. Critically, previous studies do not consider the vast number of covariates that are available in this study. It is also important to highlight the paucity of research in the area of maternal hospital cost risk factors, making our study the first of its kind in Australia and the first that applies these types of statistical and actuarial techniques. Notwithstanding these differences, our results broadly agree with previous research in that maternal hospital costs for women with adverse birth outcomes tend to be higher than those without adverse birth outcomes (Chollet et al., Reference Chollet, Newman and Sumner1996; Luke et al., Reference Luke, Bigger, Leurgans and Sietsema1996; Gilbert et al., Reference Gilbert, Nesbitt and Danielsen2003; Ringborg et al., Reference Ringborg, Berg, Norman, Westgren and Jonsson2006; Petrou & Khan, Reference Petrou and Khan2012; Gold et al., Reference Gold, Sen and Xu2013; Mistry et al., Reference Mistry, Heazell, Vincent and Roberts2013). We are also able to show that adverse births are a statistically significant cost risk factor (even in the presence of other cost risk factors) for public patients in the antenatal and delivery periods. The predicted cost differentials for the delivery period, at 8%, are also lower than the simple mean cost differentials, at 25%, as other cost risk factors also contribute to explaining the variation in cost. This highlights the importance of considering the cost in a fully multivariate context as this approach enables a more nuanced understanding of the marginal impact of each risk factor on cost given the impacts of other factors. Conversely, this finding also shows that adverse births are not a significant cost risk factor in the postnatal period, albeit noting the limitation of sparse cost data in this period.
The diverse selection and subsequent statistical significance of numerous cost risk factors provides a strong evidence base to inform policy in this area. As discussed earlier, the statistical significance of private health insurance status suggests that the government’s policies on private health insurance will impact quite significantly on maternal hospital costs and the complexity of the mixed public–private system is an issue whose impact on cost needs further study. For the other cost risk factors, most of which are medically indicated, there is a need for collaboration with medical practitioners and public health experts to understand broader social and health perspectives more fully before appropriate policy can be formulated. In particular, further research is required to understand the relationships between these cost risk factors, policy interventions and the health outcomes of women. For example, we have demonstrated that caesarean deliveries have the most significant impact on cost, but careful consideration needs to be given to the risk factors of caesarean deliveries and for which segments of women reducing caesarean deliveries will produce better health outcomes for them and their infants. As noted earlier, these risk factors are currently not well understood despite increases in caesarean deliveries being observed widely across Organisation for Economic Co-operation and Development (OECD) countries (OECD, 2015; Australian Institute of Health and Welfare, 2016), although a number of trends including higher maternal ages and increased ART rates are likely to be contributing factors (Australian Institute of Health and Welfare, 2014). Interestingly, however, these two factors are not identified in our modelling as significant from a hospital cost perspective. Furthermore as this is a global issue, WHO have released a statement that states that every effort should be made to provide caesarean deliveries to women in need, rather than striving to achieve a specific rate (WHO, 2015). Similarly for the other cost risk factors such as smoking status, diabetes and labour onset, further research is required to identify how policy can improve the health outcomes for women that are affected in a cost-effective manner. Smoking during pregnancy is a good example of where there is already considerable research that explores interventions (Lumley et al., Reference Lumley, Chamberlain, Dowswell, Oliver, Oakley and Watson2009; Stotts et al., Reference Stotts, Groff, Velasquez, Benjamin-Garner, Green, Carbonari and DiClemente2009; Stead & Lancaster, Reference Stead and Lancaster2012; Hajek et al., Reference Hajek, Stead, West, Jarvis, Hartmann-Boyce and Lancaster2013; Cahill et al., Reference Cahill, Hartmann-Boyce and Perera2015) and our research provides more evidence to show that it is indeed an important risk factor to consider from a cost perspective as well. In summary, these results highlight areas where resources are currently used, and further work is necessary to understand whether this is indeed an appropriate resource allocation or whether resources could be more effectively and efficiently diverted elsewhere. Cost-effectiveness is important as it relates to ensuring the outcomes of women and children are not compromised due to resource allocation decisions – this is also evidenced in the policy statement by WHO for caesarean delivery.
The major limitation of this study compared to previous international studies is the relative scarcity of data for the antenatal and postnatal periods, especially when compared to the studies that consider data collected nationally on all births and corresponding hospital records (Gilbert et al., Reference Gilbert, Nesbitt and Danielsen2003; Ringborg et al., Reference Ringborg, Berg, Norman, Westgren and Jonsson2006). However, these other studies have been unable to capture and model the effects of key covariates in the detail studied here as such detailed data on a broad range of covariates are not typically collected at the national level (e.g. the data collected on smoking status are typically not reliable in administrative data sets such as the APDC). The other possible limitation with the data set utilised in this study is the reliability of the ALSWH self-report questions such as the mental health items. Validation for these items is hard to conduct, but they have been broadly compared to previous research where possible, and they fall within expected ranges, lending credence to the validity of self-report items used (Chojenta, Reference Chojenta2013; ALSWH, 2014).
5. Conclusion
In this paper, we employ traditional actuarial and modern statistical techniques to identify maternal hospital cost risk factors for public patients. This novel approach uses a two-phase modelling methodology including regression trees and GLM’s which prove useful to ensure the breadth of factors available in a large data set are assessed and selected in a robust manner. We find that there are numerous significant cost risk factors within the delivery period, most notably mode of delivery and adverse births, noting particularly that this period accounts for over 80% of the hospital cost incurred. In contrast, there is little to note in terms of significant cost risk factors in each of the antenatal and postnatal periods and this is likely due to costs incurred in these two periods arising more from out-of-hospital services rather than in-hospital services. We also highlight how the statistically significant cost risk factors can be considered further from a public policy standpoint.
This study is the first time actuarial techniques have been applied to maternal hospital costs in Australia, and thus this work is an important example of how actuarial skills are transferrable from traditional areas of actuarial work to non-traditional areas. Many key principles from insurance costing have been utilised in this study, including: the use of exposure as a measure of risk; the use of numerous risk factors to explain cost drivers; inflationary considerations of cost over different time periods; segmentation of costs into different sub-periods; consideration of large costs; and separate analysis of frequency and severity of costs. This study shows that these types of actuarial techniques which have been used in insurance costing for decades are successfully transferrable to other disciplines – such knowledge translation offers insights that have previously been unavailable in research on maternal hospital costs. Additionally, the use of the results to inform public policy using a substantive evidence base with a focus on risks and collaboration with other professionals is an example of how actuaries can take advantage of their multidisciplinary skill-set in a public policy setting. This research brings together elements of numerous disciplines and applies a holistic approach to provide important insights into maternal health policy.
There are some key areas to consider for further research. First, a study of the maternal hospital costs for private patients would help in understanding differences between relevant cost drivers under the public and private hospital systems, respectively. Such a comparison would also provide further insights into the mixed public–private maternal health system which can be used to inform policy. Second, while hospital costs represent the vast majority of the expenditure on maternity services, many services are also provided out-of-hospital (particularly during the antenatal and postnatal period) and a similar actuarial investigation is recommended for this part of the health system too. This will provide a comprehensive picture of the cost drivers of the entire maternal health system during the perinatal period and ensure an integrated approach to formulating policy initiatives. Finally, collaboration with other disciplines, particularly medical practitioners and public health experts, is necessary to formulate evidence-based policy based on the results of this work.
Acknowledgements
The research on which this paper is based was conducted as part of the ALSWH on Women’s Health by the University of Queensland and the University of Newcastle. The authors are grateful to the Australian Government Department of Health for funding and to the women who provided the survey data. The authors also thank the NSW Ministry of Health and staff at the CHeReL.
Appendix
Table A.1 Factors tested in formal parametric models.