


Policy decisions concerning reimbursement of drugs have crucially important implications for access to medical treatments for patients. For this reason, the available evidence on clinical and cost effectiveness of drugs should be carefully considered and synthesized when reimbursement decisions are made. This task is frequently hampered, due to the fact that the available evidence is incomplete or inconsistent. Also, the evidence may originate from multiple, heterogeneous sources, including randomized controlled trials, cohort studies, record reviews, registries, laboratory studies, and clinical and patients’ experiences. Clearly, identification and appraisal of the relevant evidence base, analysis and synthesis of the data, and presentation of the results in a format that is transparent and understandable to relative lay persons (i.e., members of appraisal committees) poses a formidable challenge. What would be needed are ways for analyzing and presenting the available data so that clear answers can be given to relevant policy issues, taking into account the limitations that are inherent to the data.
It has often been suggested that for this task, a Bayesian approach to data analysis and inference may have important advantages over the standard frequentist methods (e.g., Reference Spiegelhalter, Abrams and Myles1–Reference Allmark7). There are two main reasons for this. First, a Bayesian approach offers a natural way for combining evidence from different sources in a systematic and transparent way, even when dealing with heterogeneous sources of evidence. In Bayesian statistics, unlike in frequentist statistics, it is very common to consider the new information that is gathered from an experiment together with the information that was available before the experiment. The Bayesian approach offers a formal model for combining prior information with newly available information, so that previously held judgments are updated. Second, Bayesian statistics has important conceptual advantages over frequentist statistics, making the outcomes easier to interpret and understand for people without much knowledge of statistics.
Despite these potential advantages, the Bayesian approach is relatively unfamiliar and relatively little used in the context of synthesizing evidence to support policy decisions.
To illustrate the above claims about the advantages of Bayesian methods for policy making, we performed a Bayesian reanalysis of an actual reimbursement advice that was drafted in 2008 by the National Health Insurance Board of the Netherlands (College voor Zorgverzekeringen, CVZ), and we compared the outcomes obtained from the Bayesian reanalysis with the original results. In this study, we will mainly focus on the first of the above two proposed advantages, synthesizing evidence from heterogeneous sources in one Bayesian analysis. For a more clear illustration of the second alleged advantage of Bayesian methods, see Woertman et al. (Reference Woertman, Vermeulen and Groenewoud8).
THE CASE OF EXENATIDE
In 2008, CVZ advised the Dutch Minister of Health about the reimbursement of the drug exenatide. Exenatide (which is marketed as Byetta) is a drug for patients with diabetes mellitus type 2 (DM-II), and could be beneficial for patients who fail to achieve adequate glycemic control, despite taking the oral drugs metformin and sulfonylurea. For such patients, it was standard practice to additionally prescribe insulin. However, insulin generally results in weight gain (exacerbating the diabetic condition) and an increased probability of sustaining hypoglycemic episodes. Moreover, it has the advantage of inducing weight loss (9). Therefore, exenatide might be a better option.
CVZ has issued two advices on exenatide (10;11). In the first advice, CVZ advised not to reimburse this drug, because it was deemed to have no additional value compared with insulin (10). This was challenged by the manufacturer, claiming that exenatide could at least be beneficial for obese patients (BMI ≥ 30 kg/m2) (11). After a reassessment, CVZ advised to add exenatide to the benefit package for patients with DM-II who have a BMI ≥ 35 kg/m2 and inadequate glycemic control, despite taking metformin and sulfonylurea.
METHODS
Bayesian analyses work with three main building blocks: the prior, the likelihood, and the posterior (Reference Spiegelhalter, Abrams and Myles1). The prior distribution is a probability distribution that expresses the uncertainty about the parameter of interest that exists before the new data from an experiment or study is seen or considered. All the new information from the experiment or study is condensed in the likelihood function. This likelihood function expresses how likely the different values of the parameter of interest are, given the observed data. The posterior distribution combines the information contained in the prior and likelihood, and expresses the uncertainty that is present about the parameter of interest, given the observed data. In a Bayesian analysis, all conclusions are based on the posterior distribution.
We performed a Bayesian analysis for three of the (intermediate) clinical endpoints that were considered in the CVZ advice: the HbA1c level, fasting serum glucose levels and body weight. For each of these parameters, prior distributions were elicited from clinicians. These clinical priors represent subjective probability estimates, and may be based on biological plausibility and the strength and relevance of previous evidence (Reference Spiegelhalter, Abrams and Myles1).
For each of the endpoints, a posterior distribution for the treatment difference (between exenatide and insulin) was obtained.
Elicitation of Clinical Prior Probabilities
For the elicitation of clinical prior probabilities, a questionnaire was presented to clinicians at Radboud University Nijmegen Medical Centre, specialized in diabetology. This questionnaire contained a patient description (a vignette) of a DM-II patient comparable to patients who were enrolled in the relevant clinical trials. Clinicians were asked about the change from baseline after 1 year of using either insulin (Treat to Target) or exenatide (10 μg twice daily) on change of %HbA1c, change of fasting serum glucose and weight change. For each of the endpoints, means and 2.5th and 97.5th percentiles were elicited, which were consequently averaged over all respondents (Reference Spiegelhalter, Abrams and Myles1). Prior probability distributions were fitted to these averages, assuming normality.
THE BAYESIAN ANALYSIS
For each of the clinical endpoints a Bayesian analysis was performed, combining clinical priors with data from RCTs that were deemed relevant by CVZ. These RCT data entail direct randomized comparisons between exenatide and insulin, as well as data from placebo controlled trials for exenatide and data from controlled trials that compare different types of insulin. To make the most efficient use of all the available evidence, we combined all of the available data for each of the endpoints in a single Bayesian analysis (Figure 1).
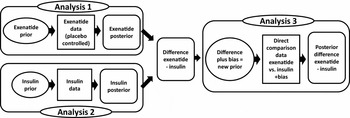
Figure 1. Overview of how the available data were combined into a single, comprehensive analysis, including both direct comparison data (analysis 3) and observational data (analyses 1 and 2).
All of our three outcome variables are continuous, and we used normally distributed likelihoods and normally distributed prior distributions. The WinBUGS code for the HbA1c analysis is shown in Supplementary Figure 1, which can be viewed online at http://dx.doi.org/10.1017/S0266462314000385, for the other two endpoints the WinBUGS code is similar.
First, the clinical prior for exenatide was combined with the data from the placebo controlled exenatide studies to obtain a posterior distribution for the effect (difference from baseline) of exenatide separately (analysis 1). Then, the same was done for insulin, obtaining a posterior distribution for the effect (difference from baseline) of insulin separately (analysis 2). Subsequently, these two posterior distributions were subtracted to obtain a posterior distribution for the difference in effectiveness between exenatide and insulin. This posterior was then used as the prior distribution in the final analysis (analysis 3), where it was combined with the data from the direct comparison studies to obtain a final posterior distribution for the difference between exenatide and insulin. This procedure was followed for each of the three endpoints separately.
Because there was heterogeneity between the studies, we used a random effects model in each of the three analyses from Figure 1. However, because of the limited numbers of studies, the variances of the random effect terms are very difficult to estimate. Instead, we assumed that all three random effect terms has a standard deviation of σ = 0.20.
Furthermore, the evidence from the direct comparison studies may be considered more directly relevant than the combined evidence from the other (placebo) controlled studies. Moreover, because the indirect evidence came from trials that compared exenatide and insulin with different comparators, we could only use the exenatide and insulin arms from these studies. Therefore, this evidence should essentially be seen as observational, and it is possible that this indirect evidence is biased. We accounted for this by explicitly modeling a bias term (Reference Spiegelhalter, Abrams and Myles1;Reference Eddy12;Reference Eddy, Hasselblad and Shachter13). That is, in our analysis the difference between exenatide and insulin that was obtained from the observational data (analyses 1 and 2) were subjected to a (nonsystematic) bias term, before it was used as the prior in analysis 3 where it was combined with the direct comparison data. For the bias term of the observational data, we used normal distributions with mean zero and standard deviations of σb = 0.33.
Bayesian analyses result in posterior distributions that express how likely certain parameter values are. These posterior distributions will be depicted and summarized in terms of means and Bayesian (equal-tail) 95 percent credible intervals (i.e., 2.5 percent and 97.5 percent percentiles of the posterior distribution).
All Bayesian analyses were carried out using WinBUGS 1.4. For the MCMC procedures we took 50,000 iterations with 10,000 for burn-in. We checked that the MCMC procedures had reached convergence by visually inspecting the history trace plots and cumulative quantile plots and by checking that autocorrelation between lagged iterations was not present.
Sensitivity Analyses
Finally, several one-way sensitivity analyses were performed to investigate the impact of certain modeling assumptions on the final posterior distribution. The impact of the clinical prior on the posterior distribution was investigated by using a noninformative prior distribution (Reference Spiegelhalter, Abrams and Myles1) (a normal distribution with a variance of 1000) instead. Second, the impact of the standard deviation of the bias term σb was investigated by changing it to σb = 0 (so that no bias is present and the observational data is simply pooled with the experimental data) and σb = 10 (essentially disregarding the observational data). We did the same for the standard deviation of the random effects σ, changing it to zero (reducing the model to a fixed effect model) and to 0.33 (thereby making it as large as σb).
Presentation and Inquiry at the National Health Insurance Board
A meeting was organized at CVZ to present the results of our reanalysis of the exenatide case, and to explore how participants judged the usefulness of a Bayesian approach to data analysis. The participants were staff of the Pharmaceutical Advisory Committee and Board members of CVZ, both policy advisors and policy makers. First, basic ideas and concepts of Bayesian statistics were presented, as well as the main differences with frequentist statistics. Then the original (frequentist) results and the results of the Bayesian reanalysis of the exenatide case were presented. After the presentation, participants were asked to fill out a brief questionnaire (anonymously). The participants were asked to answer some knowledge questions about both Bayesian and frequentist statistics, checking whether their understanding and interpretation of the presented outcomes was correct. Moreover, the questionnaire included two open questions about the main advantages and disadvantages of a Bayesian approach and seven multiple choice questions. These questions consisted of three pairs of questions, (i) to what extent they thought that Bayesian/frequentist outcomes are easy to understand and interpret, (ii) to what extent a Bayesian/frequentist approach is suitable for the informational needs of policy makers, and (iii) whether in practice a Bayesian approach would have important advantages/disadvantages. A final question asked whether in their opinion a Bayesian approach, in combination with frequentist techniques, could have an added value in a policy context.
RESULTS
The Clinical Prior
Eight clinicians from the Department of General Internal Medicine, section Diabetology, of the Radboud University Nijmegen Medical Centre filled out the questionnaire.
The means, 2.5 percent and 97.5 percent percentiles for the resulting priors are shown in Table 1. This shows that clinicians expected small differences with respect to reductions in HbA1c, and that insulin would result in a somewhat larger decrease in fasting plasma glucose levels than exenatide. They expected a substantial difference between exenatide and insulin regarding weight change: exenatide would lead to weight loss and insulin would result in weight gain.
Table 1. The Model Input: Clinical Priors and the Original Frequentist Results
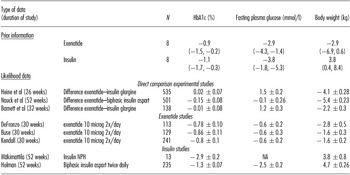
Note. Priors elicited from clinicians for each of the three endpoints for both insulin and exenatide separately. Displayed are the means, and in parentheses the 2.5 percentiles and 97.5 percentiles of the prior distributions for the change from baseline, when averaged over the respondents. N denotes the number of respondents.
The likelihood data for the studies that were included in the CVZ guidance. Means and standard errors are provided. For the direct comparison studies, positive numbers mean that the decrease due to exenatide is smaller than the decrease due to insulin. N denotes the number of patients in the Intention To Treat (ITT) exenatide group, NA means not available.
The Original, Frequentist Results
In the CVZ advice, eight studies relating to the therapeutic value of exenatide as compared to insulin were included. Among these studies there were three direct comparison RCTs for exenatide versus insulin (Reference Barnett, Burger and Johns14–Reference Nauck, Duran and Kim16). These studies were double-blind randomized studies that used the same dosage for exenatide and similar exclusion criteria. However, there were some differences between these studies, mainly in terms of the length of follow-up (26 to 52 weeks), co-medication (metformin and/or sulfonylurea), and in the exact type of insulin (insulin glargine or insulin aspart). Furthermore, there were three placebo controlled studies for exenatide (Reference Buse, Henry and Han17–Reference Kendall, Riddle and Rosenstock19) and two controlled studies that compared different kinds of insulin (Reference Holman, Thorne and Farmer20;Reference Makimattila, Nikkila and Yki-Jarvinen21). Among these groups of studies, there was some heterogeneity as well.
For each of these RCTs, the treatment differences on all of the three clinical endpoints are displayed in table 1 in terms of point estimates and 95 percent confidence intervals (resulting from frequentist analyses). The key conclusions that were drawn in the CVZ advice from the results of the direct comparison trials were: the change of %HbA1c level with exenatide was not inferior to insulin; reduction of the fasting plasma glucose level was significantly greater with insulin; reduction of body weight was significantly greater with exenatide.
Results of the Bayesian Analysis
For each of the three endpoints, the posterior distribution for the difference between exenatide and insulin is depicted in Figure 2. The results of the Bayesian analyses are displayed in Table 2. For each of the endpoints and each of the analyses we present a mean and a (Bayesian equal-tail) 95 percent credible interval for the posterior distribution on the treatment difference between exenatide and insulin. Furthermore, for each posterior distribution the probability of a clinically relevant difference is displayed. For these clinically relevant differences, we used the following criteria: a difference of 0.4 percent for the HbA1c level, a difference of 1.0 mmol/l for fasting plasma glucose, and a difference of 2.3 kg for body weight.
Table 2. The Model Output: Results of the Bayesian Analysis

Note. Means and 95% credible intervals of the posterior distributions for the difference between exenatide and insulin in the change from baseline values. P(CRD) denotes the probabilities to reach a clinically relevant difference of: 0.4% for %HbA1c, 1.0 mmol/L for fasting plasma glucose; and 2.3 kg for body weight.
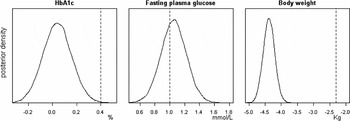
Figure 2. Posterior density plots for the difference between exenatide and insulin for each of the three endpoints. The vertical lines depict the clinically relevant differences. It can be seen that the probability that the difference in HbA1c levels exceeds 0.4 is virtually zero, that the probability that the difference in fasting plasma glucose exceeds 1 is approximately 0.62, and that the probability that the difference in weight loss is at least 2.3 is 1.
The results show that (i) the differences between insulin and exenatide on the HbA1c level are very small, (ii) the reduction of the fasting plasma glucose level is greater for insulin (positive numbers mean that insulin is superior in lowering these levels), and (iii) the reduction of body weight is much greater for exenatide. The table also shows that the probability of a clinically relevant difference for the change of HbA1c level is virtually zero, that the probability for clinically relevant weight change is approximately 1 (favoring exenatide), and that the probability of a clinically relevant difference for fasting plasma glucose is approximately 0.6 (favoring insulin) in the base case.
The results from the sensitivity analyses were fairly similar. Clinical priors had only marginal influence on the posterior distributions, as the results were very similar when adopting a noninformative prior. Changing the spread of the bias term σb from 0,33 to 0 (eliminating the bias term, so that the observational data are pooled with the RCT data) and to 10 (thereby effectively disregarding all observational data altogether) did have an effect on the outcomes of the posterior estimation. Although these changes do not seem to be very important in an absolute sense, the probability of a clinically relevant difference for fasting plasma glucose levels was sensitive to the size of σb, varying from 0.33 to 0.85. Similarly, we changed the standard deviation of the random effect term σ from 0.2 of the base case to 0 (reducing the model to a fixed effect model) and to 0.33 (thereby making it as large as the base case σb). Although the widths of the credible intervals are more sensitive to σ than to σb, the reverse is true for the point estimates and the probabilities of clinically relevant differences. Thus, changing σ mainly changed the uncertainty around the point estimates, whereas changing σb changed the uncertainty around the estimates from the observational data only, and, therefore, also change the weighting of the observational evidence versus the experimental evidence. In general, except for fasting plasma glucose levels (in particular for the probability of a clinically relevant difference), the conclusions were fairly robust to modeling assumptions.
The key conclusions that were drawn in the CVZ advice (based on the frequentist results of the direct comparison trials) still hold: the change of %HbA1c level with exenatide is not inferior to insulin; reduction of the fasting plasma glucose level is greater with insulin; reduction of body weight is substantially greater with exenatide.
Questionnaire Results
Seven participants of the meeting held at CVZ filled out the questionnaire. The respondents were fairly neutral with respect to the difference between Bayesian and frequentist methods in terms of understanding and interpretation, and in terms of meeting the informational requirements of policy makers. As for meeting the informational needs of policy makers, two respondents indicated an advantage of Bayesian methods over frequentist methods, one respondent indicated a disadvantage for Bayesian methods, the other four were neutral. As for ease of understanding and interpretation, two respondents favored frequentist methods, and the other five were neutral. It is interesting to note, however, that this seems to be in contrast with the answers to the knowledge questions related to interpretation of results of Bayesian and frequentist analyses. Frequentist concepts and outcomes were interpreted incorrectly more often than their Bayesian counterparts, and frequentist concepts were sometimes mistakenly given a Bayesian interpretation. Two respondents indicated that in practice, Bayesian statistics has important advantages, and three respondents indicated that Bayesian statistics has important practical disadvantages. For the most important disadvantages of a Bayesian approach, respondents mentioned “unfamiliarity with Bayesian methods,” “a lack of expertise regarding Bayesian methods at CVZ,” and the fact that “virtually all the evidence that we work with is frequentist.” As the most important advantages of Bayesian methods, respondents mentioned “to update existing knowledge” and “to incorporate the results and the corresponding uncertainties from several types of studies into one final result.” As for our final question, whether Bayesian statistics would have an added value in a policy context when combined with frequentist statistics, six out of seven respondents indicated they agreed, the seventh respondent was neutral about this statement.
DISCUSSION
The reanalysis of CVZ's exenatide advice shows that the outcomes of the Bayesian approach and the standard frequentist outcomes lead to comparable conclusions regarding the relative merits and demerits of exenatide and insulin in the treatment of patients with DM2. However, we wish to emphasize the methodological differences between the two approaches. What the exenatide case does illustrate is that a Bayesian approach indeed allows for synthesizing different types of data (clinical prior opinion, data from experimental studies and essentially observational data) in a formal and transparent way into a combined estimate of posterior probabilities. Frequentist statistics offers less flexibility for dealing with data from heterogeneous sources.
Moreover, in terms of transparency and intelligibility another important difference can be seen, namely that the Bayesian approach offers posterior probabilities that directly express the uncertainty that exists with respect to treatment differences on specific endpoints. Unlike a frequentist 95 percent confidence interval, a Bayesian 95 percent credible interval actually means that there is a 95 percent probability that the true parameter value lies within the credible interval (Reference Spiegelhalter, Abrams and Myles1;Reference Woertman, Vermeulen and Groenewoud8). Moreover, the Bayesian approach allows for estimating the probability to reach a clinically important difference. This would not have been possible in a frequentist framework. After all, the frequentist concept of the p-value gives an estimate of the probability of obtaining an outcome equal to or more extreme than the observed outcome, under the null hypothesis of no effect. This p-value, however, does not provide a direct statement about how unlikely the null hypothesis in fact is, nor how likely any alternative hypothesis.
Arguably, however, this is precisely the sort of statement that the various stakeholders would like to be able to make: what is the probability that intervention x will produce an outcome y (or larger), given the observed results z? Bayesian analyses do produce such probabilities. Therefore, when used as a supplement to the standard frequentist results, perhaps Bayesian statistics could aid policy makers in comprehending and assessing what the data have to say about the questions that are most relevant to the problems they face.
Our analysis has several limitations. First, our analysis is based on surrogate outcomes only, and clinically it would be more informative to have analyses on final outcomes instead. However, because this is a reanalysis and the original CVZ advice considers these endpoints only, so do we. This will allow us to consider the differences between the two methods. Moreover, the main point of this work is about methodology, and to this end these intermediate endpoints suffice.
Second, for the determination of the prior probabilities, we used estimates from internists of a single university-based hospital. Clearly, this sample need not be representative of all diabetologists. However, the sensitivity analysis demonstrated that the results of our analysis were very insensitive to the priors used.
Third, in analyses 1 and 2 (see Figure 1), we only used the data from the exenatide and insulin arms of the respective studies; we could not use the data from the other arms of the studies. If all of these studies had a common comparator (e.g., placebo), this would have given indirect comparisons between exenatide and insulin by means of placebo. In that case, we would have been able to use mixed treatment comparison models (Reference Lu and Ades22). However, with the studies mentioned in the CVZ advice this was not possible.
Therefore, the data from the single arms that we used in analyses 2 and 3 should in fact be seen as observational data, such as historical controls. This is in fact how we treated these data, similarly to in Spiegelhalter et al. (Reference Spiegelhalter, Abrams and Myles1) and Sutton and Abrams (Reference Sutton and Abrams6), and we included bias terms in our model like in Eddy et al. (Reference Eddy12;Reference Eddy, Hasselblad and Shachter13).
Fourth, the value that we use for the standard deviation of the random effect terms σ is quite arbitrary, and the same holds for the standard deviation σb of the bias term that we used in our analyses to correct for bias. However, we performed several sensitivity analyses investigating the impact of these assumptions on the outcomes, which showed that they did have some influence on the outcomes of the posterior distribution, but that overall, the results were fairly robust.
Finally, the group of staff and board members at CVZ who filled out our questionnaire was small, and can hardly be considered to lead to conclusive arguments. Moreover, most participants knew almost nothing about Bayesian statistics and after our short meeting we noticed that many misunderstandings remained. Therefore, this part of our study could be considered as a pilot study, and clearly more work is needed here.
CONCLUSIONS
The results from the questionnaire filled out by the participants in our meeting with CVZ show that most participants were fairly neutral concerning the merits and demerits of frequentist and Bayesian analyses. In our discussion with CVZ staff, we observed that most participants seemed interested and had a mildly positive attitude toward Bayesian methods, but many of them saw substantial practical problems related to the use of Bayesian methods in their organization. These included lack of expertise among staff members at CVZ in this specific domain. Still, all but one respondent indicated they agreed that Bayesian statistics could have an added value in a policy context when combined with frequentist statistics.
We want to emphasize that we are not advocating a complete substitution of all frequentist methods by Bayesian methods. We see no reason why the two paradigms could not be used together, complementing each other. Still, currently there still are important practical barriers to the use of Bayesian methods in a policy context. Moreover, most policy makers are unfamiliar with the Bayesian setup, and as one of our participants in the CVZ meeting remarked: “the exact advantages of a Bayesian approach are difficult to grasp if you’re not familiar with the Bayesian setup”. And as anyone who was educated from a frequentist background and who later on became interested in Bayesian statistics knows, it takes some time before the Bayesian setup (and the exact differences with frequentist thinking) becomes clear. Therefore, perhaps more familiarization of prospective users of Bayesian methods and more research on the interface of science and policy would be worthwhile.
SUPPLEMENTARY MATERIAL
Supplementary Figure 1: http://dx.doi.org/10.1017/S0266462314000385
CONTACT INFORMATION
Willem Woertman, PhD (willem.woertman@radboudumc.nl), Rene Sluiter, MSc., Gert Jan van der Wilt, PhD., Department for Health Evidence, Radboud University Nijmegen Medical Centre, Geert Grooteplein 21, P.O. Box 9101, 6500HB Nijmegen, The Netherlands
CONFLICTS OF INTEREST
There are no potential conflicts of interest.


