


NOMENCLATURE
- A
-
model constant defined in Lefebvre's model for LBO
- ARFZ
-
area of reverse flow zone
- AFR
-
Air to Fuel Ratio
- CDS
-
Component design stage
- CMC
-
Conditional moment closure
- Dp
-
initial mean drop size, micron
- Dp, crit
-
critical droplet diameter
- Dr
-
mean drop size relative to JP4
- dt
-
throat diameter of venturi, mm
- DPM
-
Discrete Phase Model
- FDF
-
Filtered density function
- FV-LBO
-
Flame Volume Based Lean Blowout Model
- ISL
-
inner shear layer
- K
-
model constant defined in FV model
- LBO
-
Lean Blowout
- LES
-
Large eddy simulation
- LHVr
-
lower calorific value relative to JP4
- LDI
-
Lean Direct Injection
- LPP
-
Lean Pre-mixed and Pre-vaporised
- f PZ
-
fraction of air entering the primary zone
- ma
-
total mass flow rate of combustor inlet, kg/s
- mf
-
mass flow rate of fuel, kg/s
- mpri
-
mass flow rate through primary swirler, kg/s
- msec
-
mass flow rate through secondary swirler, kg/s
- ORZ
-
Outer Recirculation Zone
- OSL
-
Outer Shear Layer
- P3
-
inlet pressure, Kpa
-
Probability Density Function
- qLBO
-
overall fuel/air ratio at lean blow-out, g/kg
- qLBO, predict
-
lean blowout predicted by empirical model, g/kg
- IRZ
-
Inner Recirculation Zone
- RFZ
-
Reverse Flow Zone
- r
-
correlation coefficient
- SDS
-
System design stage
- T3
-
inlet temperature of combustor, K
- Tcrit
-
threshold value of temperature, K
- Vc
-
combustor volume ahead of dilution holes, m3
- V f
-
flame volume, m3
- V f ,n
-
flame volume obtained by fuel concentration contour, m3
- α
-
fraction of dome air
- β
-
dimensionless flame volume defined as V f /Vc
- βf,n,c
-
dimensionless flame volume defined as Vf,n,c /Vc
- ρ
-
density, Kg/m3
- δ
-
angle of flare outlet, °
- λr
-
effective evaporation coefficient relative to JP4
- Δx
-
thickness, mm
- Z i
-
elementalk2 mass fraction of element, i
1.0 INTRODUCTION
Thermal NOx reduction has pushed the combustor technology towards a leaner combustion. The operation of combustors in the vicinity of lean limits has raised the significance of Lean Blowout (LBO) prediction more than ever. In fact, the blowout phenomenon is transient in nature and is affected by several operating, spray, fuel and geometric parameters. The presence of multiple parameters, their intricate interdependence and transient nature raise the challenges in prediction process. Nevertheless, several LBO prediction methodologies have been proposed over the last five decades that include semi-empirical, numerical, hybrid and Damköhler-based approaches. Each approach has its own limitations and advantages.
Semi-Empirical Correlations (SECs) are the simplest and the most economical method but they offer limited prediction accuracy. SEC presented by Lefebvre(Reference Ballal and Lefebvre1-Reference Ballal and Lefebvre3) and Ateshkadi(Reference Ateshkadi, McDonell and Samuelsen4) reported the average prediction error = ±30% that is mainly attributed to insufficient modelling depth to account for flow physics in primary combustion zone. On the other hand, numerical methods based on Large Eddy Simulation (LES)(Reference Smith, Nickolaus, Leach, Kiel and Garwick5-Reference Sturgess, Sloan, Lesmerises, Heneghan and Ballal10) can provide very detailed information about flow structures with high spatial and temporal resolutions. Recently, LES with Conditional moment closure (CMC)(Reference Tyliszczak, Cavaliere and Mastorakos8) and Filtered Density Functions (FDF)(Reference Ge, Cleary and Klimenko9) models have presented promising results for transient studies of reactive flows. But, these methods are limited to laboratory flames and become computationally intractable for real combustor geometries with high Reynolds numbers. Additionally, calibration and tuning of constants based on experimental data of prototype burners is required prior to their application on real combustors. Hence, currently LBO prediction based on the numerical approach does not meet the requirements of a preliminary design tool, and presumably it will take another couple of decades to develop for real gas turbine combustors. To compensate for this modelling deficiency in the SEC, aid from numerical simulations is utilised to incorporate the flow information; the methodology is called the hybrid approach. It was originally proposed by Sturgess( Reference Sturgess, Sloan, Lesmerises, Heneghan and Ballal 10 , Reference Sturgess and Shouse 11 ), and it can merge the advantages of both techniques: (1) simplicity and robustness from SECs and (2) thermodynamics and flow-field information from numerical simulation. Hence, it has an advantage over previous prediction methodologies and can better correlate global LBO stability with geometry configurations of primary combustion zone. The effectiveness of this methodology not only depends on the individual performance of SEC and numerical methods but also on their blending recipe. Previously, the hybrid methodology has been utilised(Reference Hu, Huang and Wang12-Reference Hu, Zhao and Xu14) for LBO predictions. Owing to the limitation of existing methodologies, the aviation industry has to rely on experimentation, which for certain reasons cannot commence prior to the development stage. Review of limitations, advantages and performance of each approach shows the need for an LBO prediction tool which must also fulfil the requirements of the Component Design Stage (CDS). Moreover, it should be robust, reliable and accurate for quick design iteration.
The Lefebvre LBO correlation, as shown in Equation (1), is the most comprehensive SEC that includes separate terms for geometry, operating conditions and atomisation. It has been validated on several combustors but the prediction accuracy is limited i.e., ±30. It has been proposed previously(Reference Ahmed and Huang15) that lower prediction accuracy is mainly ascribed to insufficient modelling in the 1st term of Equation (1) i.e., the geometric term
 $[ {\frac{{{ A^{}}{ f_{PZ}}}}{{{V}_c^{}}}} ]$
. This term does not offer sufficient mathematical representation of the flow physics that actually prevail in the primary combustion zone.
$[ {\frac{{{ A^{}}{ f_{PZ}}}}{{{V}_c^{}}}} ]$
. This term does not offer sufficient mathematical representation of the flow physics that actually prevail in the primary combustion zone.
 $$\begin{equation}
\begin{array}{@{}l@{}} {{q}_{{\rm LBO}}} \propto \underline {\left[ {\frac{{{{A}^{}}{{f}_{{PZ}}}}}{{{V}_{c}^{}}}} \right]{\rm{\ }}} \quad \underline {\left[ {\frac{{{m}_{A}^{}}}{{{P}_3^{\left( {1.3} \right)}{\exp}\left( {{\raise0.7ex\hbox{${{{T}_3}}$} \!
/ \!\lower0.7ex\hbox{${300}$}}} \right)}}} \right]} {\rm{\ }}\quad \underline {\left[ {\frac{{{D}_{r}^2}}{{{{\lambda }_{r}}{{H}_{r}}}}} \right]} \\[22pt] \quad \quad \quad {1^{{\rm{st}}}}{\rm{Term}}\quad \quad {2^{{\rm{nd}}}}{\rm{Term}}\quad \quad \quad {3^{{\rm{rd}}}}{\rm{Term}} \end{array}
\end{equation}$$
$$\begin{equation}
\begin{array}{@{}l@{}} {{q}_{{\rm LBO}}} \propto \underline {\left[ {\frac{{{{A}^{}}{{f}_{{PZ}}}}}{{{V}_{c}^{}}}} \right]{\rm{\ }}} \quad \underline {\left[ {\frac{{{m}_{A}^{}}}{{{P}_3^{\left( {1.3} \right)}{\exp}\left( {{\raise0.7ex\hbox{${{{T}_3}}$} \!
/ \!\lower0.7ex\hbox{${300}$}}} \right)}}} \right]} {\rm{\ }}\quad \underline {\left[ {\frac{{{D}_{r}^2}}{{{{\lambda }_{r}}{{H}_{r}}}}} \right]} \\[22pt] \quad \quad \quad {1^{{\rm{st}}}}{\rm{Term}}\quad \quad {2^{{\rm{nd}}}}{\rm{Term}}\quad \quad \quad {3^{{\rm{rd}}}}{\rm{Term}} \end{array}
\end{equation}$$
Ateshkadi(Reference Ateshkadi, McDonell and Samuelsen4,Reference Ateshkadi, McDonell and Samuelsen16) attempted to address the issue by embedding some of the geometric parameters within SEC shown in Equation (2). In the new correlation, the A'' parameter in the 1st term accounts for the vane angles for the primary and secondary swirler, the swirl sense (co- or counter-swirl), and the presence or absence of venturi in the burner geometry.
 $$\begin{equation}
{{q}_{{\rm LBO}}} \propto \left[ {\frac{{{A''}{{f}_{{PZ}}}}}{{{V}_{c}^{}}}} \right]\left[ {\frac{{{m}_{A}^{}}}{{{P}_3^{\left( {1.3} \right)}{\exp}\left( {{\raise0.7ex\hbox{${{{T}_3}}$} \!
/ \!\lower0.7ex\hbox{${300}$}}} \right)}}} \right]\left[ {\frac{{{D}_{r}^2}}{{{{\lambda }_{r}}{\rm LC}{\rm{V}_{}}}}} \right]{B''}
\end{equation}$$
$$\begin{equation}
{{q}_{{\rm LBO}}} \propto \left[ {\frac{{{A''}{{f}_{{PZ}}}}}{{{V}_{c}^{}}}} \right]\left[ {\frac{{{m}_{A}^{}}}{{{P}_3^{\left( {1.3} \right)}{\exp}\left( {{\raise0.7ex\hbox{${{{T}_3}}$} \!
/ \!\lower0.7ex\hbox{${300}$}}} \right)}}} \right]\left[ {\frac{{{D}_{r}^2}}{{{{\lambda }_{r}}{\rm LC}{\rm{V}_{}}}}} \right]{B''}
\end{equation}$$
There are certain drawbacks that are inherently attached with Equation (2).
-
1. Utilisation of the A'' parameter limits the application scope of SEC to a certain type of burner which was utilised during their research study.
-
2. The effect of the primary liner holes configuration has not been incorporated which certainly affects the LBO performance.
-
3. Even though the generality of Equation (1) is compromised, the improvement reported in prediction accuracy is not noteworthy.
As the geometric parameters are subject to change with evolution of the combustor/burner design and could be huge in number, it is also very cumbersome to list all of them in a single correlation while maintaining the logical connection to the LBO performance. Moreover, it does not present a perpetual solution, keeping in view the evolution in the basic design configuration. Previously, the Flame Volume concept(Reference Xie, Huang, Hu and Wang17-Reference Xie, Huang, Wang and Hu19) has been proposed, in which the geometric parameters are replaced by flame parameters as shown in Equation (3) i.e., β= (V f /Vc). It has been stated that critical flame volume (V f ) is one lumped parameter, which accounts for the complex spatial interaction of mixing due to geometric variation, turbulence, heat transfer and combustion processes inside a primary zone of the combustor. In the flame visualisation study(Reference Xie, Huang, Wang and Hu19), it has been demonstrated that the combustion zone (Vc) is not constant and holds a small region located downstream of atomiser and can be represented by V f . The improved correlation(Reference Xie, Huang, Hu and Wang17), based on Flame Volume Lean Blowout (FV-LBO), has a reported average error = ±16%.
 $$\begin{equation}
{{q}_{{\rm LBO}}} \propto \left[ {\left( {\frac{{K}}{{{{V}_{c}}}}} \right){{\left( {\frac{{\alpha }}{{\beta }} + \left( {1 - {\alpha }} \right)\sqrt {\beta } } \right)}^2}} \right]\left[ {\frac{{{m}_{a}^{}}}{{{P}_3^{\left( {1.3} \right)}{\exp}\left( {{\raise0.7ex\hbox{${{{T}_3}}$} \!
/ \!\lower0.7ex\hbox{${300}$}}} \right)}}} \right]\left[ {\frac{{{D}_{r}^2}}{{{{\lambda }_{r}}{{H}_{r}}}}} \right]
\end{equation}$$
$$\begin{equation}
{{q}_{{\rm LBO}}} \propto \left[ {\left( {\frac{{K}}{{{{V}_{c}}}}} \right){{\left( {\frac{{\alpha }}{{\beta }} + \left( {1 - {\alpha }} \right)\sqrt {\beta } } \right)}^2}} \right]\left[ {\frac{{{m}_{a}^{}}}{{{P}_3^{\left( {1.3} \right)}{\exp}\left( {{\raise0.7ex\hbox{${{{T}_3}}$} \!
/ \!\lower0.7ex\hbox{${300}$}}} \right)}}} \right]\left[ {\frac{{{D}_{r}^2}}{{{{\lambda }_{r}}{{H}_{r}}}}} \right]
\end{equation}$$
The real challenge associated with this methodology is to identify and calculate V f in flow simulations. Fuel Iterative Approximation (FIA) methodology based on cold flow simulations(Reference Hu, Huang and Wang12) and hot flow simulations(Reference Ahmed and Huang15) has been carried out for (V f ) estimation and eventually for LBO prediction. In the proposed FIA iterative loop, each case/geometry must undergo at least 10 simulations until the LBO limit is achieved and a realistic prediction value is approached.
In this work, first the flame volume concept has been taken to the next level of understanding, and the LBO performance has been associated with flow structures prevailing within the primary zone. Moreover, the iteration process has been eliminated and a single RANS simulation is sufficient to pick up the best possible geometry amongst several candidates. The prediction process is robust and suits to the prerequisites of CDS tools. Keeping in view the perspective of CDS of combustors, the lean blowout prediction task has been revisited and tailored in line with contemporary design scenarios.
2.0 MODEL DEVELOPMENT
In this study, the development of prediction model was sliced into two stages.
-
1. The prediction of lean blowout performance was defined in accordance with the CDS.
-
2. LBO performance was associated with flow structures in contrast to previous methodologies where geometric features or flame parameters were directly included in prediction correlations.
2.1 Component design stage
At a CDS, the prime interest is to pick up the best possible combustor configuration amongst several possible candidates. So, an effective prediction methodology would be the one which can state the comparison of LBO performance instead of presenting the absolute value of qLBO. In the perspective of CDS, the prediction problem is simplified. Hence, it is necessary to identify a comparison criterion that must be easily available at CDS for quick design iteration.
Based on the application of engine, its basic configuration and size is decided. This leads to the System Design Stage (SDS) where Boundary Conditions (BCs) and space for individual components is allocated within allowable margins. Afterwards, component design teams are expected to come up with efficient designs for the respective components within allocated design space. Hence, it can be generalised that, at the commencement of CDS, geometric margins and boundary conditions are all pre-set. The combustor design team confronts the same scenario i.e., for a prescribed amount of energy jump on working fluid, the type, configuration and size of combustor are pre-set in light of previous design data and engineering intellect. The real challenge is how to fully exploit the allocated space to get the maximum benefits in terms of smooth start-up, operation, low emissions, maximum operating envelope, and LBO performance.
Figure 1 presents a pictorial demonstration of factors affecting LBO performance. The qLBO is dependent on three terms: geometric (1st term), operating conditions (2nd term) and spray (3rd term). The boundary conditions for individual components are decided at SDS and remain unchanged during CDS. Hence, for the all the candidate geometries, the inlet boundary conditions are constant and the 2nd term can be neglected. Similarly, the 3rd term also remains unchanged if the fuel and atomiser have already been fixed. Hence, the LBO performance is primarily dependent on the geometric term. After omitting the 2nd and 3rd terms from Equation (4), it takes the form as shown in Equation (5) which holds valid for the subject scenario. Generally, at CDS, 5 to 10 candidate geometries are under investigation and their relative LBO performances are required. The prime variation lies in the dome's section that is also called the primary combustion zone. This zone is responsible for efficient combustion and most of the complex phenomena of chemistry, two-phase flow, mixing and sudden variation in thermodynamics states take place here. For these reasons, the design of this section is of key and prime importance in the component design of the combustor. Additionally, the LBO performance is also connected with the geometric feature of this section and hence the flow structure has evolved as a result.
 $$\begin{equation}
{q}_{{\rm LBO}} \propto \frac{{\left[ {{\rm{Geometric}}\ } \right]}}{{{\rm{Ist\ Term}}}}{\rm{\ \ \ \ \ \ }}\frac{{\left[ {{\rm{Operating}}\;{\rm{Conditions}}} \right]}}{{{\rm{2nd\ Term}}}}{\rm{\ \ \ \ }}\frac{{\left[ {{\rm{Atomisation}}} \right]}}{{{\rm{3rd\ Term}}}}{\rm{\ }}
\end{equation}$$\\
$$\begin{equation}
{q}_{{\rm LBO}} \propto \frac{{\left[ {{\rm{Geometric}}\ } \right]}}{{{\rm{Ist\ Term}}}}{\rm{\ \ \ \ \ \ }}\frac{{\left[ {{\rm{Operating}}\;{\rm{Conditions}}} \right]}}{{{\rm{2nd\ Term}}}}{\rm{\ \ \ \ }}\frac{{\left[ {{\rm{Atomisation}}} \right]}}{{{\rm{3rd\ Term}}}}{\rm{\ }}
\end{equation}$$\\
 $$\begin{equation}
{q}_{{\rm LBO}} \propto \frac{{\left[ {{\rm{Geometric\ }}} \right]}}{{{\rm{Ist\ Term}}}}
\end{equation}$$
$$\begin{equation}
{q}_{{\rm LBO}} \propto \frac{{\left[ {{\rm{Geometric\ }}} \right]}}{{{\rm{Ist\ Term}}}}
\end{equation}$$
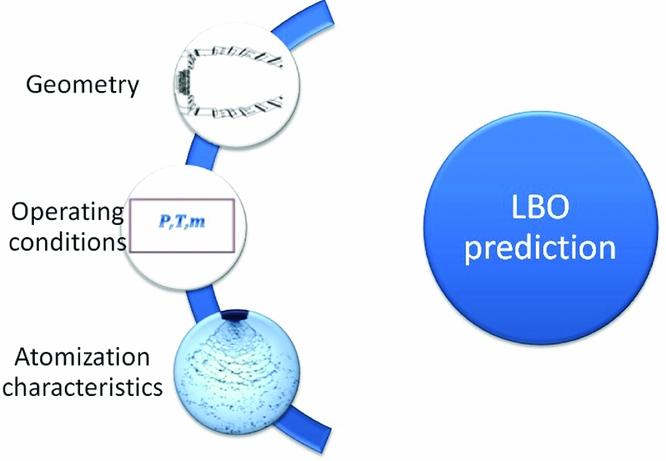
Figure 1. Terms affecting the qLBO performance of combustor.
2.2 Evolution of geometric term
Based on conceptual approaches, the evolution of 1st term (i.e., geometric term) in SEC is shown in Fig. 2. This evolution is linked with the improvement in the understanding of flow physics. Lefebvre and Ateshkadi models are limited by geometric parameters while the Huang model(Reference Xie, Huang, Hu and Wang17-Reference Xie, Huang, Wang and Hu19) has associated LBO performance with flame parameters which is indeed a remarkable advancement. The flame volume approach is better in the sense that it eliminates geometric parameters and is focused on the final flame structure, which is uniquely linked with the geometric features and dimensions of the combustors. But flame volume is a single parameter that does not contains much information about flow structures and is difficult to estimate both numerically and experimentally. Hence, in this endeavour, a set of variables were presented that are easy to estimate. The flame volume concept was further sliced into multiple parameters within the Inner Recirculation Zone (IRZ) which were estimated by numerical simulation. Moreover, the prediction philosophy was made simpler by eliminating the FIA and LBO performance predictions, which can now be performed with a single RANS simulation.
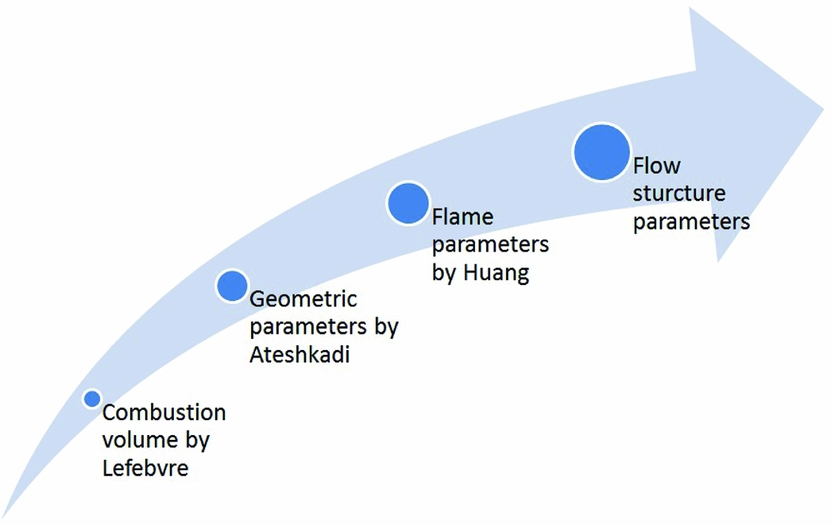
Figure 2. Evolution of Geometric term in SEC.
2.3 Flow structures
The flow structures ensure the flame stability and eventually dictate LBO performance. The LBO phenomenon was presented as a contest between ignition inciters (ignition forces) and inhibitors (quenching forces) within flame. It was proposed that flame stability is associated with the strength of these competing factors. The ignition inciters aid the reignition events at the flame root while inhibitors aid extinction. Therefore, the probability of the flame to remain lit and the endurance of the instabilities depends on the strength of ignition inciters. Moreover, a methodology to quantify the inciters with the aid of thermodynamics and flow information within the flow structures was proposed. The best possible configuration can be determined efficiently by the comparison of these forces among candidate geometries. A set of parameters were identified to quantify the quenching or reigniting forces, and based on them a comparison criterion has been generated to determine the best geometry.
The flow structure of most swirl flames consists of a cone-shaped stream of fresh gas entering the chamber from the burner nozzle(Reference Stöhr, Boxx, Carter and Meier20) and results in the formation of the Inner Recirculation Zone (IRZ) and Outer Recirculation Zone (ORZ), as shown in Fig. 3. The IRZ, the flow structure of prime interest, is strongly linked with the pre-dilution geometric of the combustor and is responsible for flame stabilisation in the majority of combustors. The IRZ prevents(Reference Vanoverberghe, Van Den Bulck and Tummers21) the forward progress of the incoming fuel and air and deflects the mixture radially away from the axis which encourages flame anchoring. It also serves a triple purpose(Reference Sturgess, Sloan, Lesmerises, Heneghan and Ballal22): (i) to generate a low-velocity region, (ii) to provide a high-residence time for the flame to propagate into the incoming fresh mixture, and (iii) to serve as a source of continuous ignition for the flammable fuel-air mixture. For these reasons, the flow and thermodynamics information hidden in the IRZ has a vital impact on LBO performance and could be very helpful if utilised in prediction methodology.
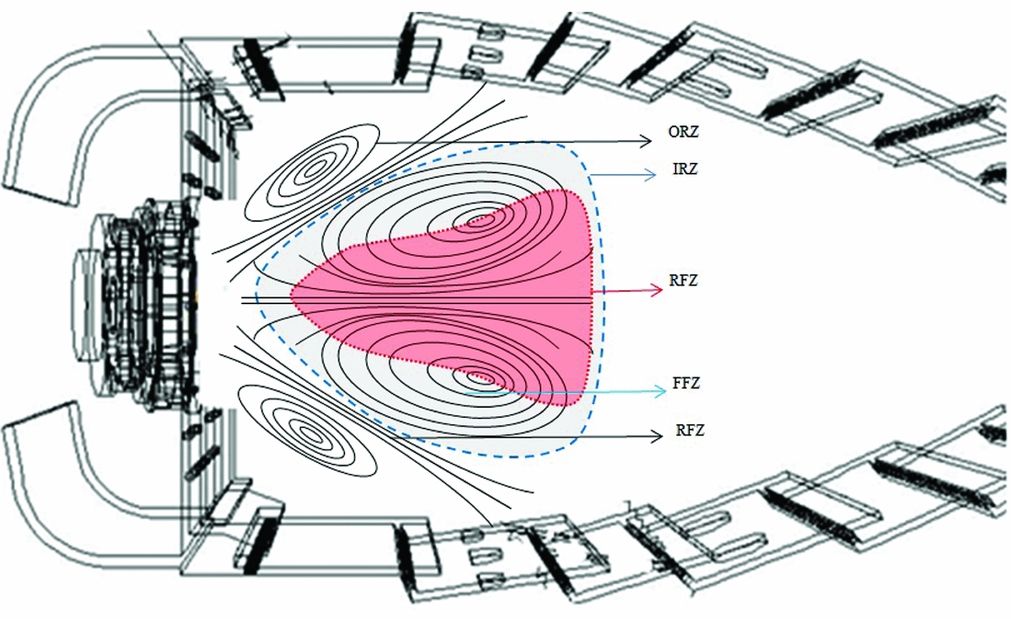
Figure 3. Schematic of flow structure in the primary combustion zone.
The most essential flow structure, the Inner Recirculation Zone (IRZ), which plays a vital role in flame anchoring for all swirl-stabilised combustors, is shown in Fig. 3. Its volume and shape are dictated by the geometric feature of the primary combustion zone. The local velocity distribution within the IRZ is affected by the amount of air entering from the swirler, dome and primary holes. Hence, the dynamics of the IRZ are strongly associated with the geometric feature of primary combustion zone, and influence the flame stability and LBO performance. The IRZ can be further categorised into Forward Flow Zone (FFZ) and Reverse Flow Zone (RFZ). Each zone is shown in Fig. 3 where the RFZ is represented by red colour and the FFZ by blue colour. The thermodynamic and flow information hidden in the IRZ (FFZ+RFZ) is a unique function of dome geometry. If the size, shape, heat content and intensity of flow reversal within this flow structures can be determined with sufficient confidence, the LBO performance of candidate combustor geometries can be compared and the best geometric configuration can be picked up.
Keeping in view the difficulty attached to the identification of the IRZ in the solution domain, the RFZ marked by Vx = 0 was used to gather flow and thermodynamics information. It can be distinguished easily and required information within the flow structures can be retrieved from the simulation. To resolve flow and thermodynamics field, reactive flow simulations against all possible geometries were carried out with Reynolds-Averaged Navier–Stokes (RANS). Selection of RANS simulation maintains the robustness and simplicity as a prerequisite of the preliminary design tool. The prediction model is based on the following two assumptions:
-
1. Area of Inner Recirculation Zone (IRZ) is directly proportional to Reverse Flow Zone (RFZ).
-
2. Flow is axis-symmetric along the centreline of fuel injector
When resolved in time domain, flame is combination of small flamelets which shed downstream of the RFZ. A part of hot product gases are entrained by the IRZ to maintain the high temperature and provide a continuous ignition source for the incoming fresh mixture. Hence, primary combustion zone may be regarded as a war region between reigniting and quenching forces. Fresh gases and fuel spray entering the IRZ zone at a lower temperature, flame stretch due to turbulence, shedding of flamelets downstream, radiative heat loss and traverse cold jets from the liner, are some of the quenching forces. On the contrary, the entrainment of hot gases, negative axial velocity within the RFZ and heat content available within the RFZ serve as reigniting forces. The lean blowout limit for any combustor is a point where quenching forces take over the reigniting forces. If the quantification of all the ignition and quenching forces can be done, then it is possible to calculate the absolute value of qLBO. But, due to limited knowledge, the understanding and information of all the terms may not be possible in the pretext of limited experimental data, understanding of actual combustion phenomena and CFD bottlenecks. Hence, a comparatively simple approach has been adopted in this study and it was proposed that the LBO performance prediction is possible with the estimation of igniting forces. The quantification of ignition forces was carried out with the following four parameters within RFZ:
-
1. Area of reverse flow region (ARFZ)
-
2. Average temperature of RFZ (TAvg, RFZ)
-
3. Maximum negative velocity in RFZ (Vx)
-
4. Average velocity within RFZ (VAvg)
Hence, the geometric term in SEC is replaced with the above-mentioned four parameters and the correlation is presented as shown in Equations (6) and (7).
 $$\begin{equation}
{q_{\rm LBO}} \propto {\left[ {{A^a}T_{Avg}^bV_x^cV_{Avg}^d} \right]_{\rm RFZ}}
\end{equation}$$
$$\begin{equation}
{q_{\rm LBO}} \propto {\left[ {{A^a}T_{Avg}^bV_x^cV_{Avg}^d} \right]_{\rm RFZ}}
\end{equation}$$
 $$\begin{equation}
\begin{array}{@{}l@{}} {q_{\rm LBO}} \propto \underline {{{\left[ {{A^a}T_{Avg}^bV_x^cV_{Avg}^d} \right]}_{\rm RFZ}}} \quad \underline {\left[ {\frac{{m_A^{}}}{{P_3^{\left( {1.3} \right)}{\rm{exp}}\left( {{\raise0.7ex\hbox{${{T_3}}$} \!
/ \!\lower0.7ex\hbox{${300}$}}} \right)}}} \right]} \ \quad \underline {\left[ {\frac{{D_r^2}}{{{\lambda _r}{H_r}}}} \right]} \\[22pt] \quad \quad \quad \quad \quad {{\rm{1}}^{{\rm{st}}}}\;{\rm{Term}}\quad \quad \quad \quad \quad {{\rm{2}}^{{\rm{nd}}}}\;{\rm{Term}}\quad \quad \quad {{\rm{3}}^{{\rm{rd}}}}\;{\rm{Term}} \end{array}
\end{equation}$$
$$\begin{equation}
\begin{array}{@{}l@{}} {q_{\rm LBO}} \propto \underline {{{\left[ {{A^a}T_{Avg}^bV_x^cV_{Avg}^d} \right]}_{\rm RFZ}}} \quad \underline {\left[ {\frac{{m_A^{}}}{{P_3^{\left( {1.3} \right)}{\rm{exp}}\left( {{\raise0.7ex\hbox{${{T_3}}$} \!
/ \!\lower0.7ex\hbox{${300}$}}} \right)}}} \right]} \ \quad \underline {\left[ {\frac{{D_r^2}}{{{\lambda _r}{H_r}}}} \right]} \\[22pt] \quad \quad \quad \quad \quad {{\rm{1}}^{{\rm{st}}}}\;{\rm{Term}}\quad \quad \quad \quad \quad {{\rm{2}}^{{\rm{nd}}}}\;{\rm{Term}}\quad \quad \quad {{\rm{3}}^{{\rm{rd}}}}\;{\rm{Term}} \end{array}
\end{equation}$$
The above-mentioned selected parameters serve in anchoring the flame at the exit of spray nozzle. Their quantitative values are associated with geometric variation. Under the pre-set values against 2nd and 3rd term, the design iteration is mostly left with the variation of geometric configuration. The macro dimensions of combustors are predetermined and they are dictated by the maximum size of combustor and the length margins set for component design. The micro geometry variation could affect the performance of combustor. These macro parameters include the design of swirler, swirl number, amount of air introduced by the swirler, and the cooling holes in the dome. Moreover, the length of IRZ is dictated by the location of primary holes. But the configuration of primary holes can be varied to generate different design.
3.0 COMPUTATIONAL ANALYSIS
To evaluate the selected parameters within candidate geometries and demonstrate the authenticity of the proposed model, RANS simulations were conducted. With a systematic variation in the geometric parameters of primary combustion zone, 11 combustor geometries were selected where the base-level geometric parameters were kept constant i.e., the dome height (92 mm), liner length (226 mm) and combustor volume (0.00129 m3). The focus is kept on the variation of four components including swirler, venturi, flare and primary holes. They were systematically varied to embed the effect of dome's geometry on the selected parameters and ultimately been utilised for the prediction of qLBO performance. For the estimation of the parameter, the reactive flow simulations were carried out for all candidate geometries at a fixed AFR. The value of AFR can be selected as a mid-point of operating range of engine. For the present scenarios, AFR = 150 was selected and parameters were estimated. The key feature of this prediction methodology is that the LBO performance can be predicted with the help of a single RANS simulation making it a robust technique and fulfilling all the prerequisites necessary for preliminary design tool. The isometric view of combustor sector is shown in Fig. 3 and the geometric parameters are listed in Table 1. Each geometric configuration was meshed with grid cells amounting to 3.5 million, in GAMBIT 2.3.16. Tetrahedral grids were generated in/around the dome and the liner. Other regions were generated in hexahedral grids. RANS simulation was conducted on an 18° periodic sector in FLUENT 15.0. Boundary condition for numerical simulations are shown in Table 2. A validation computation of the numerical simulation methods used in the present study was done on a model combustor assembled with an axial swirl-cup. The flow field in the model combustor measured by Davoudzadeh et al.(Reference Davoudzadeh, Liu and Moder23) using laser Doppler velocimetry and the detailed comparison of flow velocities has been done in the previous study(Reference Hu, Huang, Wang and Xie24). The solution time for one simulation is approximately 3 hours on an IBM-compatible Dell® Precision 530 (twin Intel® Xeon™ CPU having 2.4 GHz speed and 2-gigabyte ram) workstation. The details of complete reactive flow simulation can be found in Ref. (Reference Ahmed and Huang15).
Table 1 Geometric configuration of combustors

Table 2 Boundary conditions for RANS solution

4.0 EXPERIMENTAL SET-UP
To generate experimental data for qLBO, a single-dome rectangular combustor model with optical access was used. The basic schematic of the test facility is shown in Fig. 4. All experiments were conducted at 1 bar and 25K in the combustion test facility of Beihang University, shown in Fig. 3. The experimental procedure is as follows:
-
1. The combustor was purged with five times its volume before start-up.
-
2. For a constant airflow rate, the fuel flow was set for an equivalence ratio of 1, which established a successful ignition. The combustor was maintained under the stable region for approximately 10 minutes to achieve thermal equilibrium.
-
3. The LBO limit was achieved by gradually decreasing the fuel flow rate.
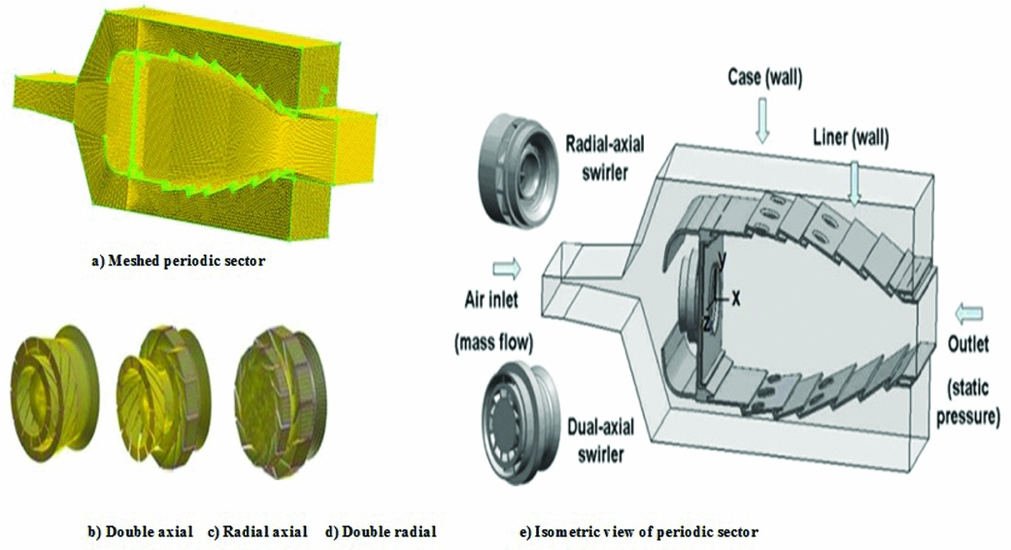
Figure 4. Swirl cups and computational domain.
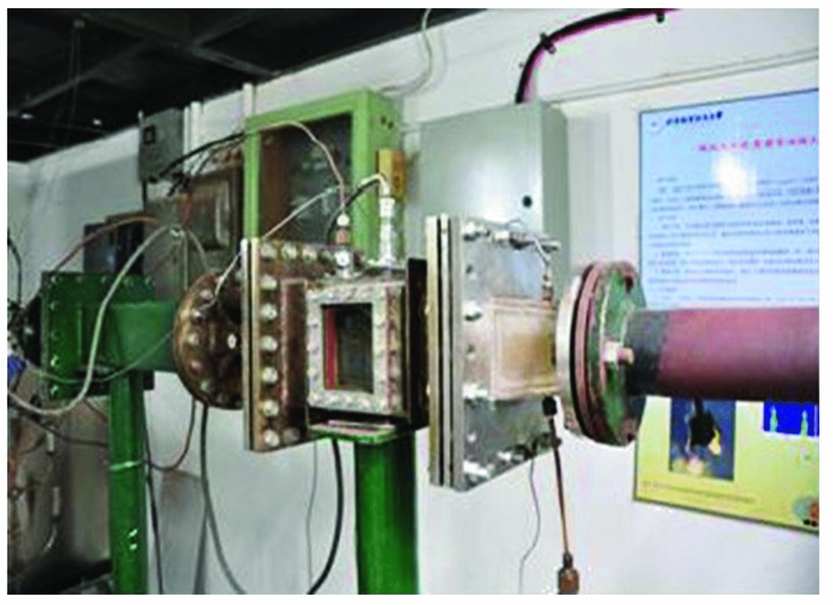
Figure 5. Experimental test rig for LBO testing.
The measurement uncertainty in experiments was within ±4%. A detailed description of rig, errors analysis and V f measurement can be found in a previous work(Reference Xie, Huang, Wang and Hu19). The LBO value measure for each configuration is presented in Table 3 along with the qLBO data.
Table 3 Experimental Lean blowout data measured against 11 geometric configurations

5.0 RESULTS AND DISCUSSION
Not many researchers tried to improve the geometric term (1st term) within Equation (4). The association between LBO performance with the geometric parameter of the combustor is the most rudimentary approach(Reference Ballal and Lefebvre1,Reference Ateshkadi, McDonell and Samuelsen4) which has certain drawbacks. The most important is that it does not present a perpetual solution keeping in view the evolution in basic design configuration. Afterwards, the association of LBO performance with flame parameter(Reference Stöhr, Boxx, Carter and Meier20) is also a remarkable development in an aspect that it eliminates geometric parameters for SEC. But, flame volume being a single parameter containing huge flow and thermodynamic information within itself is difficult to estimate. Moreover, due to FIA iterative process is lengthy and not robust enough to match with the need of the CDS tool. Hence, flame volume concept was further sliced into multiple parameters within the IRZ which are easy to estimate with single RANS simulation. Moreover, the endeavour to define the LBO performance prediction in the context of CDS led to the simplification of the task. Afterwards, the perpetual relationship between LBO performances with the geometric variation was presented with the help of flow structures i.e., the Inner Recirculation Zone (IRZ).
The global stability of the flame is influenced by the shape, size, and strength of the IRZ. The length of the recirculation bubble is mainly dictated by the location of the primary holes on the liner. But the width and shape can have infinite profiles; each shape/profile is uniquely linked with the geometric features and configuration of the primary zone (dome geometry). Dome geometry includes swirler (axial, radial or a combination of both), vane angles, flare, venturi, air distribution between primary and secondary swirl, and pattern of primary holes on the liner. Depending on the dome geometry, there could be infinite possible profiles of the IRZ which eventually affects the LBO performance of the combustors. Apart from the shape/profile, the magnitude and strength of flow structures also has vital influence on the flame stability. So, it is important to capture the main features of flow structure for effective prediction of a LBO performance.
The RANS simulations for 11 geometric, mentioned in Table 1, were conducted and the results were analysed. The trend of various parameters was studied in the context of qLBO performance of each case. Based on which the four parameters were selected and it is believed that they can provide the most important and valuable information necessary for quantification of ignition forces. Once the ignition forces within candidate geometry are quantified, the comparison of them can provide sufficient leads to pick up the best geometry.
5.1 Reverse flow zone
Though all the information within the IRZ is vital to the flame stability and somehow influences the LBO performance, this study is limited to variables information within the RFZ. There are two reasons behind it, first it is difficult to identify the IRZ in the solution domain while the RFZ can be easily captured by Vx = 0 contour and second the RFZ is responsible for entrainment of burned hot gases and get them back to the flame root which is a prime factor in dictating the flame stability. The RFZ actually serves as a continuous heat source and constitutes a major portion within the IRZ.
Conventionally, this low-velocity region is considered a Well Stirred Reactor (WSR) with the mixing-cup temperature approach, but the evolution in understating of flow physics has revealed that temperature gradients exists within it. The size of the RFZ represents both the mass of air and quantity of heat present in the flow structure and serves as a continuous troche for the incoming fresh air and fuel mixture.
5.2 Area of RFZ
The area of the RFZ (ARFZ) helps in deciding the magnitude of ignition forces. The ARFZ for all the configurations has been calculated and plotted in Fig. 6. The linear relationship of ARFZ against the lean limit is acceptable except for the highlighted point. The logic behind this was explained with the help of hot gases entrainment within the flow structure. The two types of flow structures are shown in Fig. 7. The comparison between Figs 7(a) and 7(b) demonstrates that for the scenario having the same value of AAFZ does not mean the same proportion of ignition forces. Rather, the flow structure will decide how much of the hot gases are injected back into the recirculation bubble. The one with more hot air entraining (Fig. 7(a)) will offer more stable flame than the other (Fig. 7(b)). Therefore, to differentiate between these two scenarios, there must be some parameter that has the ability to cater for amount of entrained hot or cold gases within the RFZ. Hence, the temperature information within solution domain was incorporated.

Figure 6. Area of RFZ vs AFR at LBO.
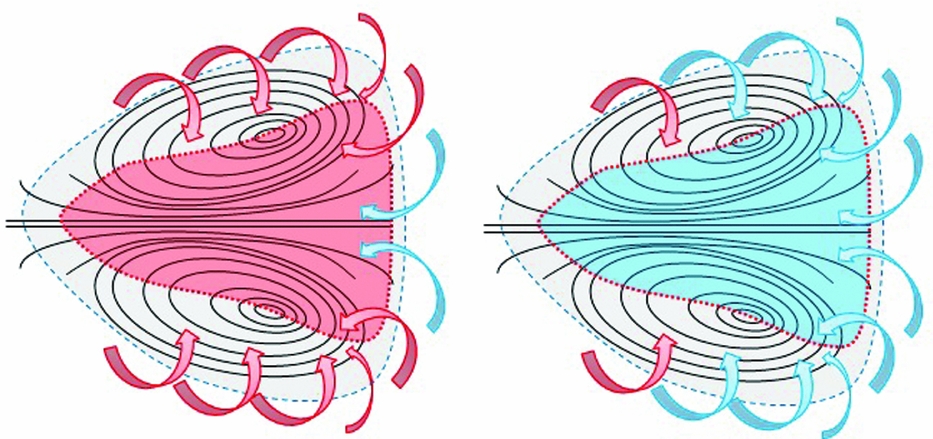
Figure 7. Flow structure dictates the portion of hot and cold injection within RFZ.
5.3 Average temperature
Based on the concept of the entrainment of hot gases linked with the flow structure, the knowledge of the temperature within the RFZ is vital to the LBO performance. In the absence of this information, simply the effect of AAFZ on the LBO performance cannot present a holistic view of the fact explained in Fig. 7. A similar study has been reported by Xiao(Reference Xiao and Huang25) which states that, as a result of increased swirl velocity, the cold air from primary holes increases due to stronger recirculation region. This entrainment of the larger amount of cold air decreases the local AFR in the IRZ and the temperature of the burning zone, which leads to alleviation of the LBO value (meaning that the LBO value increases and the flammable band decreases). But under the new concept of entrainment based on flow structure, it was stated that an opposite scenario with the entrainment of more hot gases within the RFZ would be to widen the operating envelop of the combustor and encourage the flame stability. It depends on the flow structure of the RFZ.
It can be observed in Fig. 8 that each configuration presents a unique temperature profile that depends on the flow structure within the primary zone. The blue part of the RFZ in most cases represents the injection of cold gases from the primary liner holes. The 90% red colour for case 11 advocates the entrainment of more hot gases and eventually lower lean blowout limit. The average temperature Tavg in RFZ was calculated and plotted against experimentally measured LBO value in Fig. 9. The Tavg = 1000K for case 4 points toward the weakest ignition forces present within it. The highest Tavg~1500K was observed for cases 6 and 8. The dispersion of data along the linear fit may not lead to any logical inference if seen in isolation. But, we will see that suitable selection of two parameters would produce a logical inference.
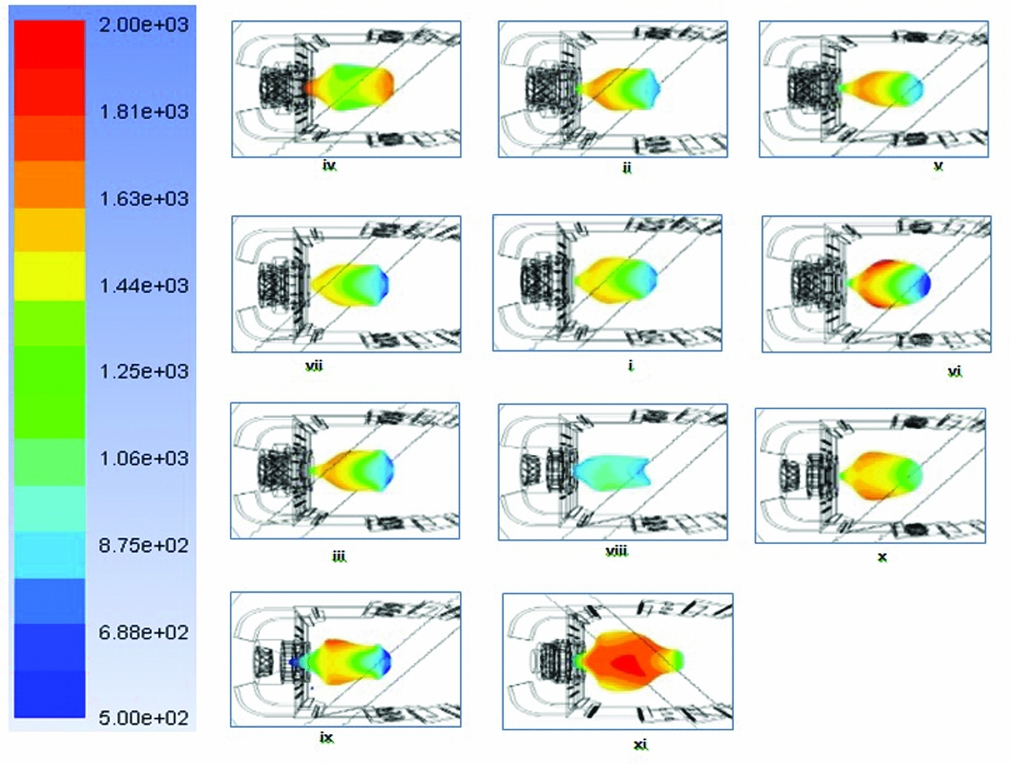
Figure 8. Temperature distribution within the RFZ for all combustor cases.

Figure 9. Temperature of RFZ vs AFR at LBO.
Heat content (HC) was defined as a product of ARFZ & Tavg and represents one of the vital igniting forces within the combustor. The plot of HC is shown in Fig. 10 which exhibits a very logical linear relationship with LBO performance of candidate combustor geometries. It can be seen that random data for individual parameters (ARFZ & Tavg) becomes logical when properly combined to quantify the ignition forces. The linear alignment of HC along the experiments depicts that HC presents thermodynamic information with RFZ and it is very crucial for LBO performance. But the data is not sufficient and flow parameters information has to be included.

Figure 10. Heat Content vs AFR at LBO.
5.4 Negative axial velocity
The flame root, whether lifted to or attached to the nozzle is intrinsically unstable. Reason being, it presents a junction region for hot burned gases and relatively cold fresh flammable mixture. As a result, it is declared as a high-strain-rate region(Reference Marchione, Ahmed and Mastorakos26) featuring frequent extinction and reignition events. Under this scenario, the greater negative axial velocity within the RFZ serves as a significant ignition promotor that offers two advantages: (1) it brings hot burned gases close to the incoming flammable mixture in the vicinity of the nozzle and (2) it aids the flame front in travelling back up to the nozzle by aiding the apparent flame velocity. The flame front can ride on the negative axial velocity that actually results in increased flame speed. The Vx is plotted in Fig. 11. The larger value of Vx represents more momentum of heat source back to flame root. The shifting of Vx,min from downstream to upstream would change the flow structure and effect the flame-holding mechanism. It is visible from Fig. 12 that for the more stable flame, the Vx,min is close to the injection point. As Vx,min moves away from the injection point, the stability of the flame to withstand the quenching forces will be reduced.
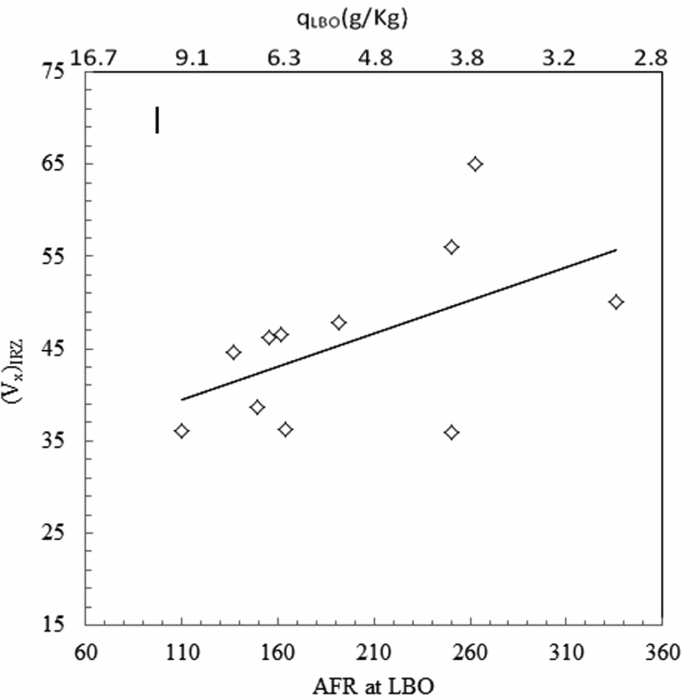
Figure 11. Axial velocity vs AFR at LBO.
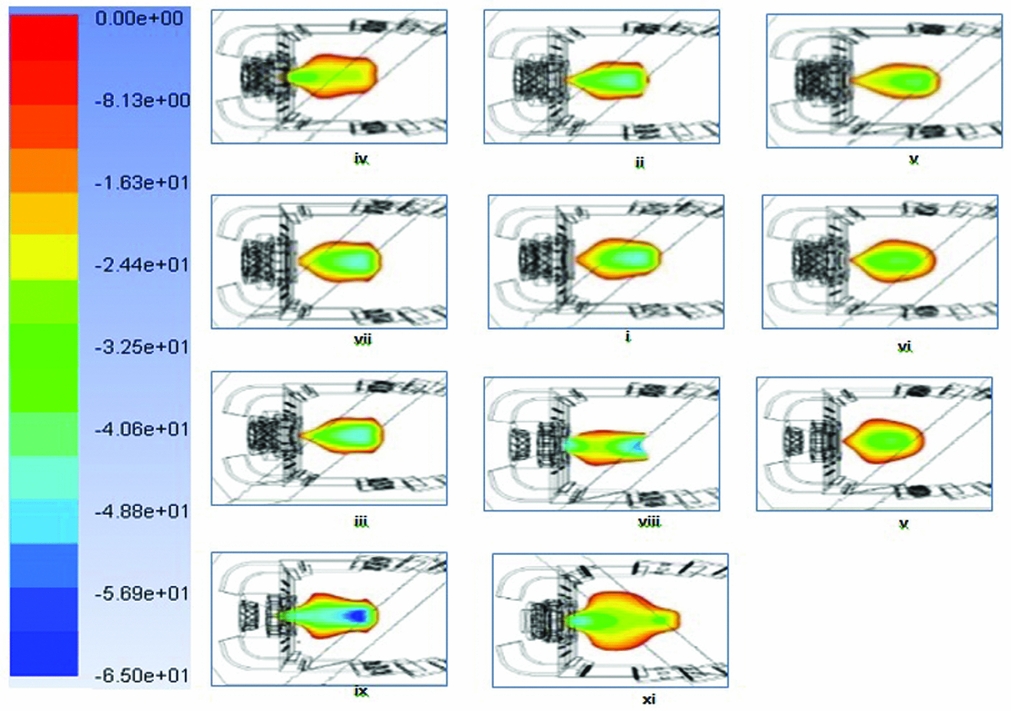
Figure 12. Axial velocity distribution within the RFZ for all combustor cases.
The LBO phenomenon also has some analogy with ignition phenomena. Under both scenarios, the ignition and extinction forces compete, and whichever has more probability to occur takes the lead. Hence, the inferences based on ignition studies can be generalised in LBO studies. Ignition studies by Mastorakos(Reference Marchione, Ahmed and Mastorakos26) suggest that the probability of flame establishment is more likely when ignition source is located in a region of negative velocity, which emphasises the importance of this Vx parameter. Moreover, it is also suggested that the ignition efficiency is 100% at axial distances where the recirculation zone has maximum width. The phenomena can be explained by Vx contours shown in Fig. 12. It is evident that at more downstream locations, the entrained cold air from primary liner holes presents a hostile environment to the flame kernel and discourages flame propagation. It is also visible that when Vx > │50│, as for cases 9 and 11, the flames were stable and improved LBO performance was achieved.
5.5 Heat content factor
The magnitude of heat source (HC) and its velocity (Vx) to get back to the flame root is crucial to the flame stability. The Heat Content Factor (HCF) is defined as a product of HC and Vx. It acts like an ignition source present within recirculation bubble. The phenomenon is analogous to spark an ignition event with a certain probability of the flame kernel moving upstream that quantifies the ignition probability of the combustor. Hence, HCF is intelligently linked with the variation of geometric features. Its larger value imitates the scenario of a high-energy ignition source and would result in better flame stability. The geometry with the highest value of HCF offers more endurance to the extinction events. The HCF is plotted against AFR in Fig. 13, and the trend seems very logical where 70% of the data is very well organised along the linear fit. The major problem can be seen around the three geometries with qLBO~250AFR.

Figure 13. Heat wave vs AFR at LBO.
Flame strain is a measure of the fractional rate of the increase of flame front area and is directly related to the velocity gradient. The smaller value of average velocity (V) in the RFZ will result in lower velocity gradients and would ultimately encourage flame stability. As HCF is inversely proportional to V, so the average velocity was placed in the denominator in Equation (6). To evaluate the optimised values for exponents (a, b, c and d) in Equation (6), the non-linear data fitting function in MATLAB was applied. The function is described in Equation (8):
 $$\begin{equation}
{\rm{beta}} = {\rm{nlinfit}}\left( {X,Y,\;{\rm{modelfun}},\;{\rm{beta}}0} \right)
\end{equation}$$
$$\begin{equation}
{\rm{beta}} = {\rm{nlinfit}}\left( {X,Y,\;{\rm{modelfun}},\;{\rm{beta}}0} \right)
\end{equation}$$
This function returns a vector of estimated coefficients for the non-linear regression of the responses in Y on the prediction of X using the model specified by model function (modelfun). The coefficients are estimated using iterative least squares estimation with initial values specified by beta. After applying the non-linear data fitting, Equation (6) can be written as Equation (9).
 $$\begin{equation}
{q_{\rm LBO}} \propto {\left[ {\frac{{{A^{0.2}}T_{Avg}^2V_x^2}}{{V_{Avg}^{1.5}}}} \right]_{\rm RFZ}}
\end{equation}$$
$$\begin{equation}
{q_{\rm LBO}} \propto {\left[ {\frac{{{A^{0.2}}T_{Avg}^2V_x^2}}{{V_{Avg}^{1.5}}}} \right]_{\rm RFZ}}
\end{equation}$$
Figure 14 demonstrates a close agreement between the predicted and experimental data for 11 combustor configurations. The quantification of inciters among candidates geometry produced a promising results. This technique provides the quickest and the simplest methodology to predict LBO performance among candidates’ geometries. Moreover, it also fulfils the demands of preliminary design tool since it is a robust system and only one simulation per geometry can provide the required data.

Figure 14. Performance parameter vs AFR.
6.0 CONCLUSION
In this LBO prediction methodology, the problem has been simplified to account for the variation in the primary zone geometry under the pretext of existing design scenarios. It has been explained that the prediction based on the size and intensity of the flow structure offers a more logical and perpetual solution. Moreover, the information within the flow structure, which is responsible for flame anchoring and stability, is most vital in the LBO prediction. If this information can be estimated among the candidate geometries, then the LBO performance evaluation can be predicted with sufficient confidence. The major conclusions derived from this research study are as follows:
-
1. The LBO prediction problem has been redefined and aligned with the contemporary component design scenarios faced by combustor designers. The prediction methodology proposed in this work is robust and with single RANS simulation is sufficient to predict the LBO performance among possible candidate combustors with different geometries.
-
2. The prediction process has been associated with the flow structure instead of geometric features/dimensions which makes this prediction methodology applicable for a wide range of combustor configurations. Moreover, it also presents a perpetual solution and makes a prediction which is independent of the base geometric design.
-
3. The LBO performance has been explained in terms of ignition forces. The forces were quantified with four selected parameters within the reverse flow zone. The selected parameters successfully quantify the size and magnitude of the continuous heat source present within the IRZ.
SUPPLEMENTARY MATERIAL
To view supplementary material for this article, please visit https://doi.org/10.1017/aer.2017.131


